Coincident Economic Indicators
Interactive Charts
Coincident Indicators: A Near Real-Time Economic Snapshot
The Gross Domestic Product (GDP), while a comprehensive measure of economic activity, suffers from a significant drawback: its data is released with a considerable time lag. This delay makes it challenging to accurately assess the current state of the economy. To address this, economists utilize coincident indicators, which are economic metrics that move in tandem with the overall business cycle, providing a near-real-time snapshot of economic health.
These indicators are designed to reflect the present condition of the economy, offering a more timely assessment than lagging indicators (which confirm past trends) or leading indicators (which predict future trends). By analyzing coincident indicators, policymakers and investors can gain a clearer picture of whether the economy is expanding, contracting, or remaining stable.
Our coincident indicator framework is built upon four fundamental pillars (Figure 1), each representing a crucial aspect of economic activity:
- Income: This pillar reflects the earnings of individuals and businesses, indicating the overall purchasing power and financial health of the economy.
- Consumption: This measures consumer spending, a significant driver of economic growth, reflecting the demand for goods and services.
- Production: This encompasses industrial output and manufacturing activity, signifying the supply side of the economy.
- Employment: This pillar tracks the number of employed individuals and the unemployment rate, reflecting the labor market’s health and overall economic activity.
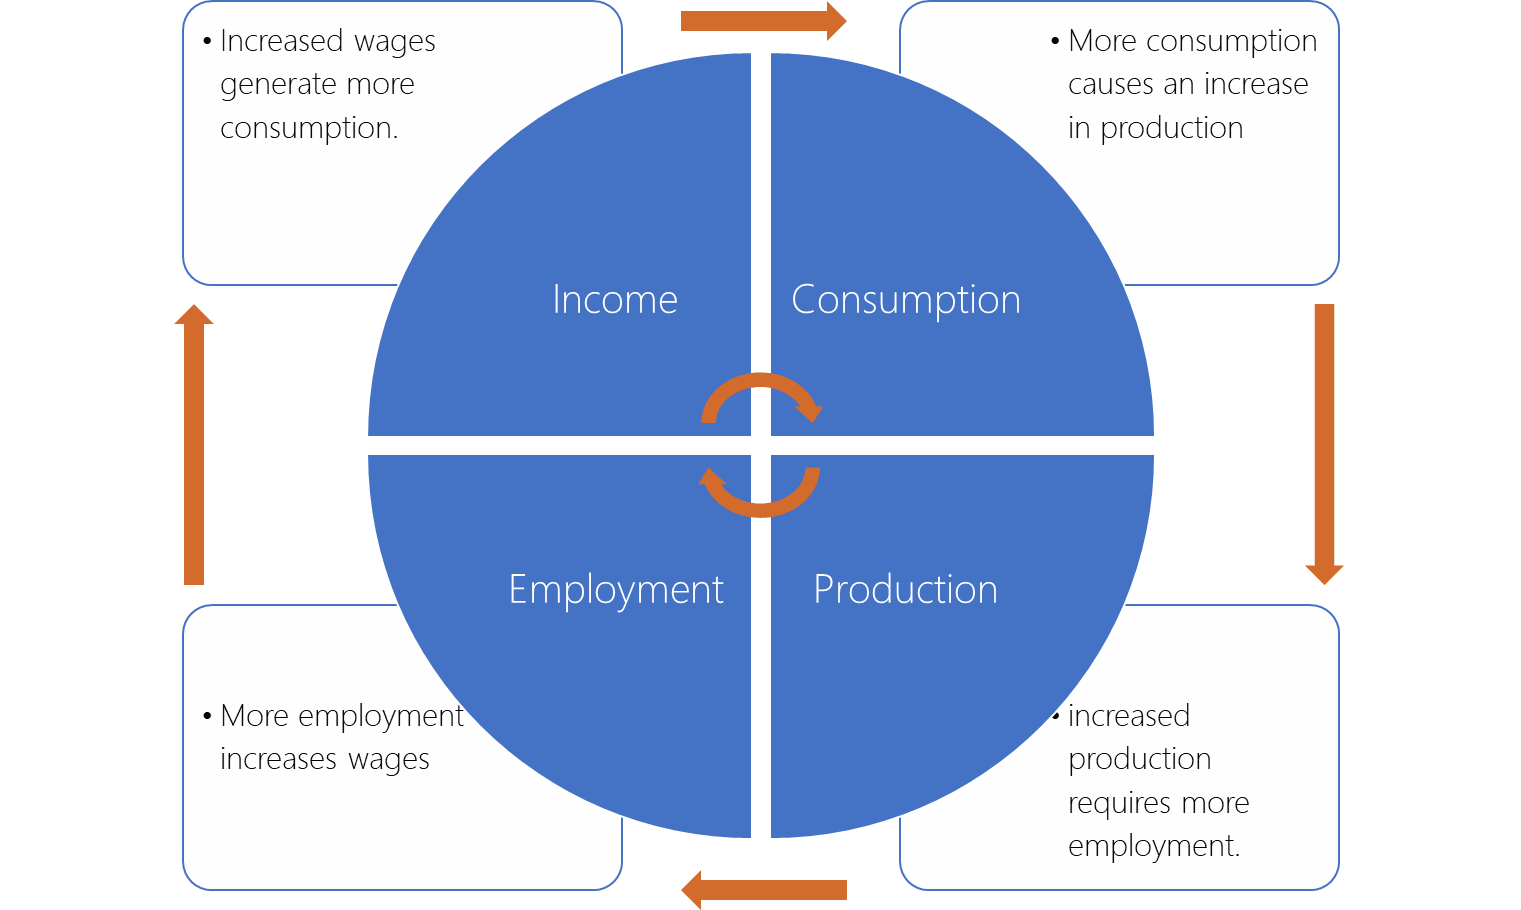
The interconnectedness of these pillars is crucial. Each pillar influences and is influenced by the others. For example, increased employment leads to higher income, which in turn fuels consumption and production. Conversely, a decline in production can lead to job losses, reduced income, and decreased consumer spending.
This interconnectedness highlights the importance of monitoring all four pillars simultaneously. If all four corners of the economy remain robust, it suggests a healthy and stable economic environment, making a recession less likely. However, if one pillar falters, it can trigger a domino effect, negatively impacting the other pillars and potentially leading to broader macroeconomic instability. By closely tracking these coincident indicators, we can gain a more accurate and timely understanding of the economy’s current state and anticipate potential shifts in the business cycle.
Income
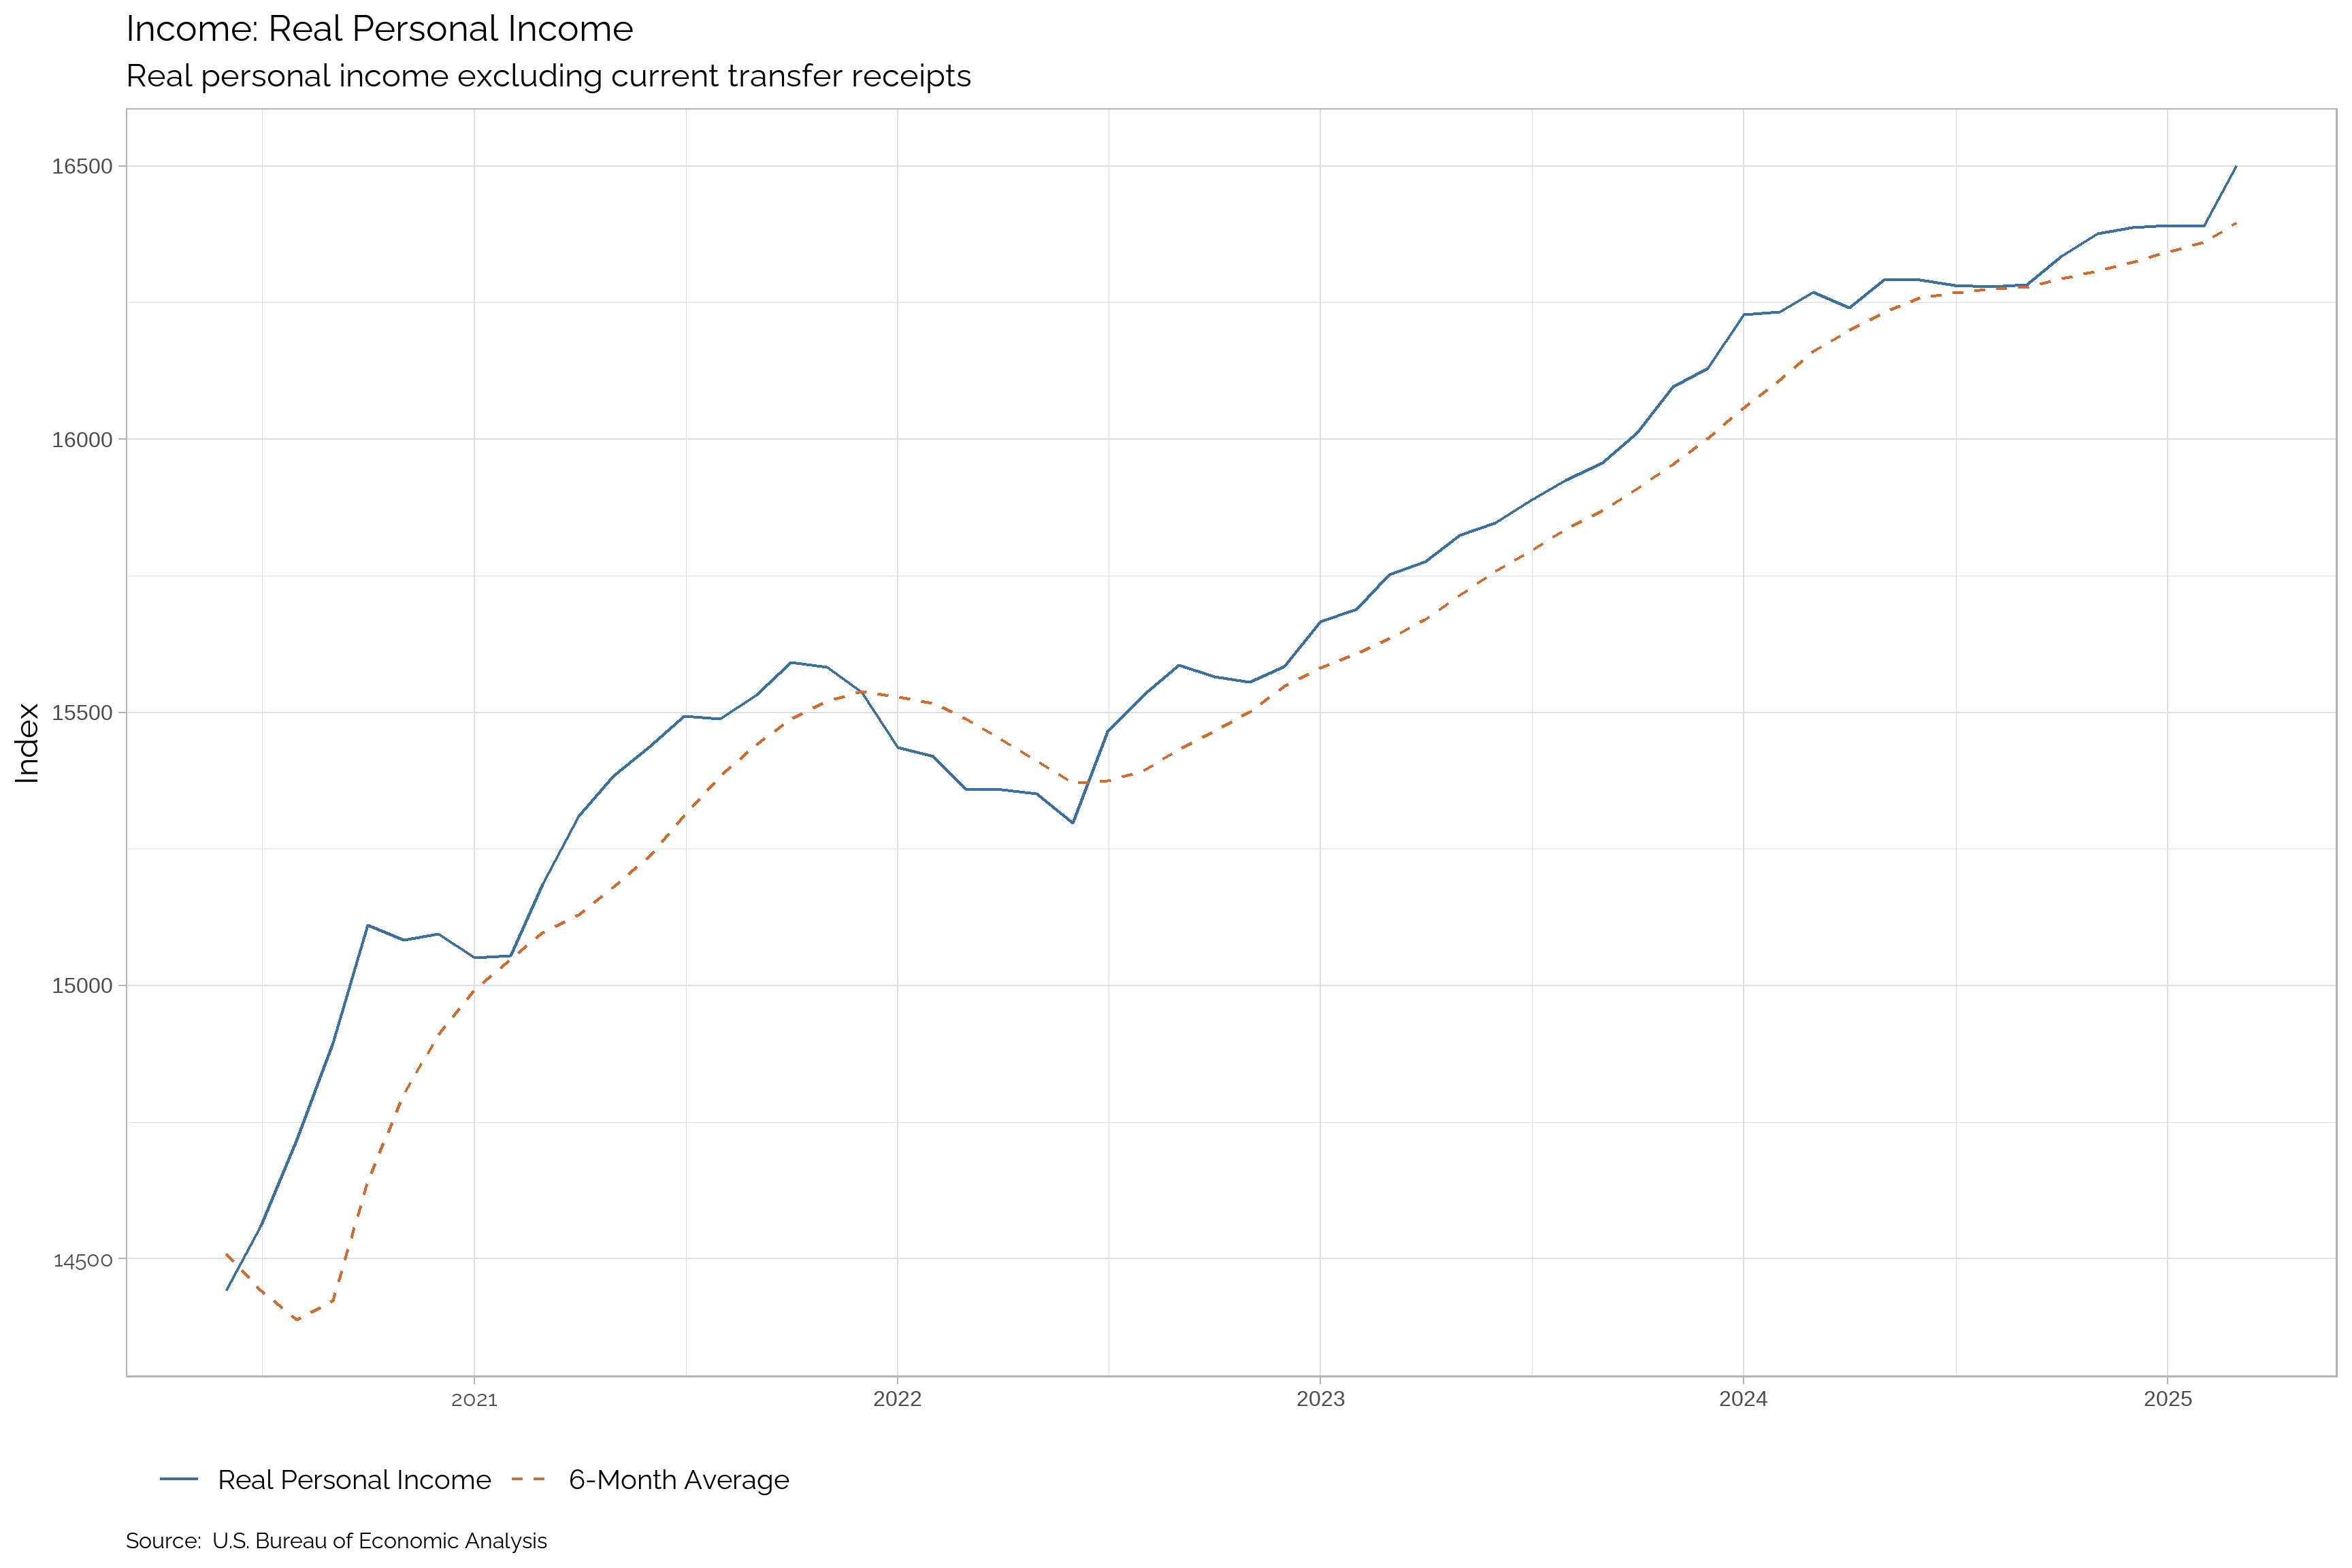
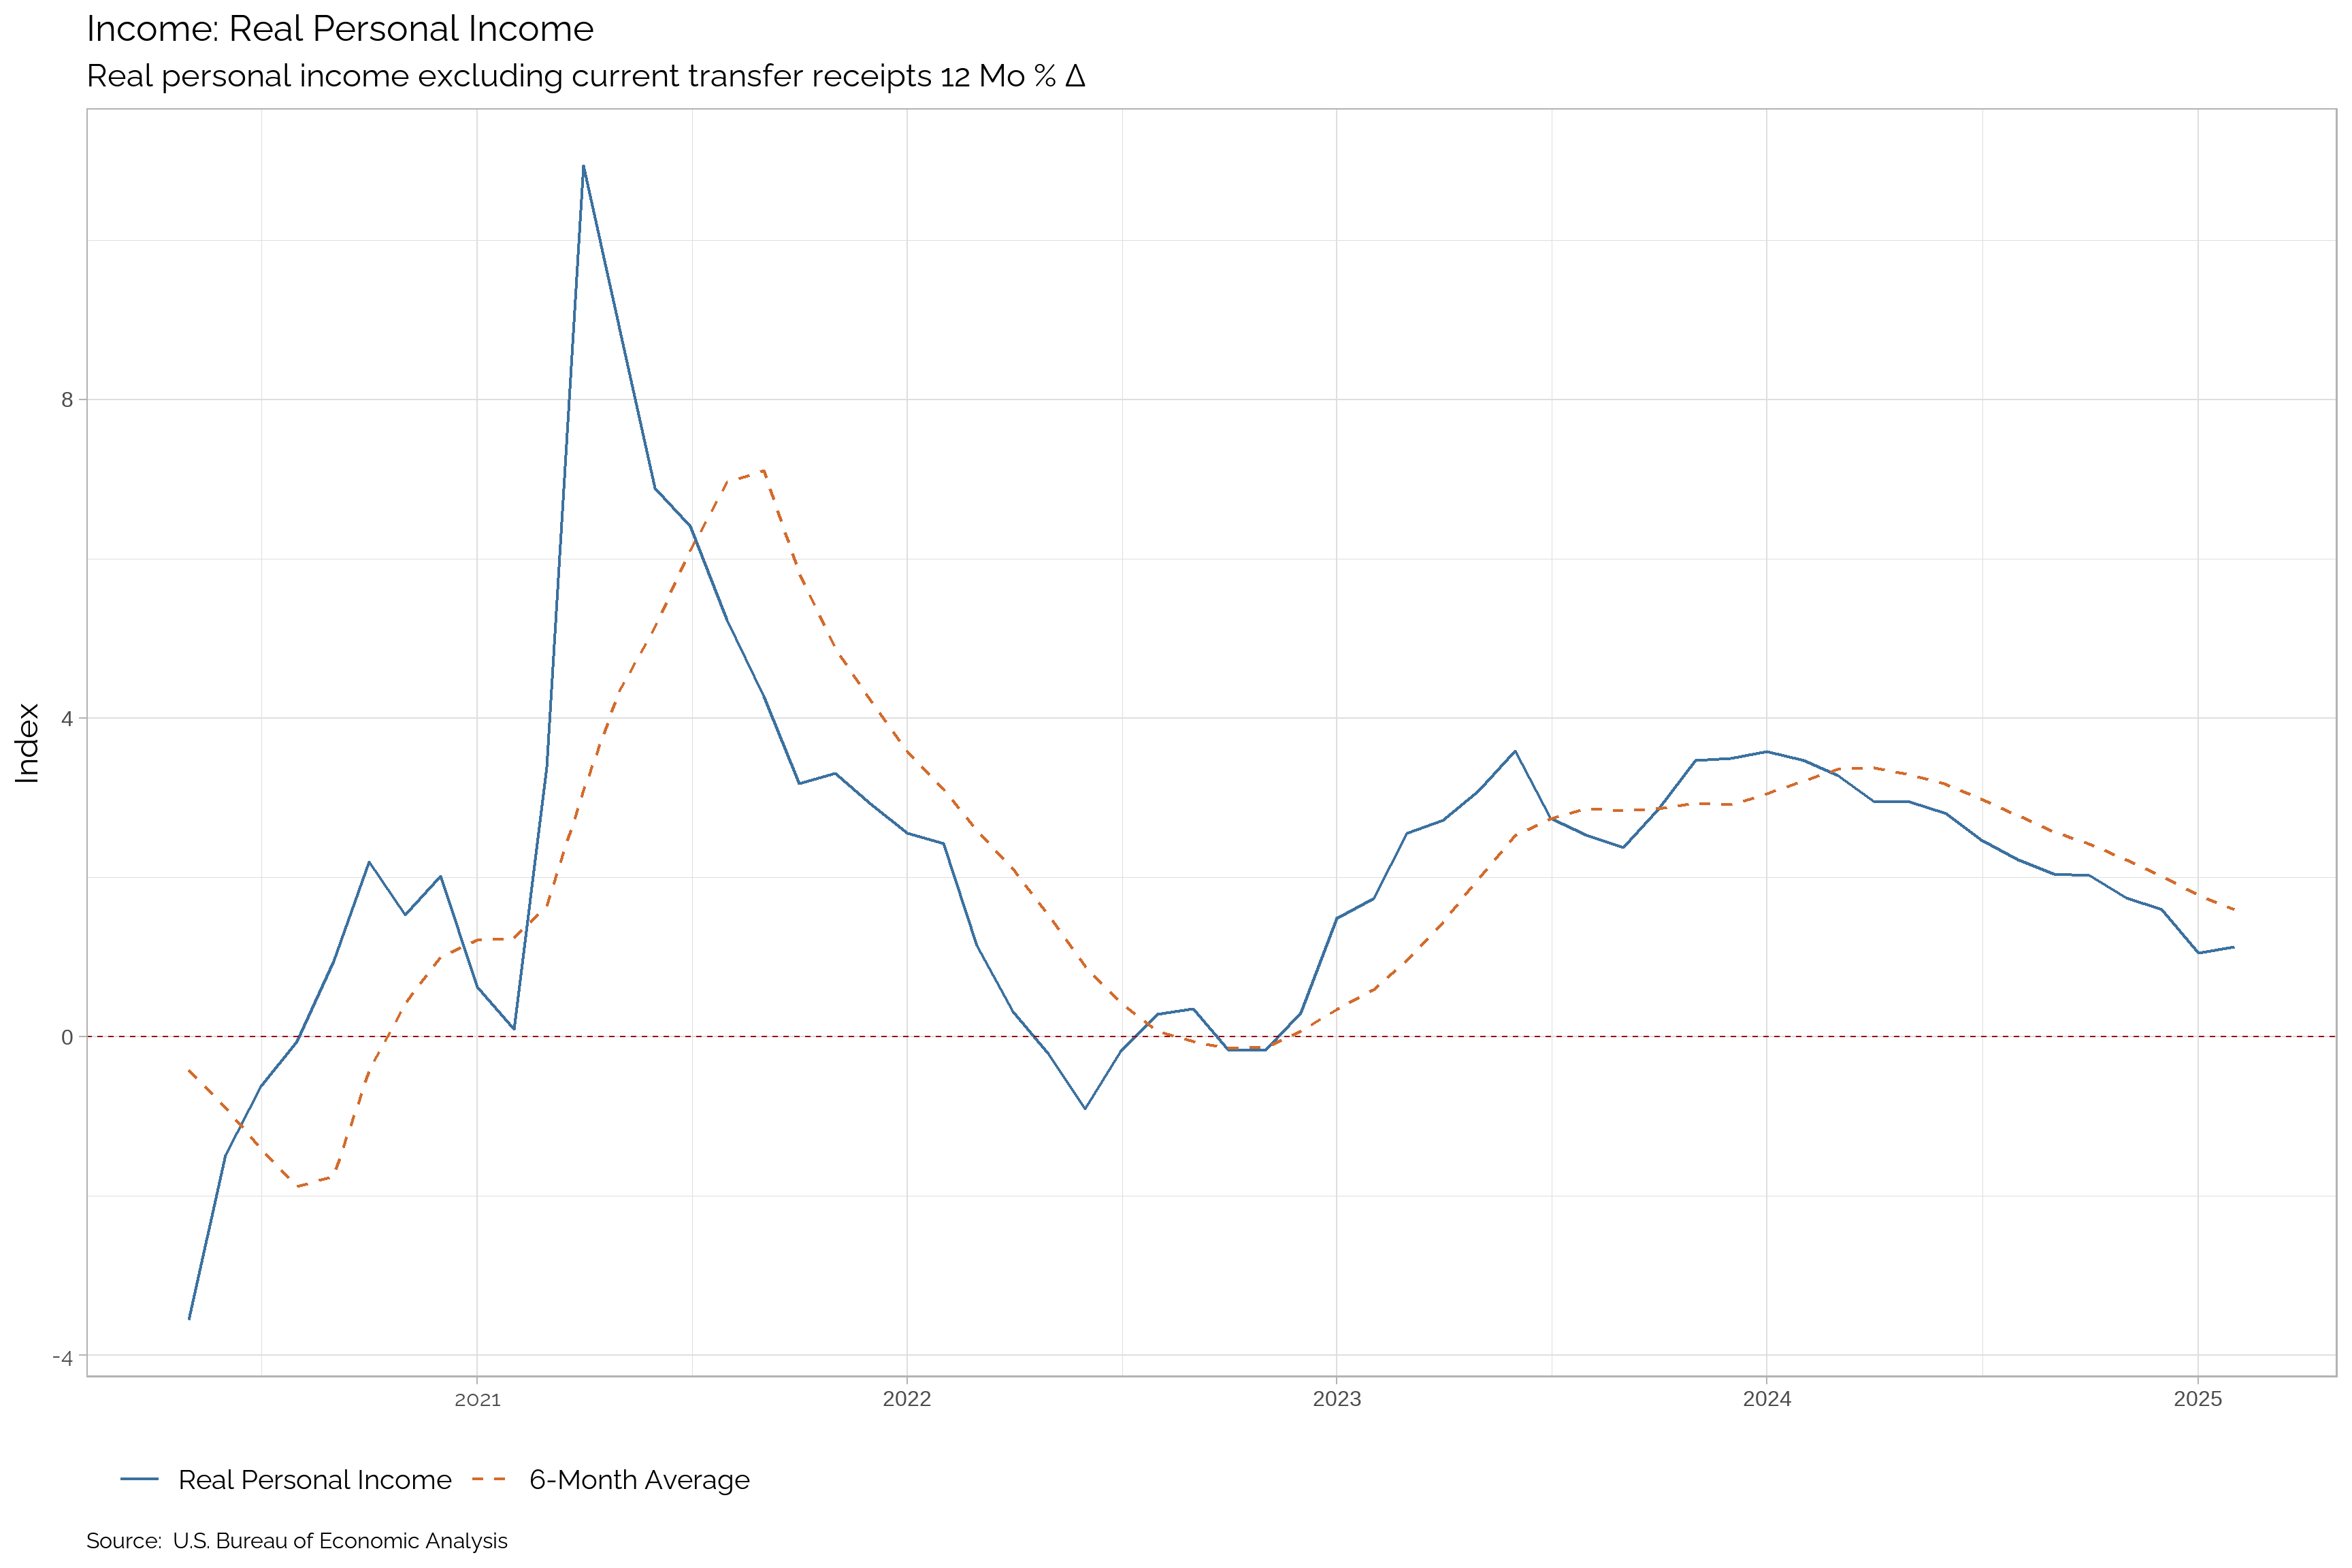
Real Personal Income
Real personal income is a key coincident indicator that provides insight into the purchasing power of consumers. By adjusting for inflation, real personal income reflects the true value of earnings, allowing us to gauge the financial health of individuals and households. A rising trend in real personal income indicates increased purchasing power, which can drive consumer spending and economic growth.
| Apr-25 | Mar-25 | Feb-25 | Jan-25 | Dec-24 | Nov-24 | Oct-24 | Sep-24 | Aug-24 | Jul-24 | Jun-24 | May-24 | |
|---|---|---|---|---|---|---|---|---|---|---|---|---|
| Real Personal Income | -- | -- | 16416.1 | 16398.1 | 16387.7 | 16376.8 | 16335.8 | 16283.1 | 16279.2 | 16281.1 | 16292.1 | 16291.7 |
| Δ Change | -- | -- | 18 | 10.4 | 10.9 | 41 | 52.7 | 3.9 | -1.9 | -11 | 0.4 | 51.3 |
| Percent Δ Change | -- | -- | 0.11 | 0.06 | 0.07 | 0.25 | 0.32 | 0.02 | -0.01 | -0.07 | 0 | 0.32 |
| Growth Rate | -- | -- | 1.13 | 1.05 | 1.6 | 1.75 | 2.03 | 2.04 | 2.22 | 2.47 | 2.81 | 2.95 |
| Trend | -- | -- | Up | Up | Up | Up | Up | Up | Up | Up | Up | Up |
| Trend in Growth Rate | -- | -- | Down | Down | Down | Down | Down | Down | Down | Down | Down | Down |
Consumption
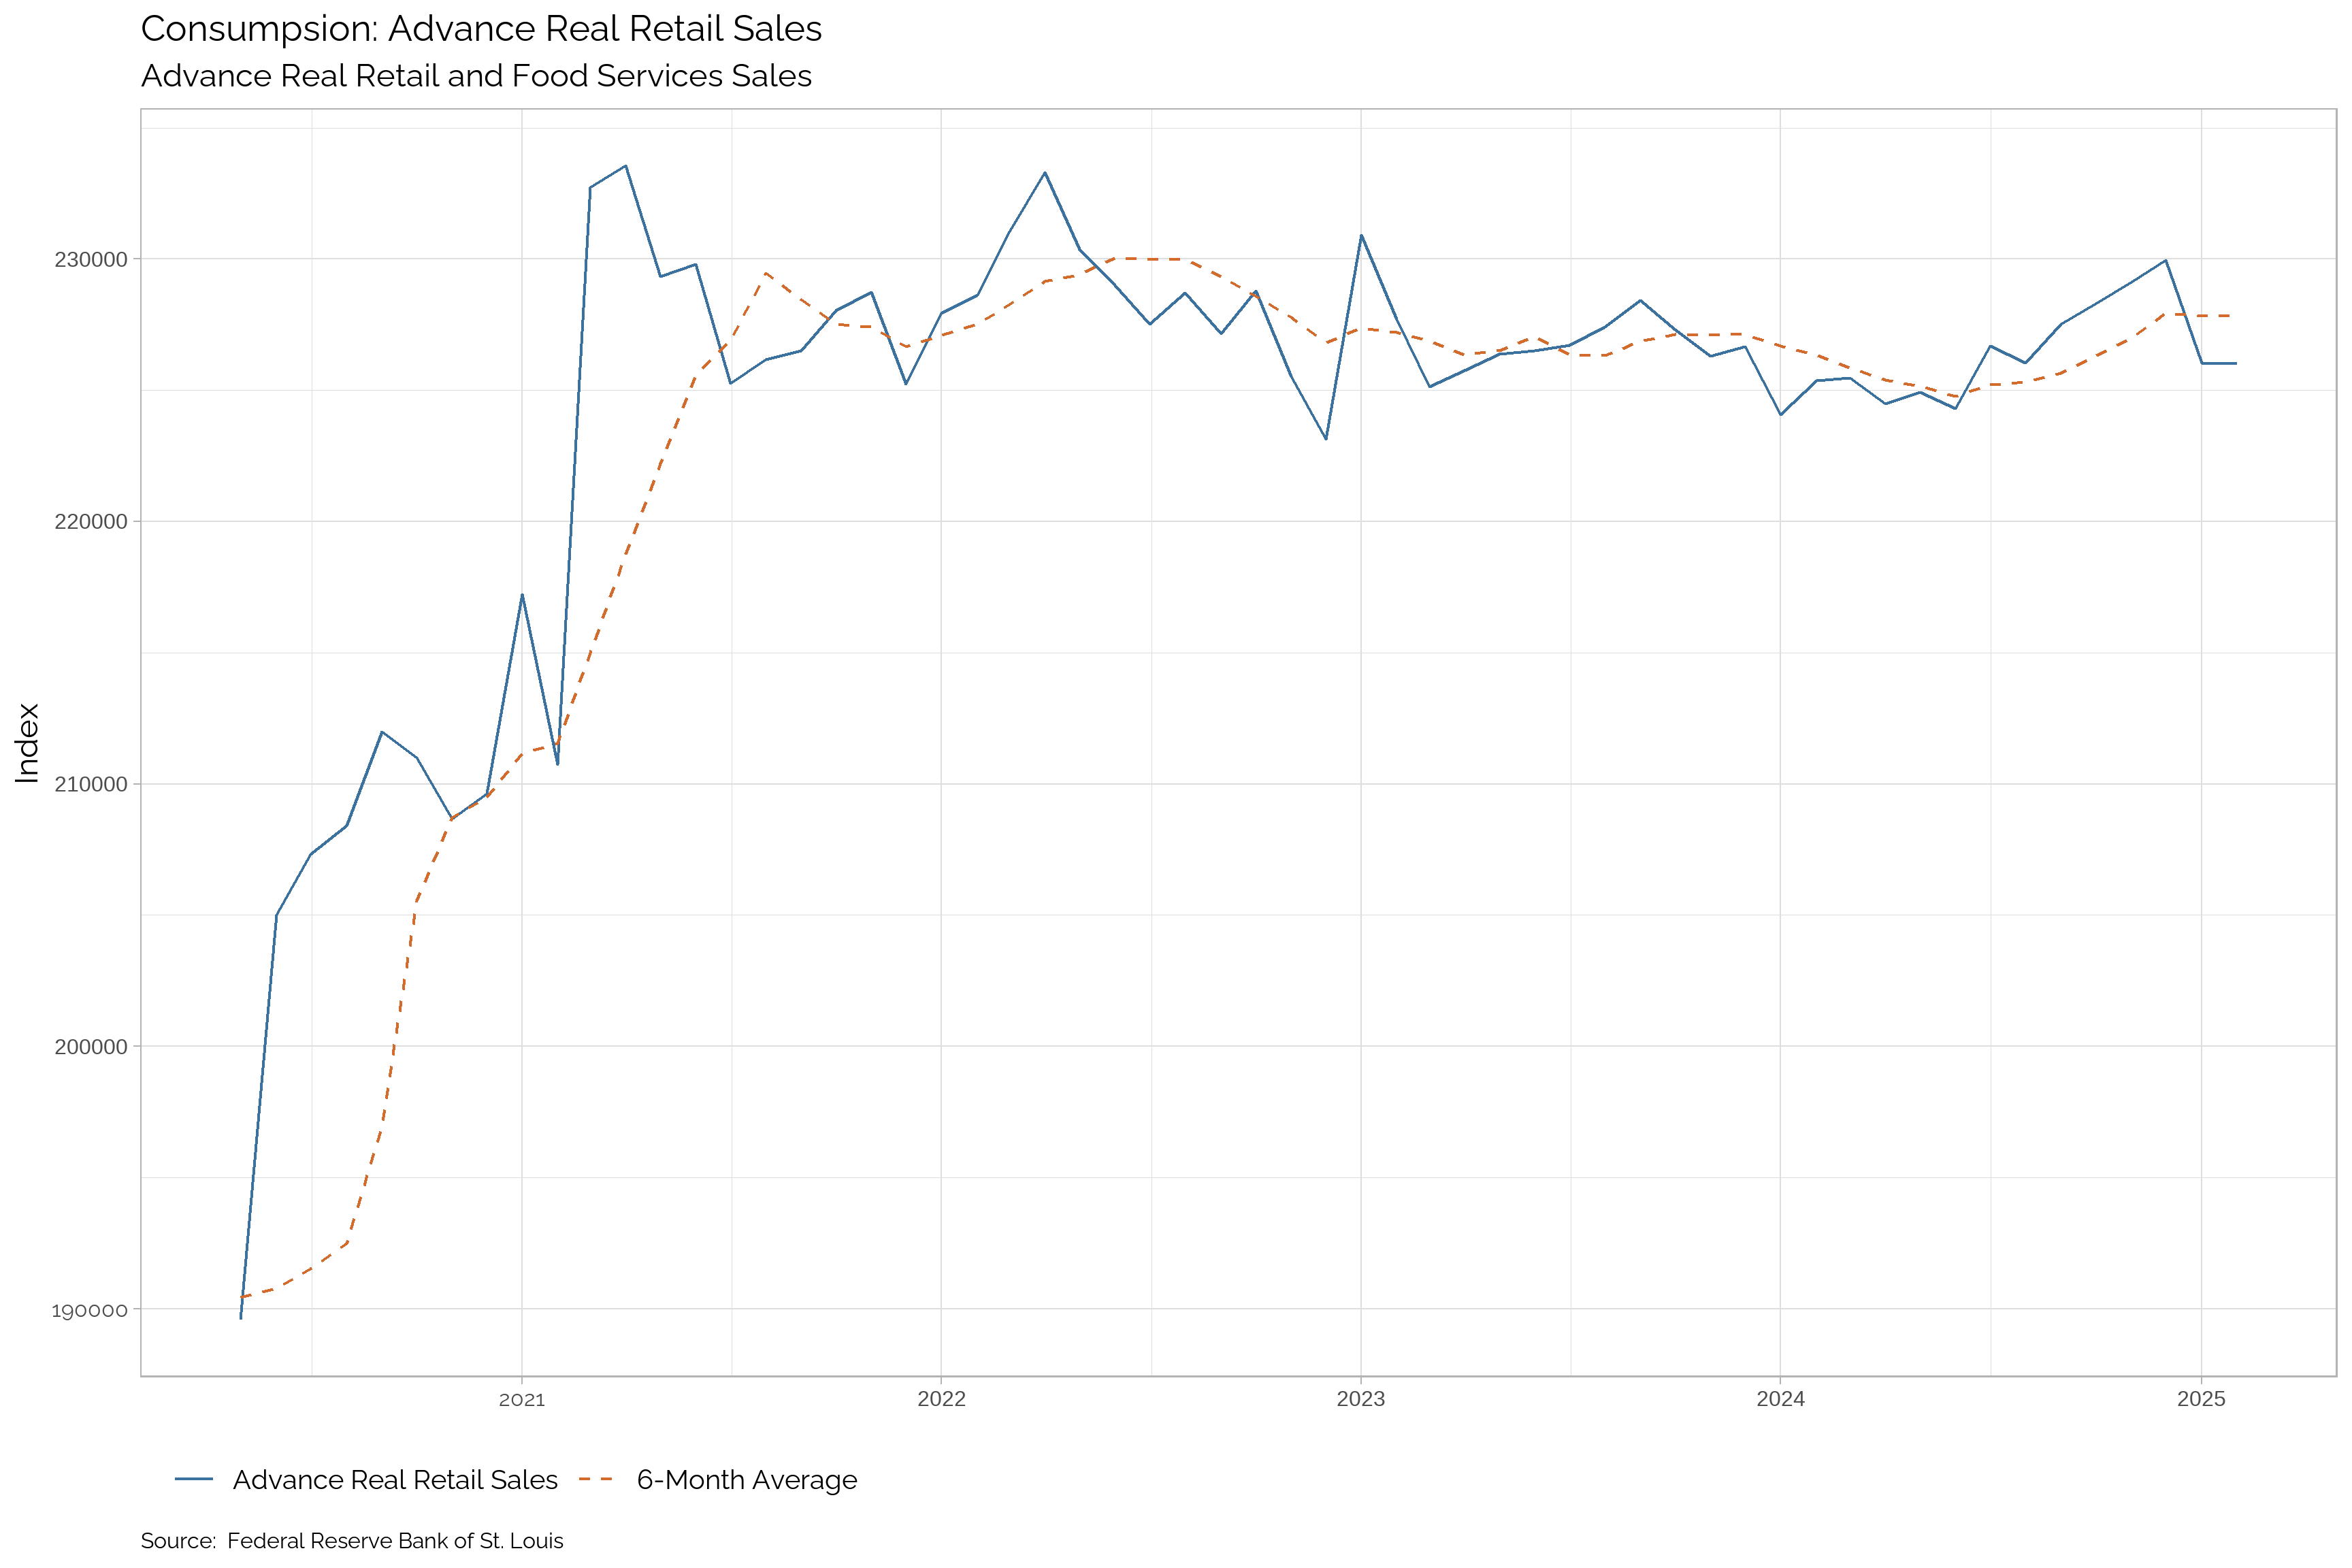
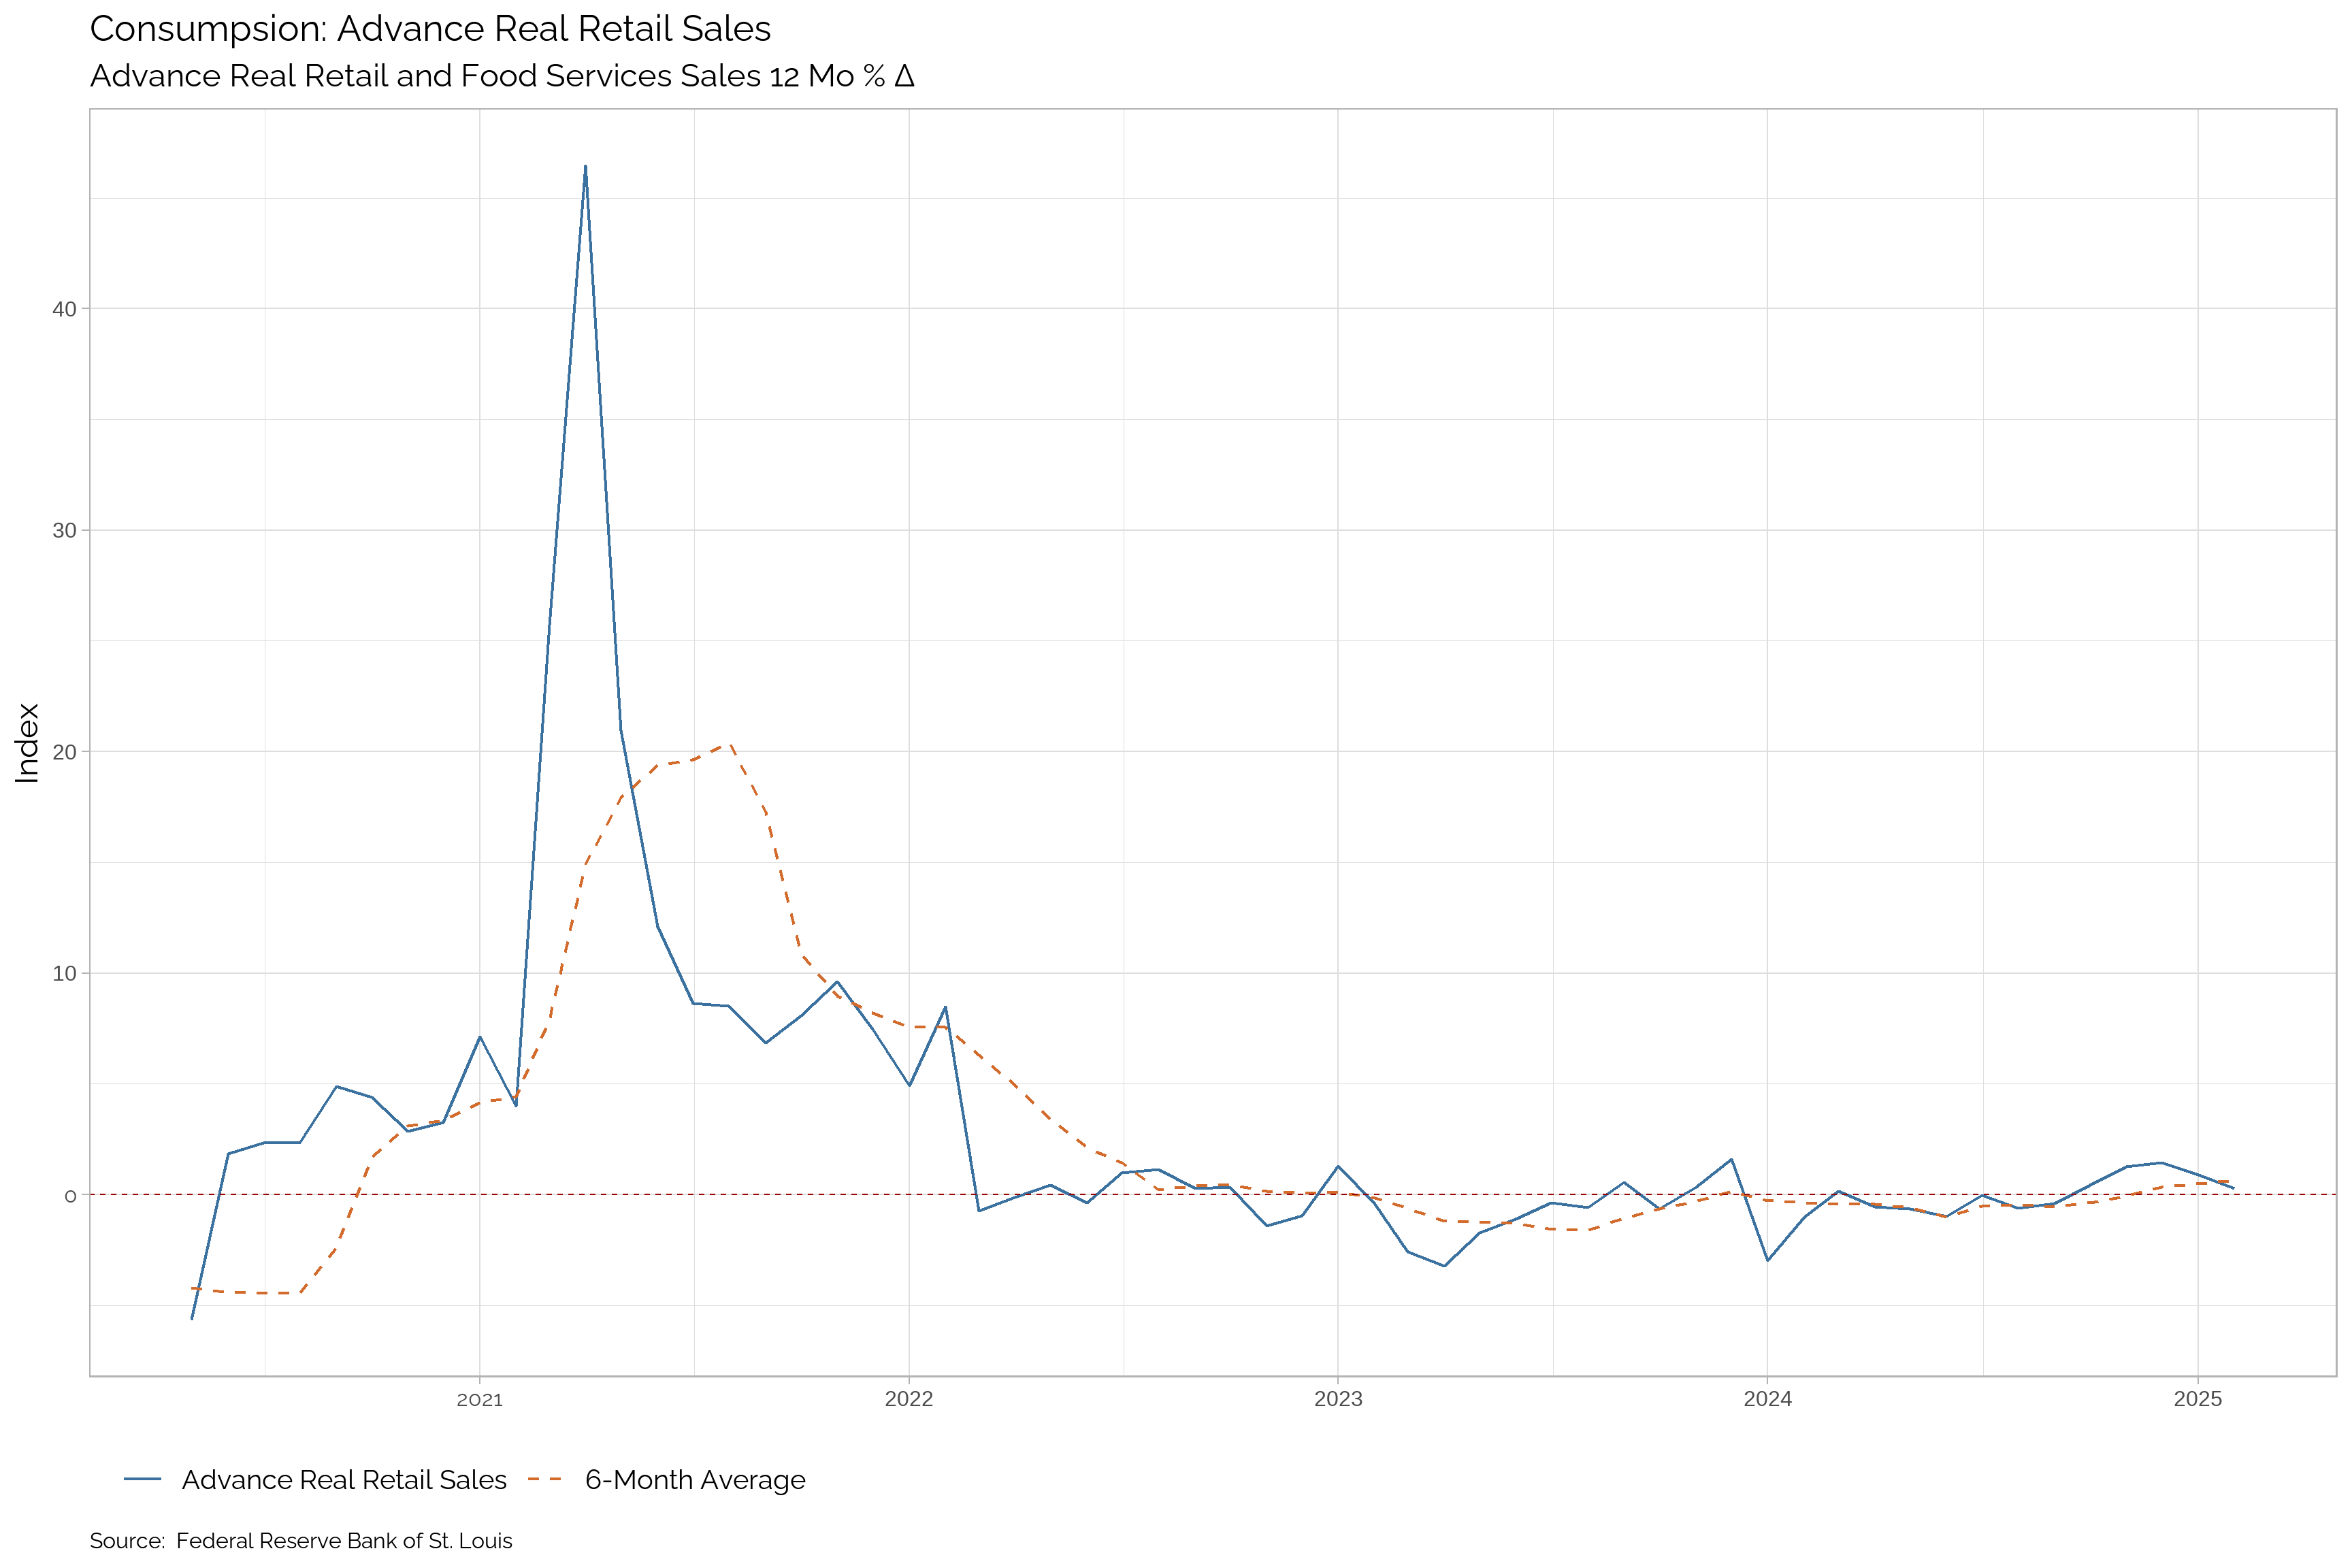
Advanced Real Retail Sales
Retail sales are a key indicator of consumer spending, reflecting the total sales of goods and services by retail stores. This metric provides insights into consumer behavior, offering a glimpse into the health of the economy. A rising trend in retail sales indicates increased consumer spending, which drives economic growth. Real retail sales adjust for inflation, providing a more accurate picture of consumer spending trends.
| Apr-25 | Mar-25 | Feb-25 | Jan-25 | Dec-24 | Nov-24 | Oct-24 | Sep-24 | Aug-24 | Jul-24 | Jun-24 | May-24 | |
|---|---|---|---|---|---|---|---|---|---|---|---|---|
| Advance Real Retail Sales | -- | -- | 226005 | 226052 | 229952 | 229130 | 228287 | 227532 | 226032 | 226699 | 224299 | 224918 |
| Δ Change | -- | -- | -47 | -3900 | 822 | 843 | 755 | 1500 | -667 | 2400 | -619 | 431 |
| Percent Δ Change | -- | -- | -0.02 | -1.7 | 0.36 | 0.37 | 0.33 | 0.66 | -0.29 | 1.07 | -0.28 | 0.19 |
| Growth Rate | -- | -- | 0.28 | 0.89 | 1.45 | 1.26 | 0.42 | -0.39 | -0.61 | -0.01 | -0.98 | -0.65 |
| Trend | -- | -- | Down | Down | Up | Up | Up | Up | Up | Up | Down | Down |
| Trend in Growth Rate | -- | -- | Down | Up | Up | Up | Up | Up | Down | Up | Up | Down |
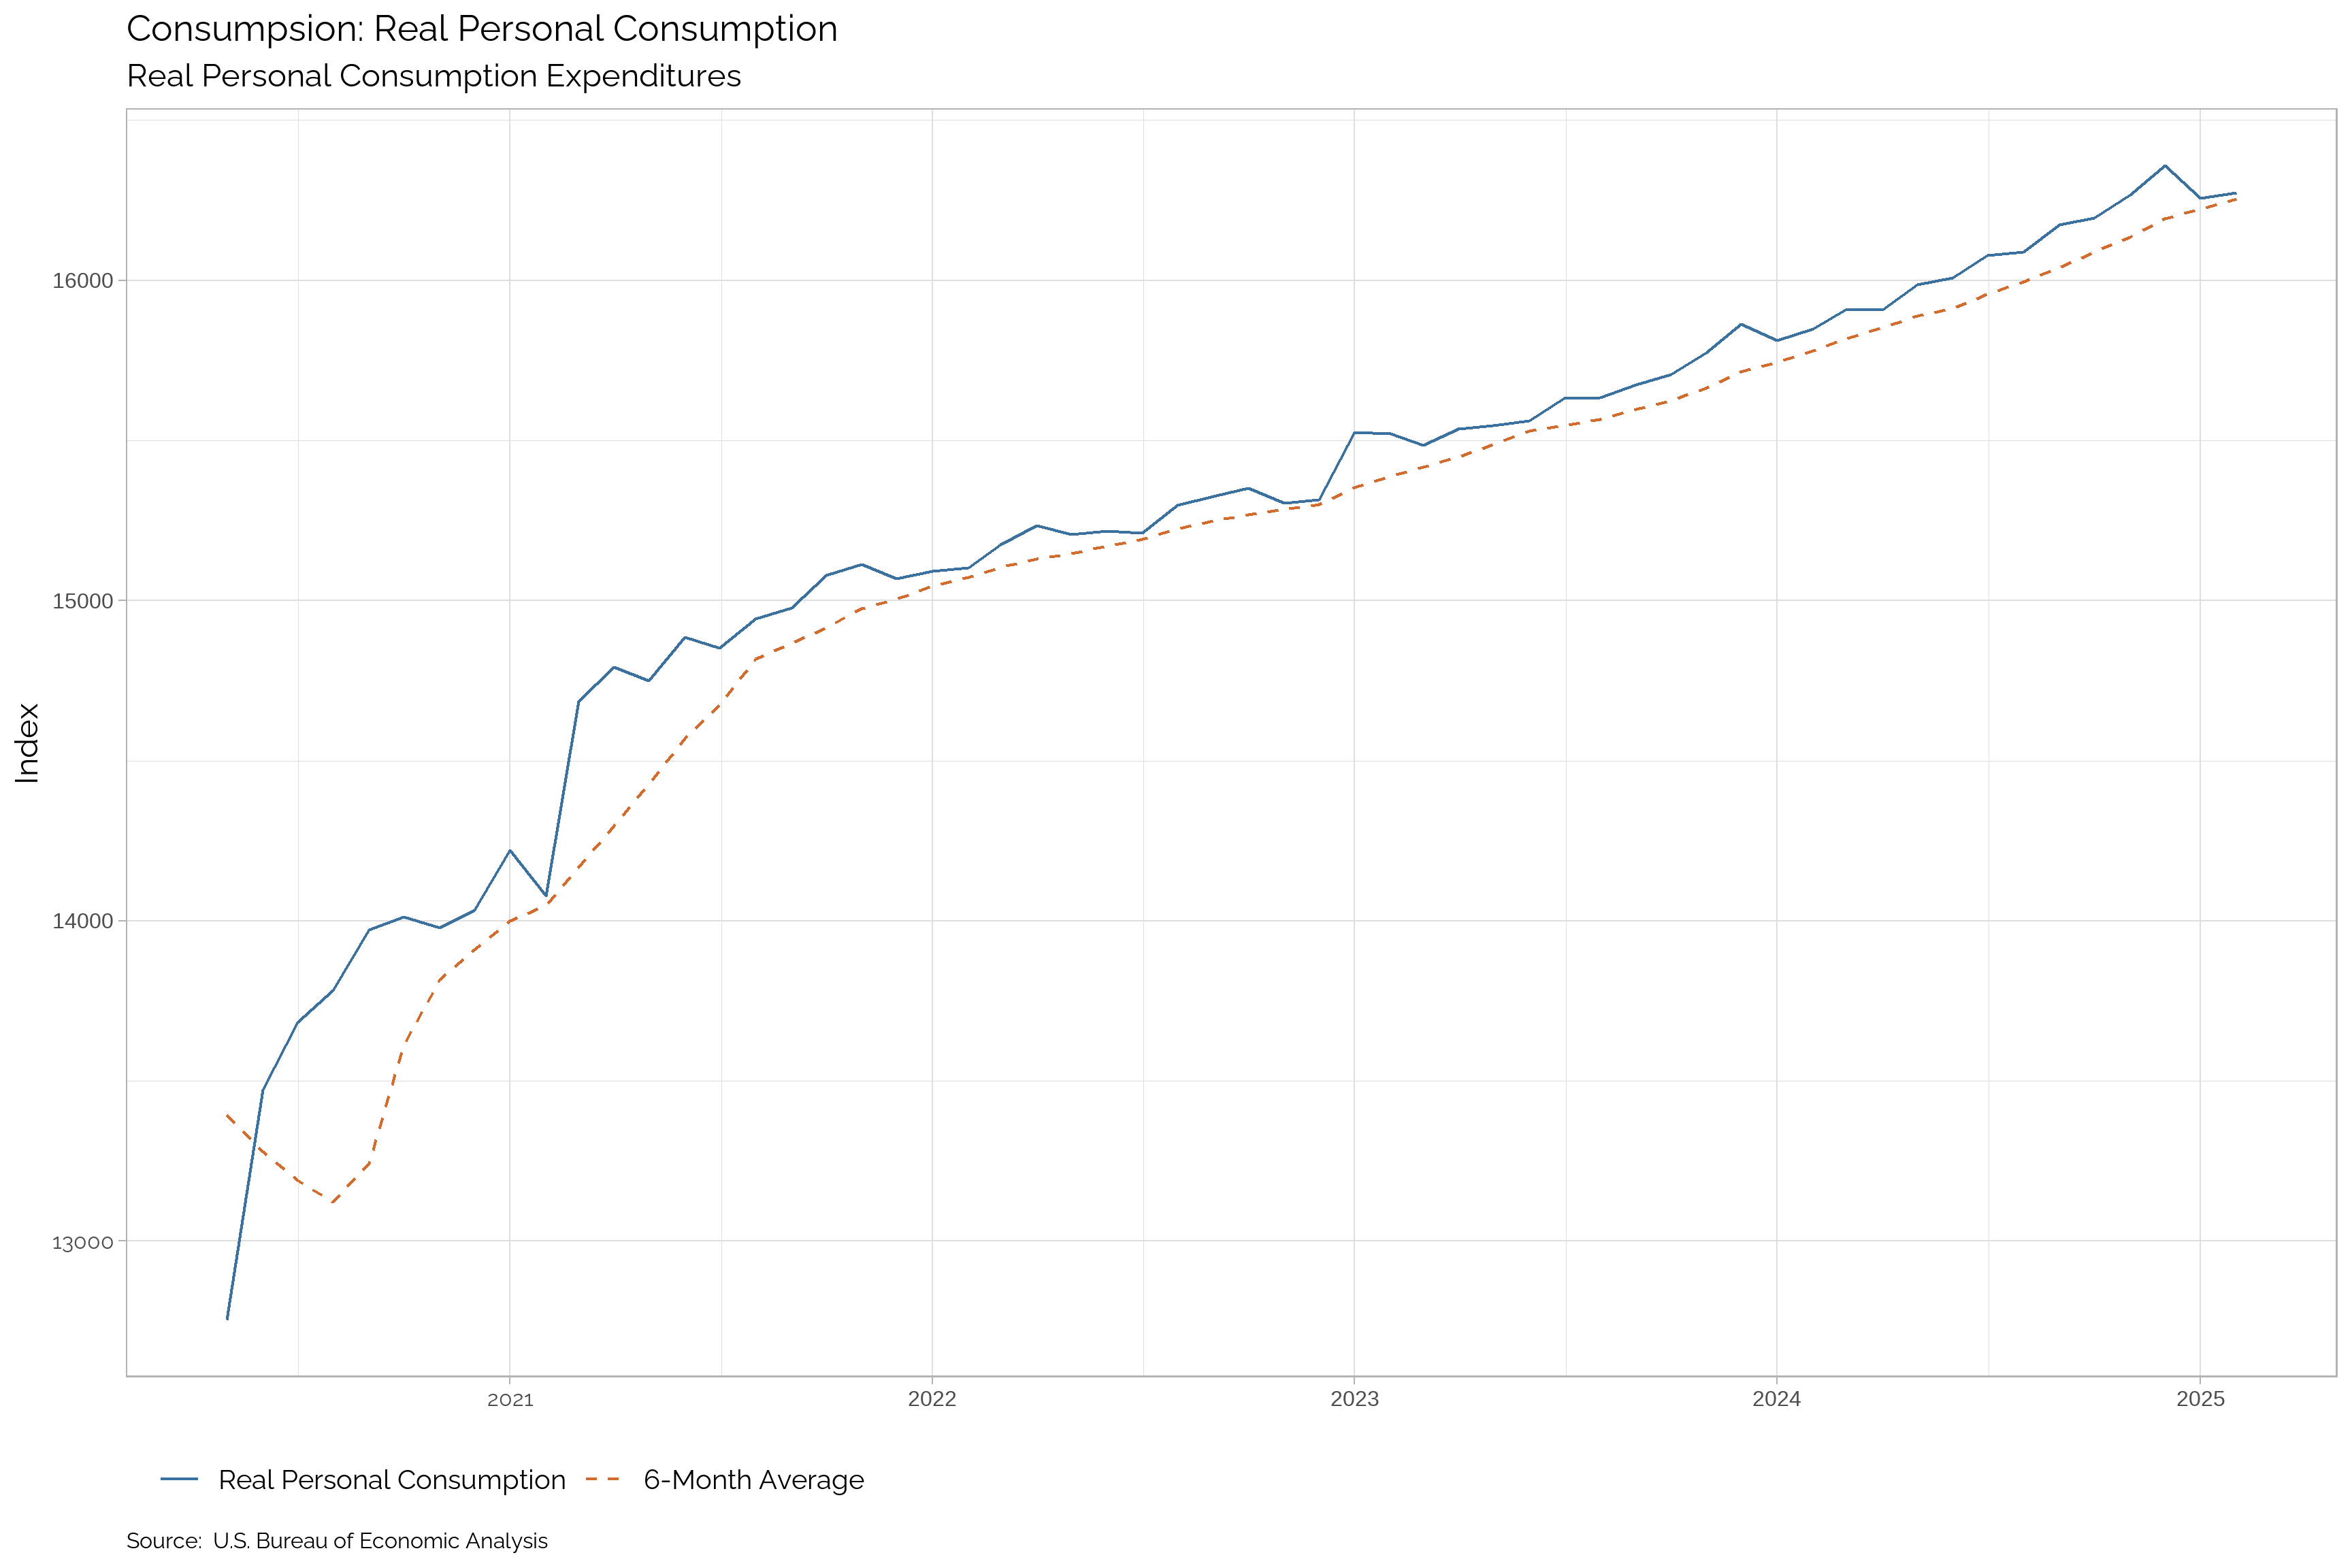
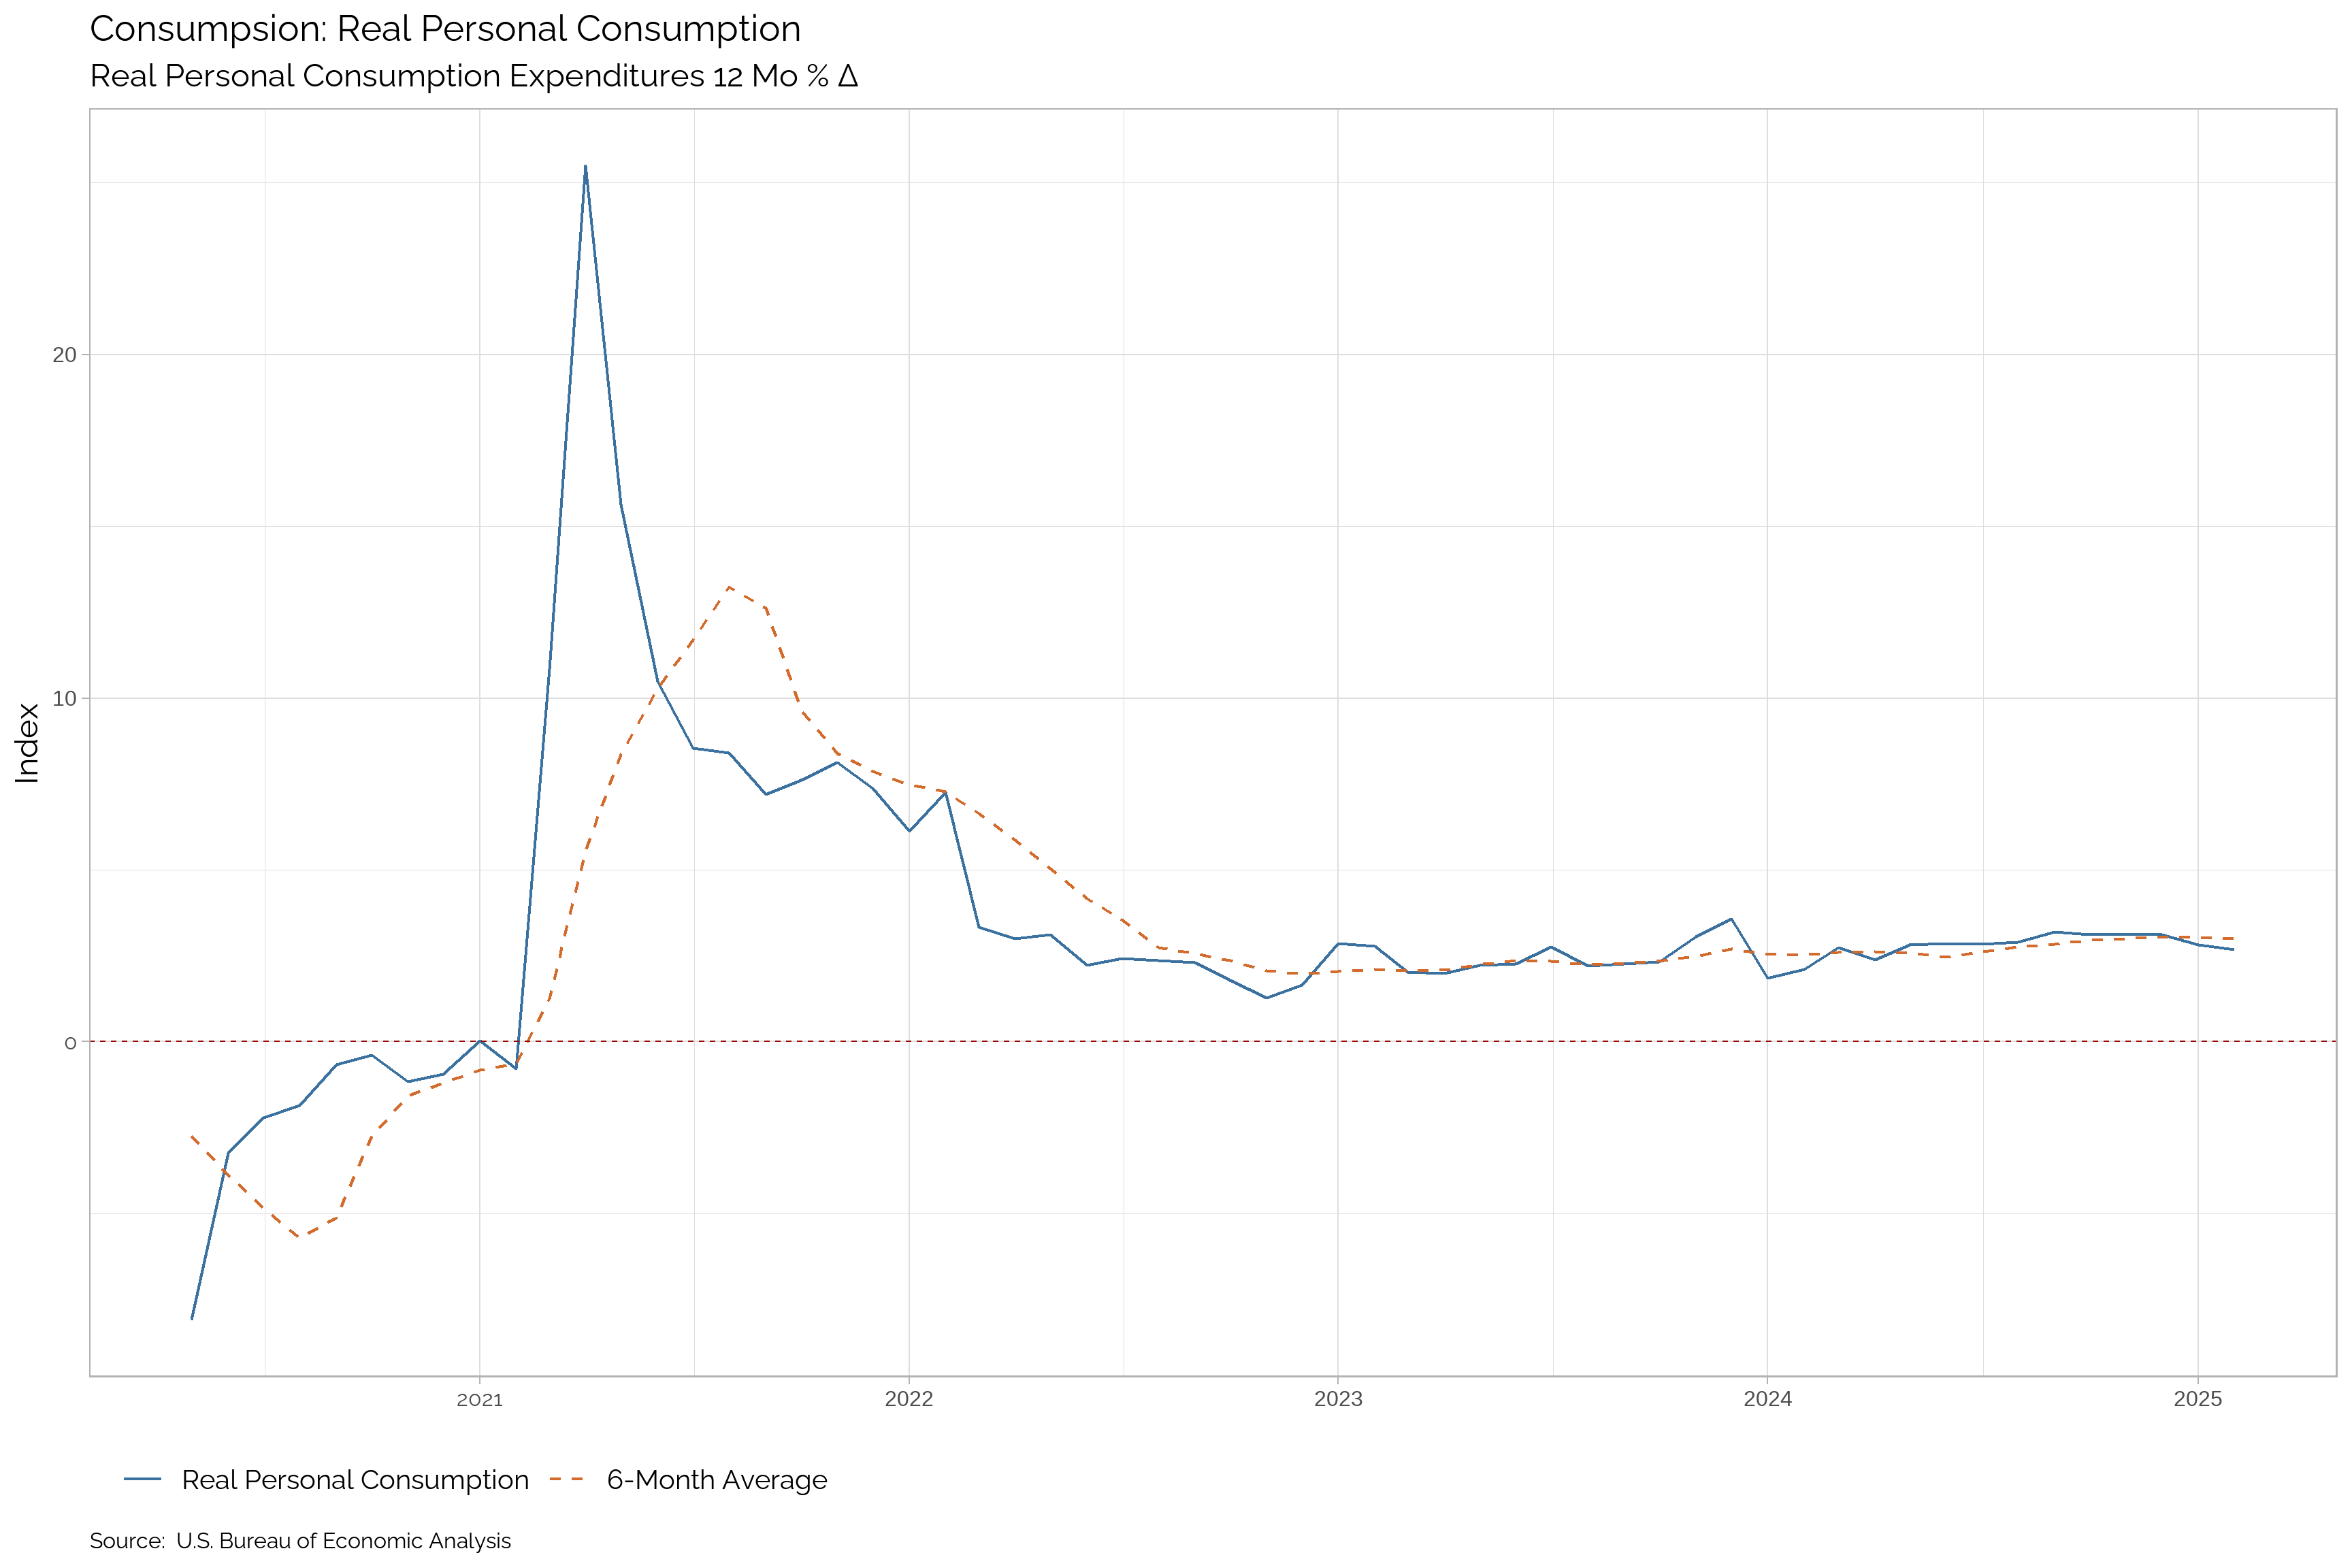
Real Personal Consumption Expenditures
Real personal consumption expenditures (PCE) is a key metric that measures consumer spending on goods and services. This indicator is a critical component of GDP, reflecting the total value of goods and services purchased by consumers. Real PCE adjusts for inflation, providing a more accurate picture of consumer spending trends. A rising trend in real PCE indicates increased consumer spending, which drives economic growth.
| Apr-25 | Mar-25 | Feb-25 | Jan-25 | Dec-24 | Nov-24 | Oct-24 | Sep-24 | Aug-24 | Jul-24 | Jun-24 | May-24 | |
|---|---|---|---|---|---|---|---|---|---|---|---|---|
| Real Personal Consumption | -- | -- | 16274.2 | 16257.6 | 16357.7 | 16267.2 | 16194.7 | 16173.4 | 16088.6 | 16077.1 | 16007.7 | 15985.9 |
| Δ Change | -- | -- | 16.6 | -100.1 | 90.5 | 72.5 | 21.3 | 84.8 | 11.5 | 69.4 | 21.8 | 77.6 |
| Percent Δ Change | -- | -- | 0.1 | -0.61 | 0.56 | 0.45 | 0.13 | 0.53 | 0.07 | 0.43 | 0.14 | 0.49 |
| Growth Rate | -- | -- | 2.68 | 2.81 | 3.11 | 3.13 | 3.11 | 3.19 | 2.9 | 2.85 | 2.86 | 2.83 |
| Trend | -- | -- | Up | Up | Up | Up | Up | Up | Up | Up | Up | Up |
| Trend in Growth Rate | -- | -- | Down | Down | Up | Up | Up | Up | Up | Up | Up | Up |
Production
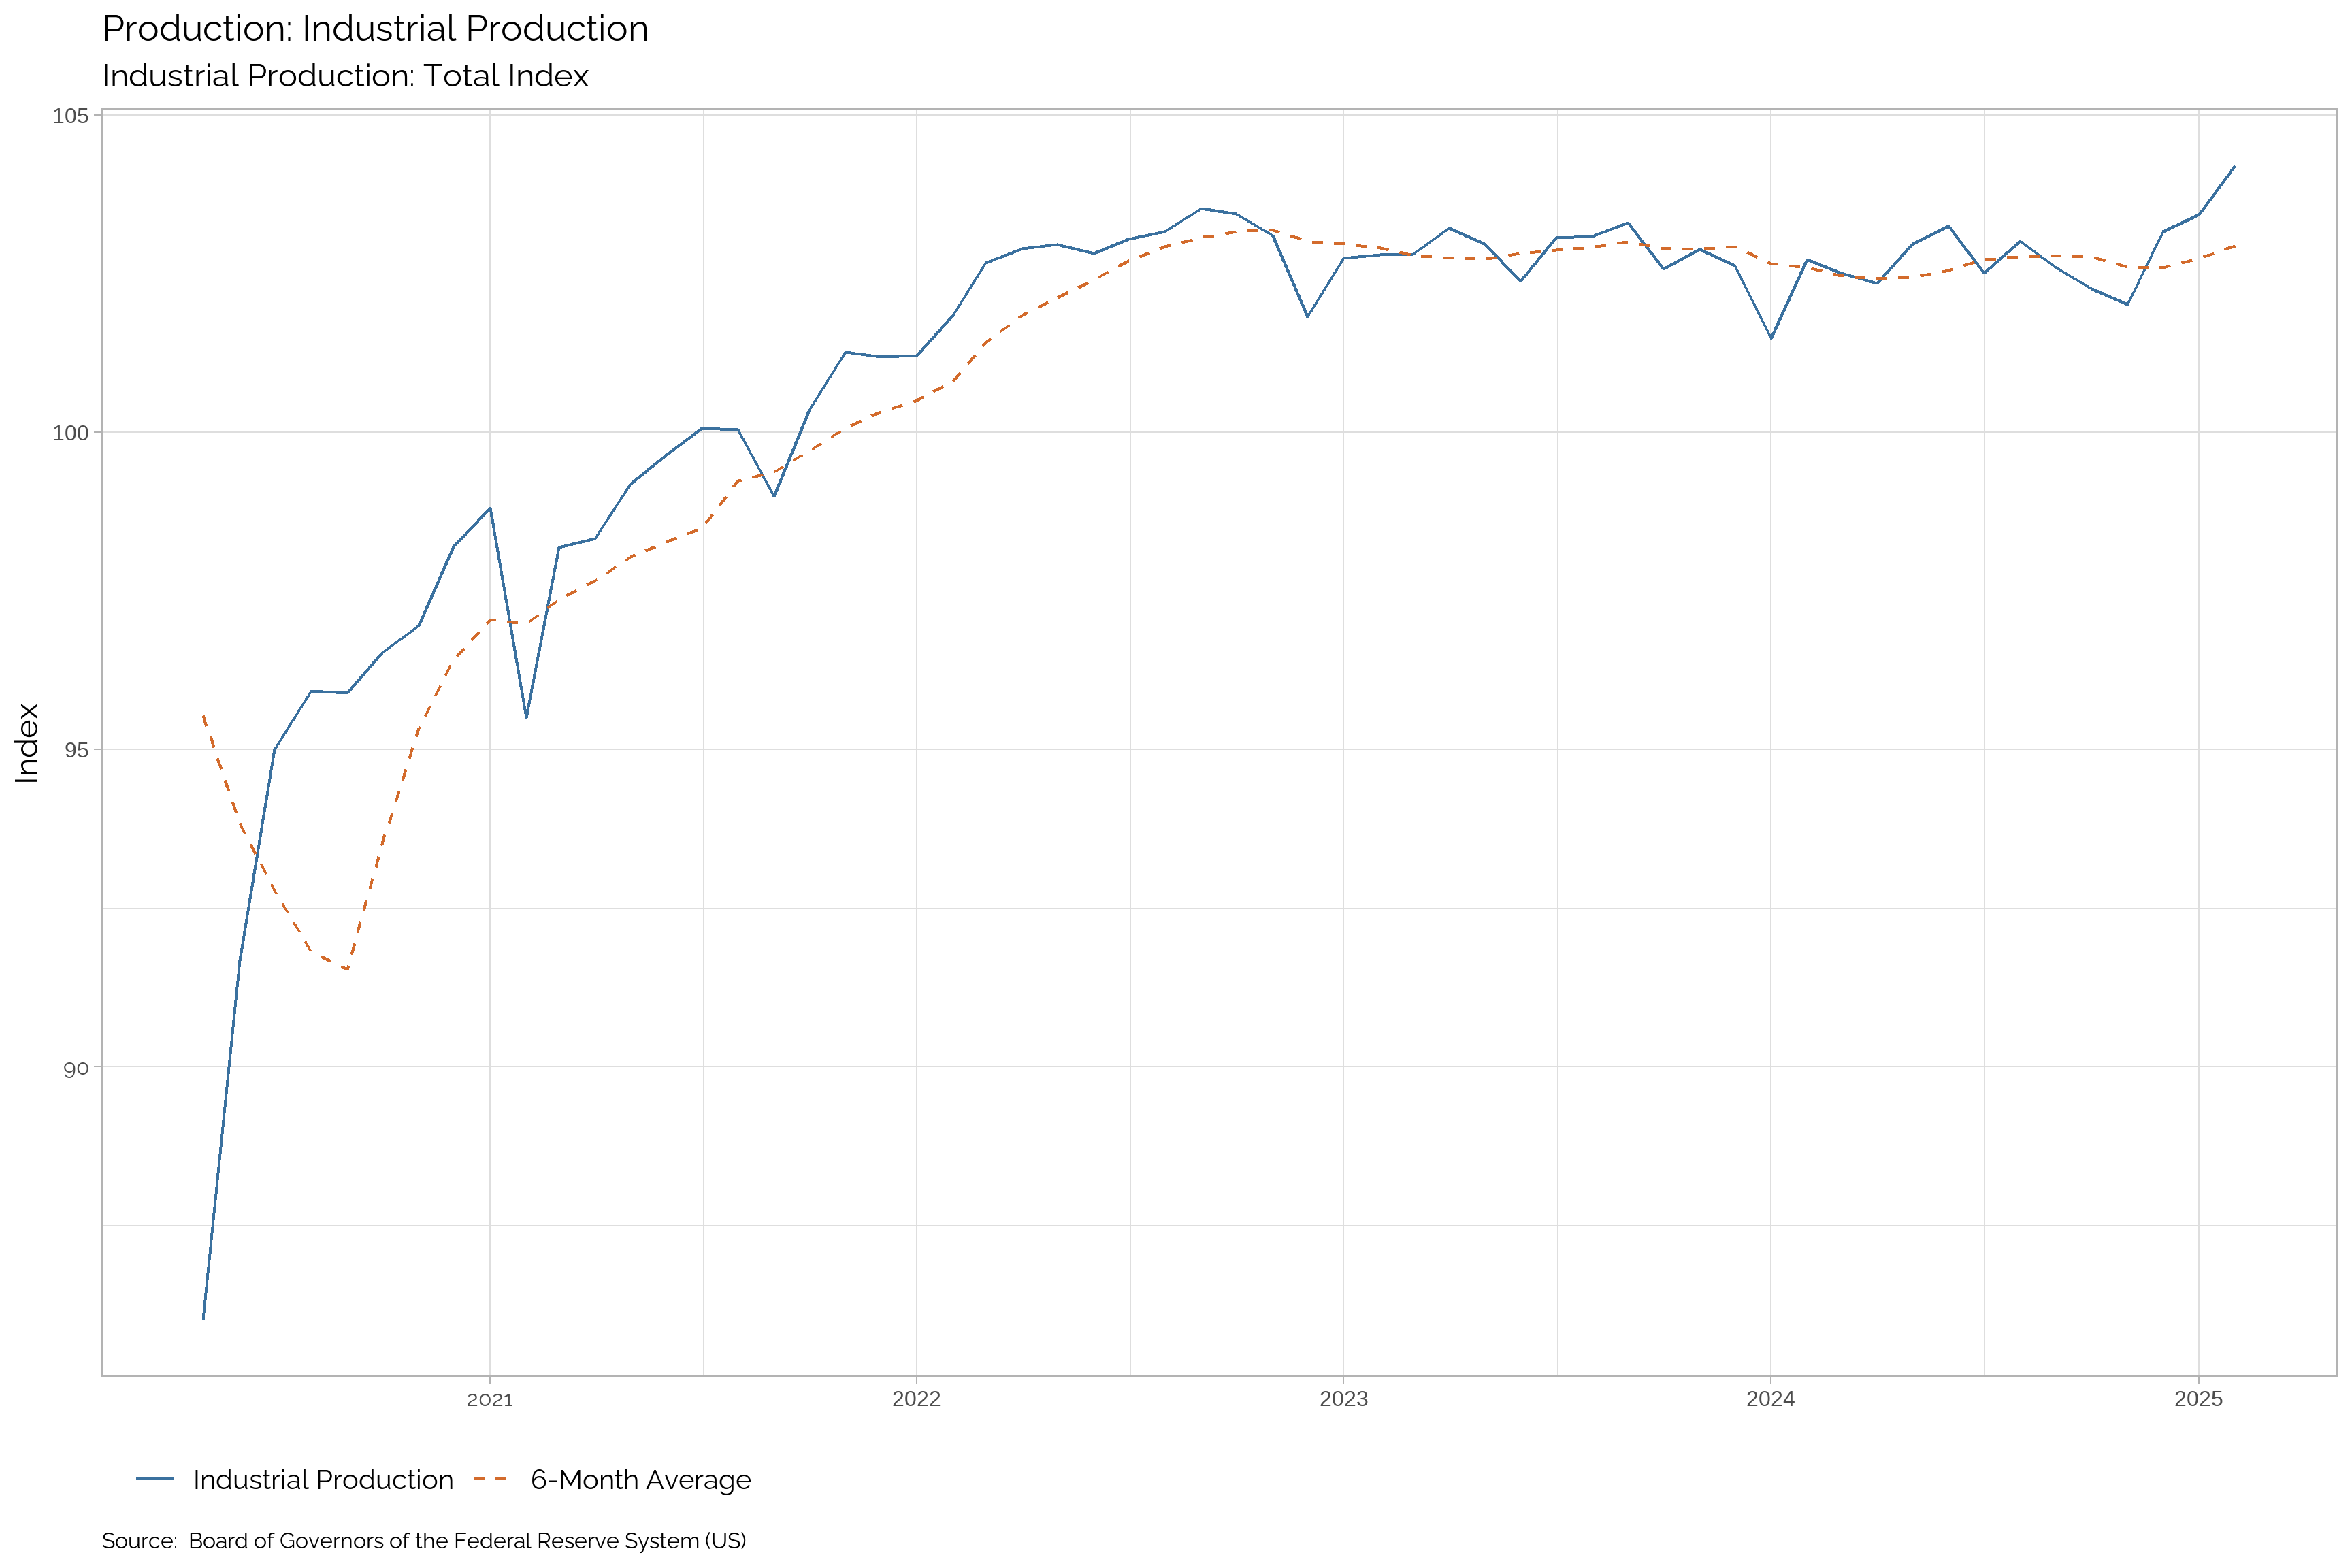
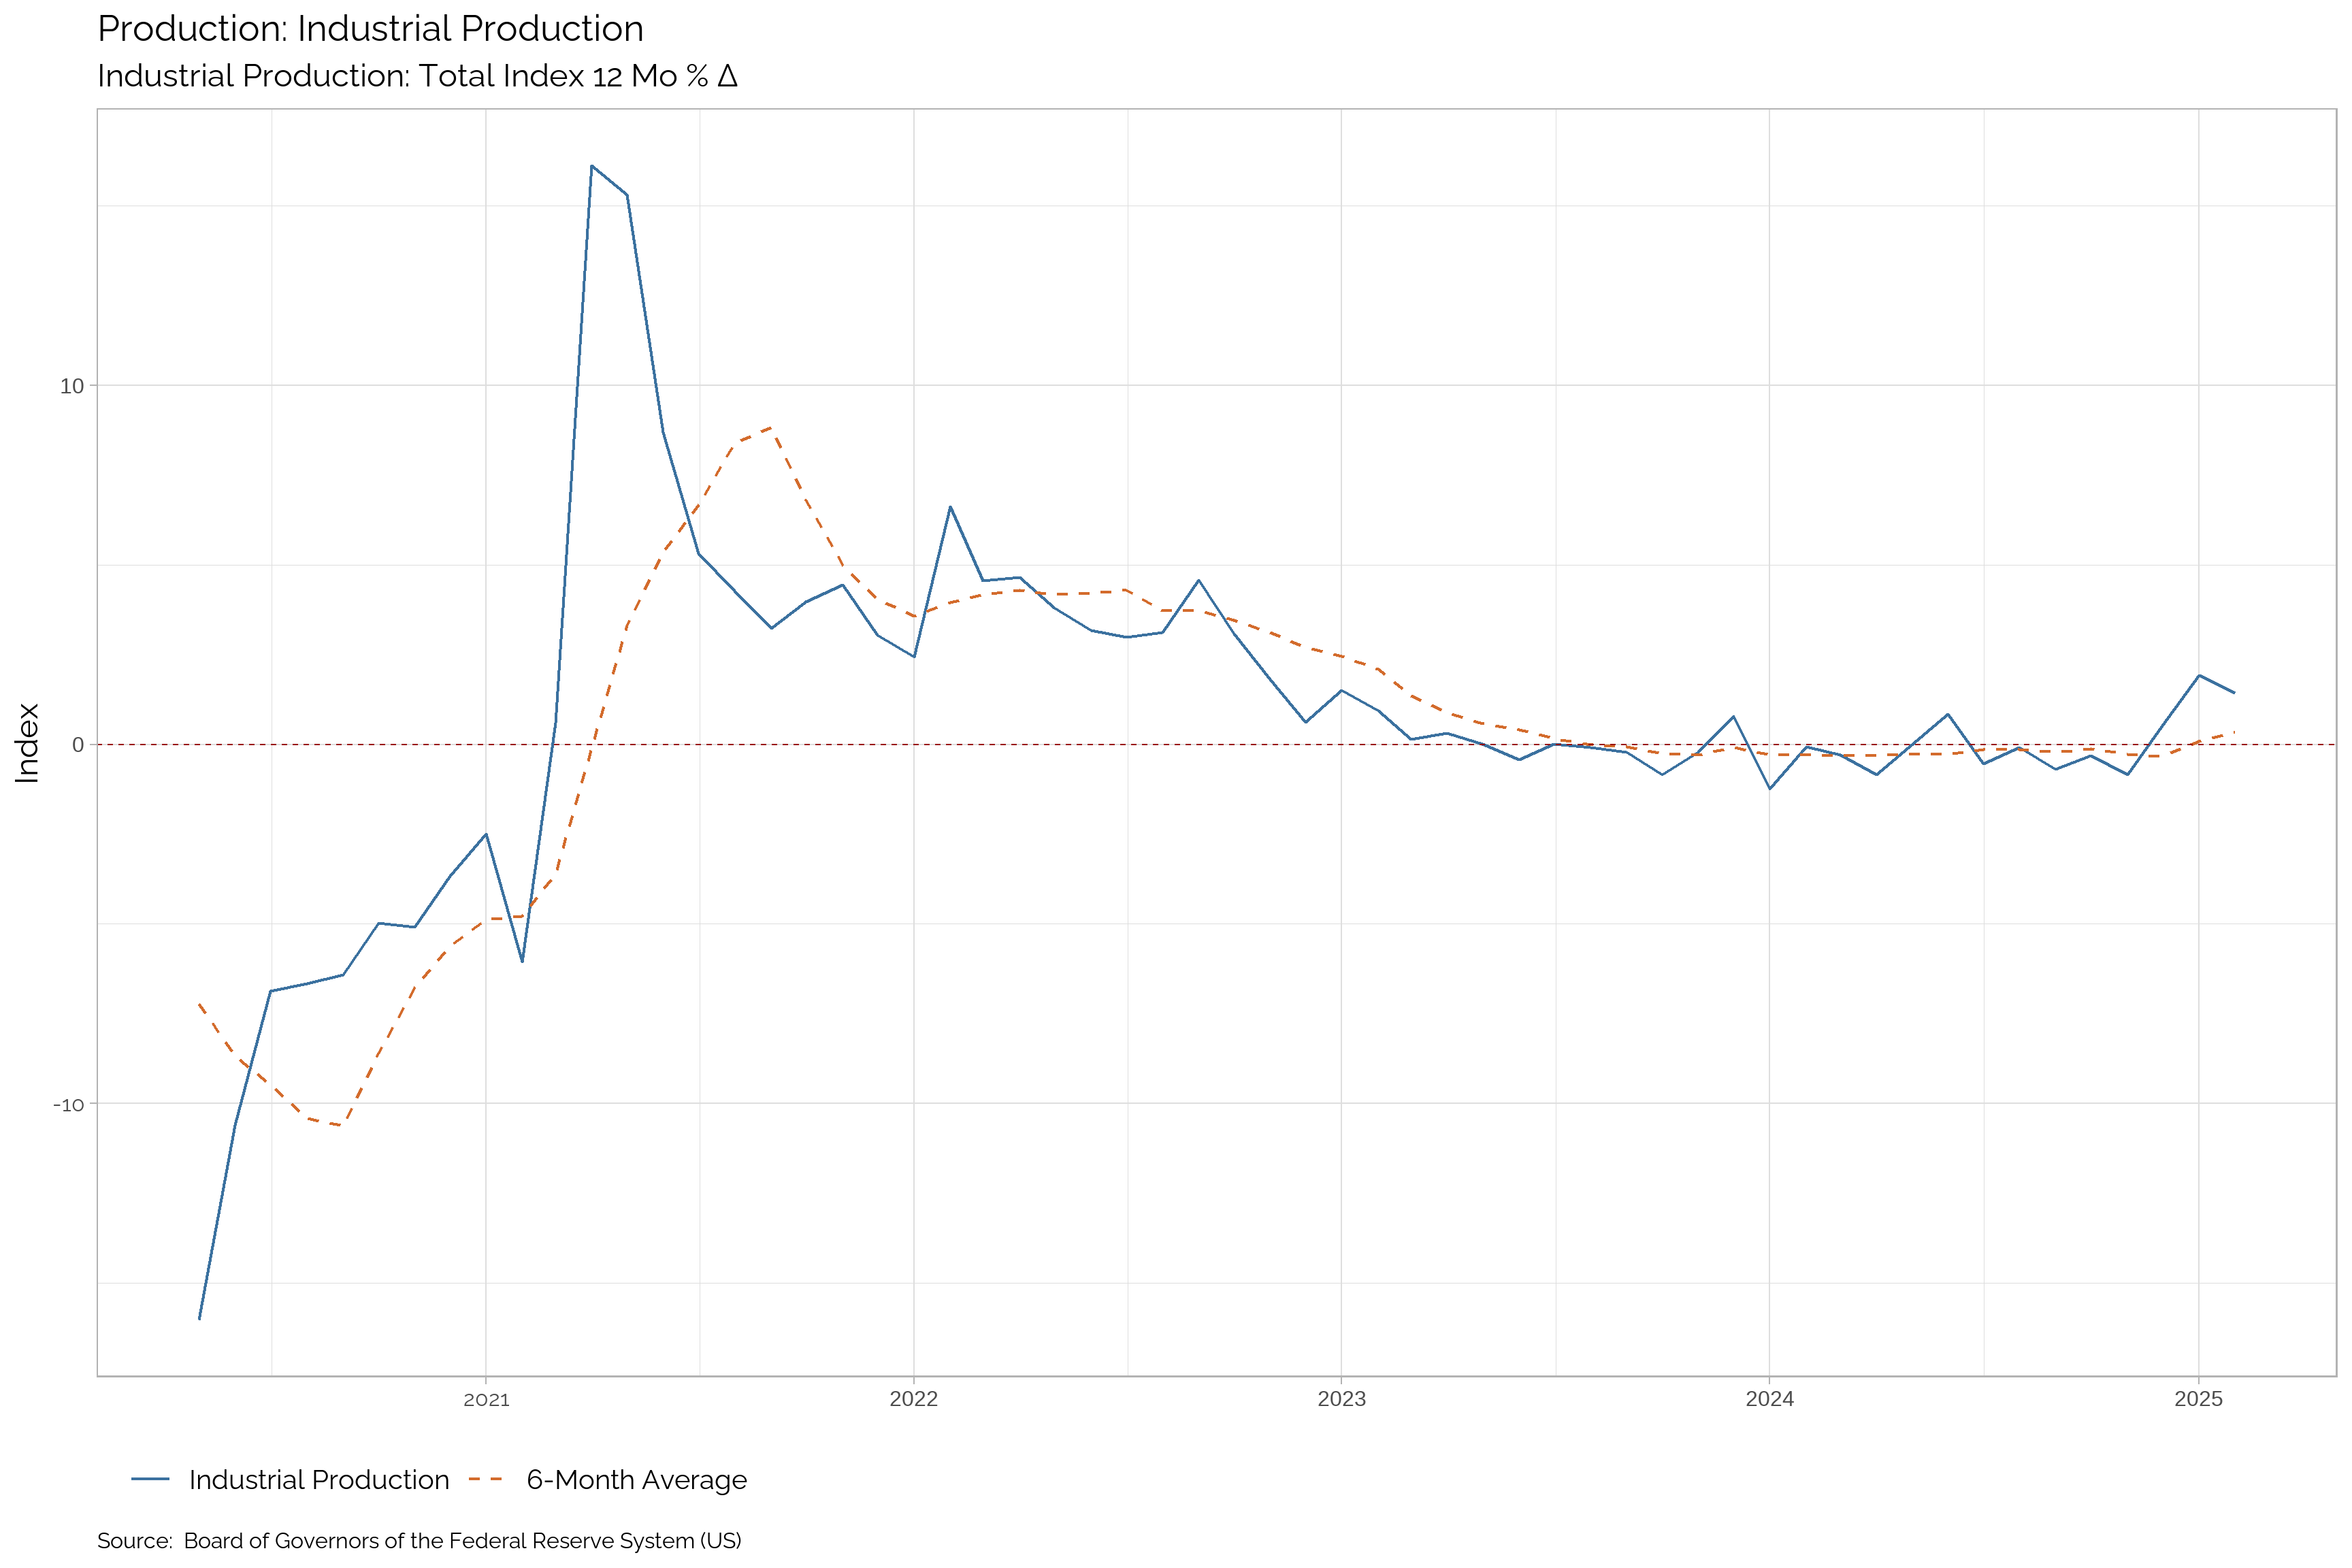
Industrial Production
Industrial production is a key economic indicator that measures the output of the industrial sector. This metric includes manufacturing, mining, and utilities, providing insight into the overall health of the industrial economy. Industrial production is a critical component of GDP, reflecting the total value of goods produced by the industrial sector. A rising trend in industrial production indicates increased output and economic growth.
| Apr-25 | Mar-25 | Feb-25 | Jan-25 | Dec-24 | Nov-24 | Oct-24 | Sep-24 | Aug-24 | Jul-24 | Jun-24 | May-24 | |
|---|---|---|---|---|---|---|---|---|---|---|---|---|
| Industrial Production | -- | -- | 104.21 | 103.44 | 103.17 | 102.02 | 102.27 | 102.6 | 103.02 | 102.52 | 103.25 | 102.98 |
| Δ Change | -- | -- | 0.77 | 0.27 | 1.14 | -0.24 | -0.33 | -0.42 | 0.5 | -0.73 | 0.27 | 0.62 |
| Percent Δ Change | -- | -- | 0.75 | 0.26 | 1.12 | -0.24 | -0.32 | -0.41 | 0.49 | -0.71 | 0.27 | 0.61 |
| Growth Rate | -- | -- | 1.44 | 1.92 | 0.52 | -0.84 | -0.3 | -0.69 | -0.07 | -0.54 | 0.85 | 0 |
| Trend | -- | -- | Up | Up | Up | Down | Down | Down | Up | Down | Up | Up |
| Trend in Growth Rate | -- | -- | Up | Up | Up | Down | Down | Down | Up | Down | Up | Up |
Employment
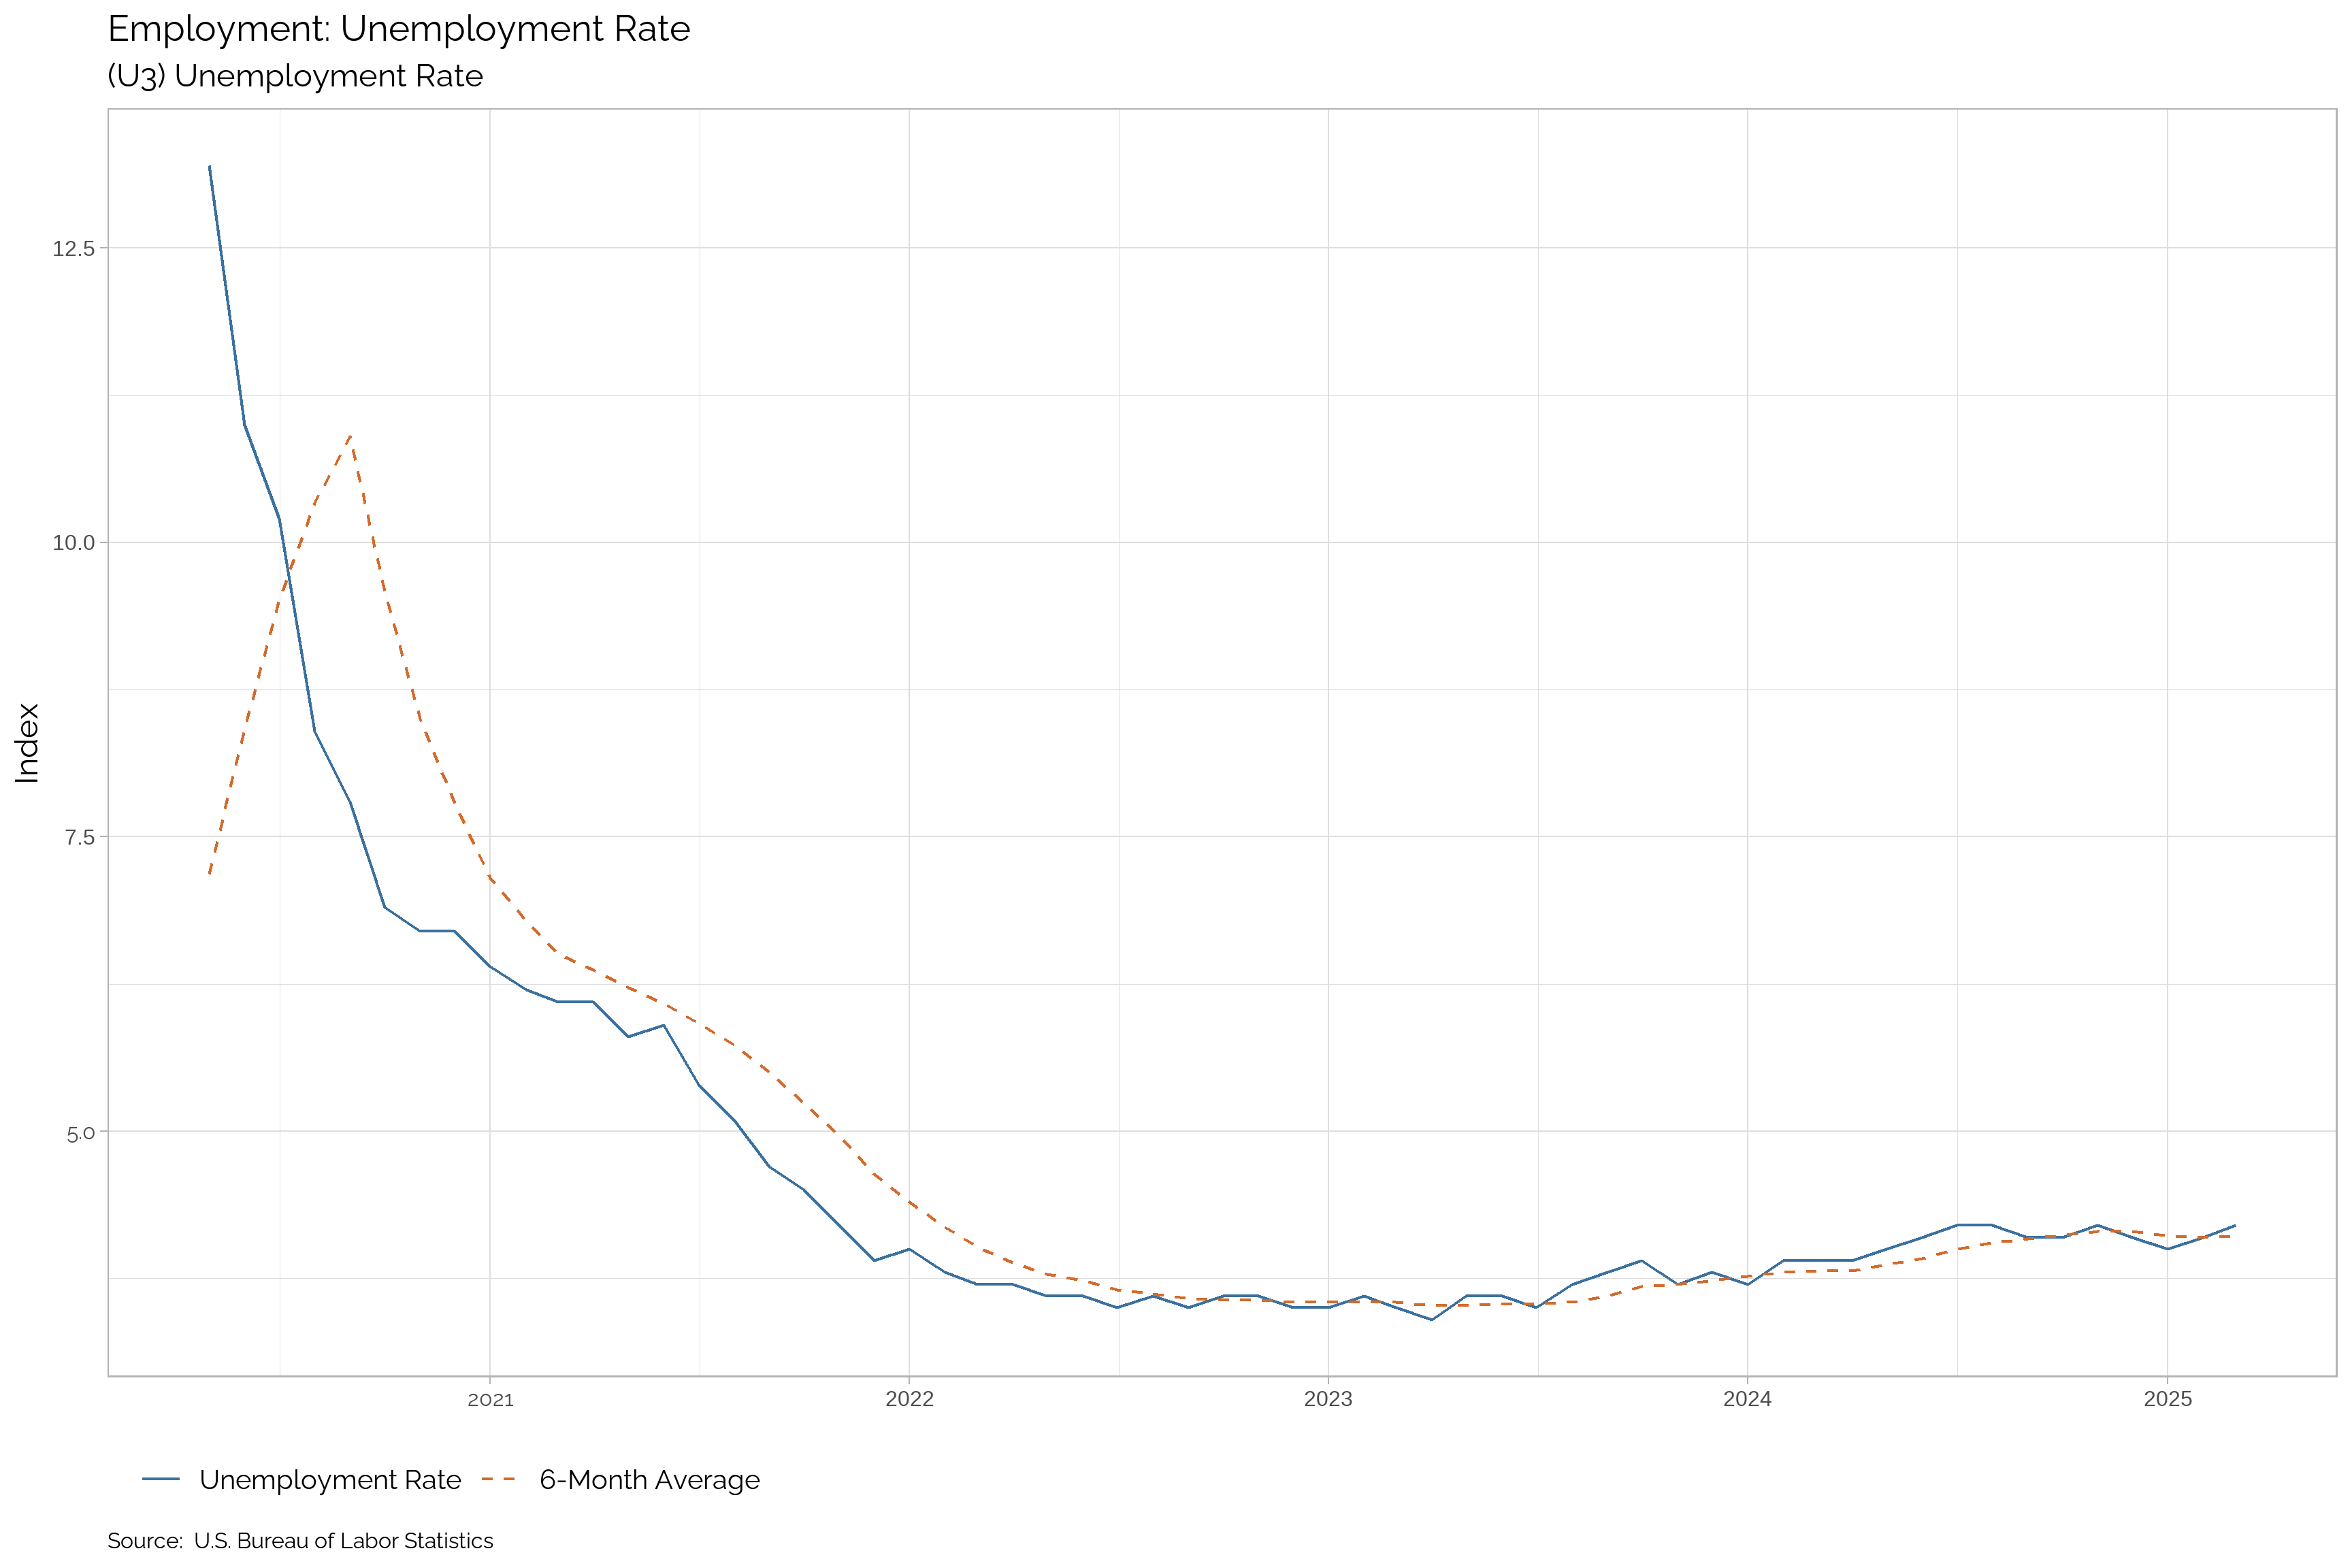
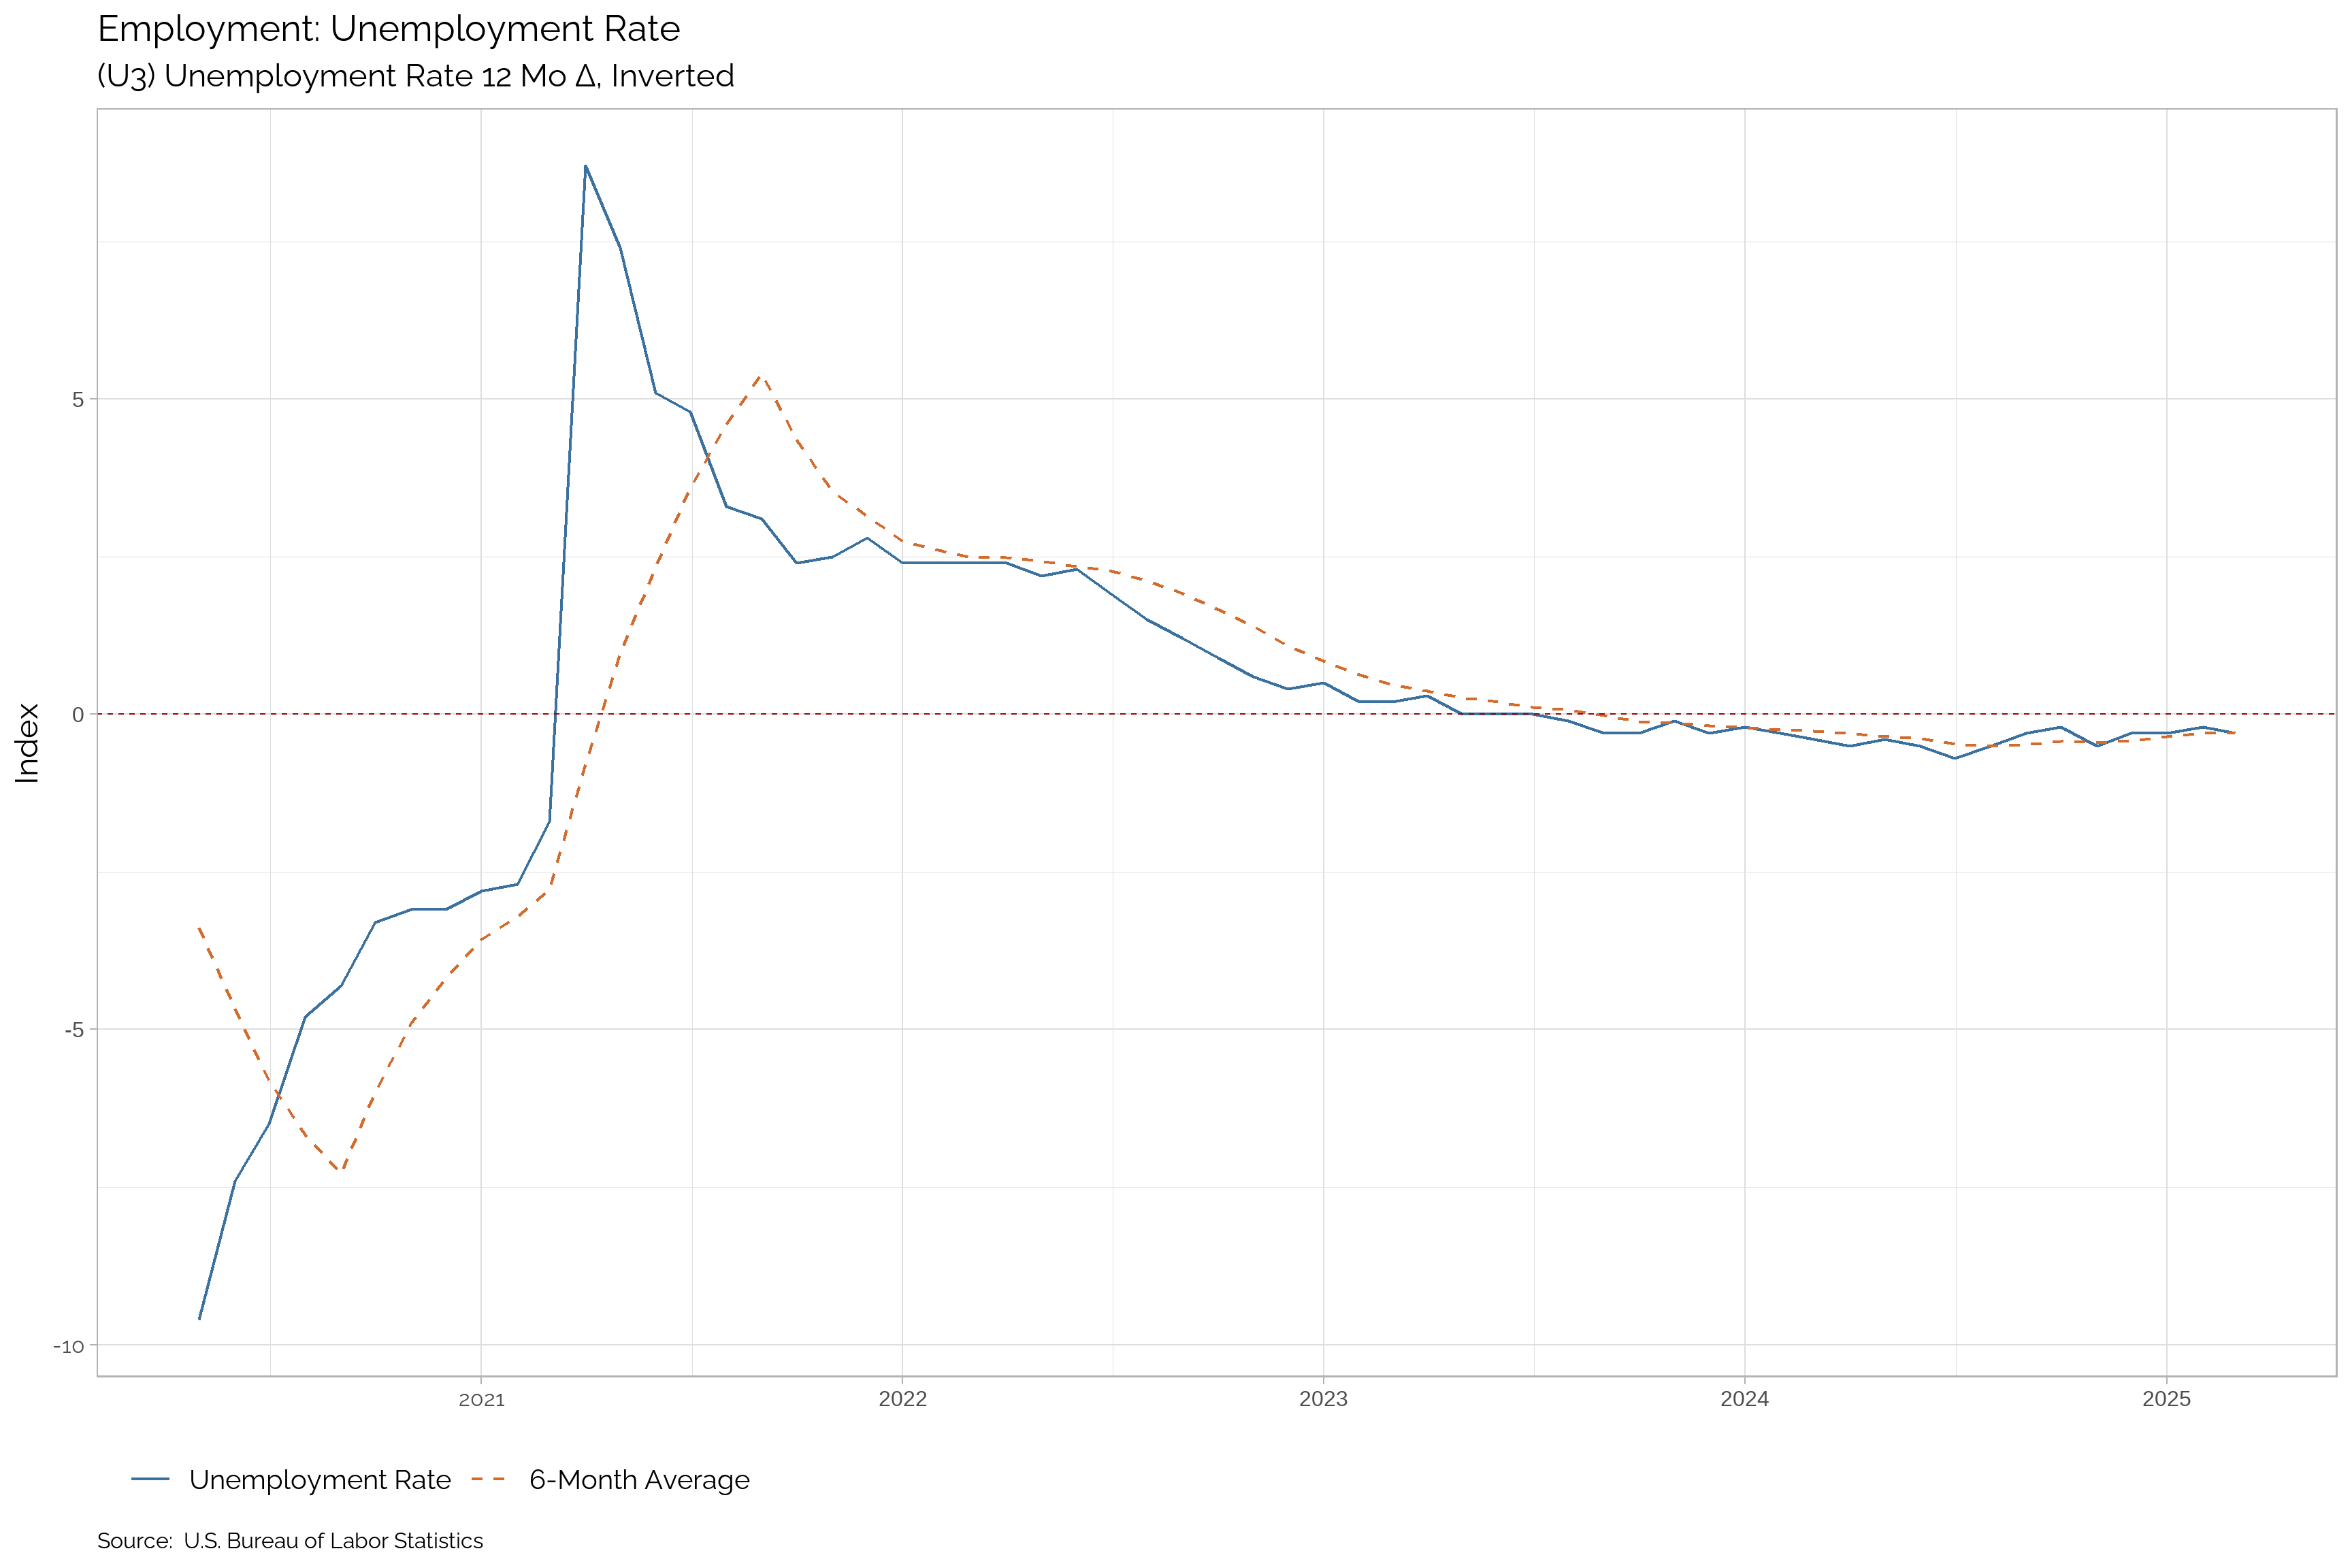
Unemployment
Unemployment is a key economic indicator that measures the number of people who are actively seeking employment but are unable to find work. The unemployment rate is a critical component of the labor market, reflecting the percentage of the labor force that is unemployed. A rising trend in unemployment indicates increased joblessness and economic distress. The unemployment rate is a key metric for policymakers and investors, providing insight into the overall health of the economy.
| Apr-25 | Mar-25 | Feb-25 | Jan-25 | Dec-24 | Nov-24 | Oct-24 | Sep-24 | Aug-24 | Jul-24 | Jun-24 | May-24 | |
|---|---|---|---|---|---|---|---|---|---|---|---|---|
| Unemployment Rate | -- | 4.2 | 4.1 | 4 | 4.1 | 4.2 | 4.1 | 4.1 | 4.2 | 4.2 | 4.1 | 4 |
| Δ Change | -- | 0.1 | 0.1 | -0.1 | -0.1 | 0.1 | 0 | -0.1 | 0 | 0.1 | 0.1 | 0.1 |
| Percent Δ Change | -- | 2.44 | 2.5 | -2.44 | -2.38 | 2.44 | 0 | -2.38 | 0 | 2.44 | 2.5 | 2.56 |
| Growth Rate | -- | -0.3 | -0.2 | -0.3 | -0.3 | -0.5 | -0.2 | -0.3 | -0.5 | -0.7 | -0.5 | -0.4 |
| Trend | -- | Up | Down | Down | Down | Up | Down | Up | Up | Up | Up | Up |
| Trend in Growth Rate | -- | Down | Up | Up | Up | Down | Up | Up | Down | Down | Down | Down |
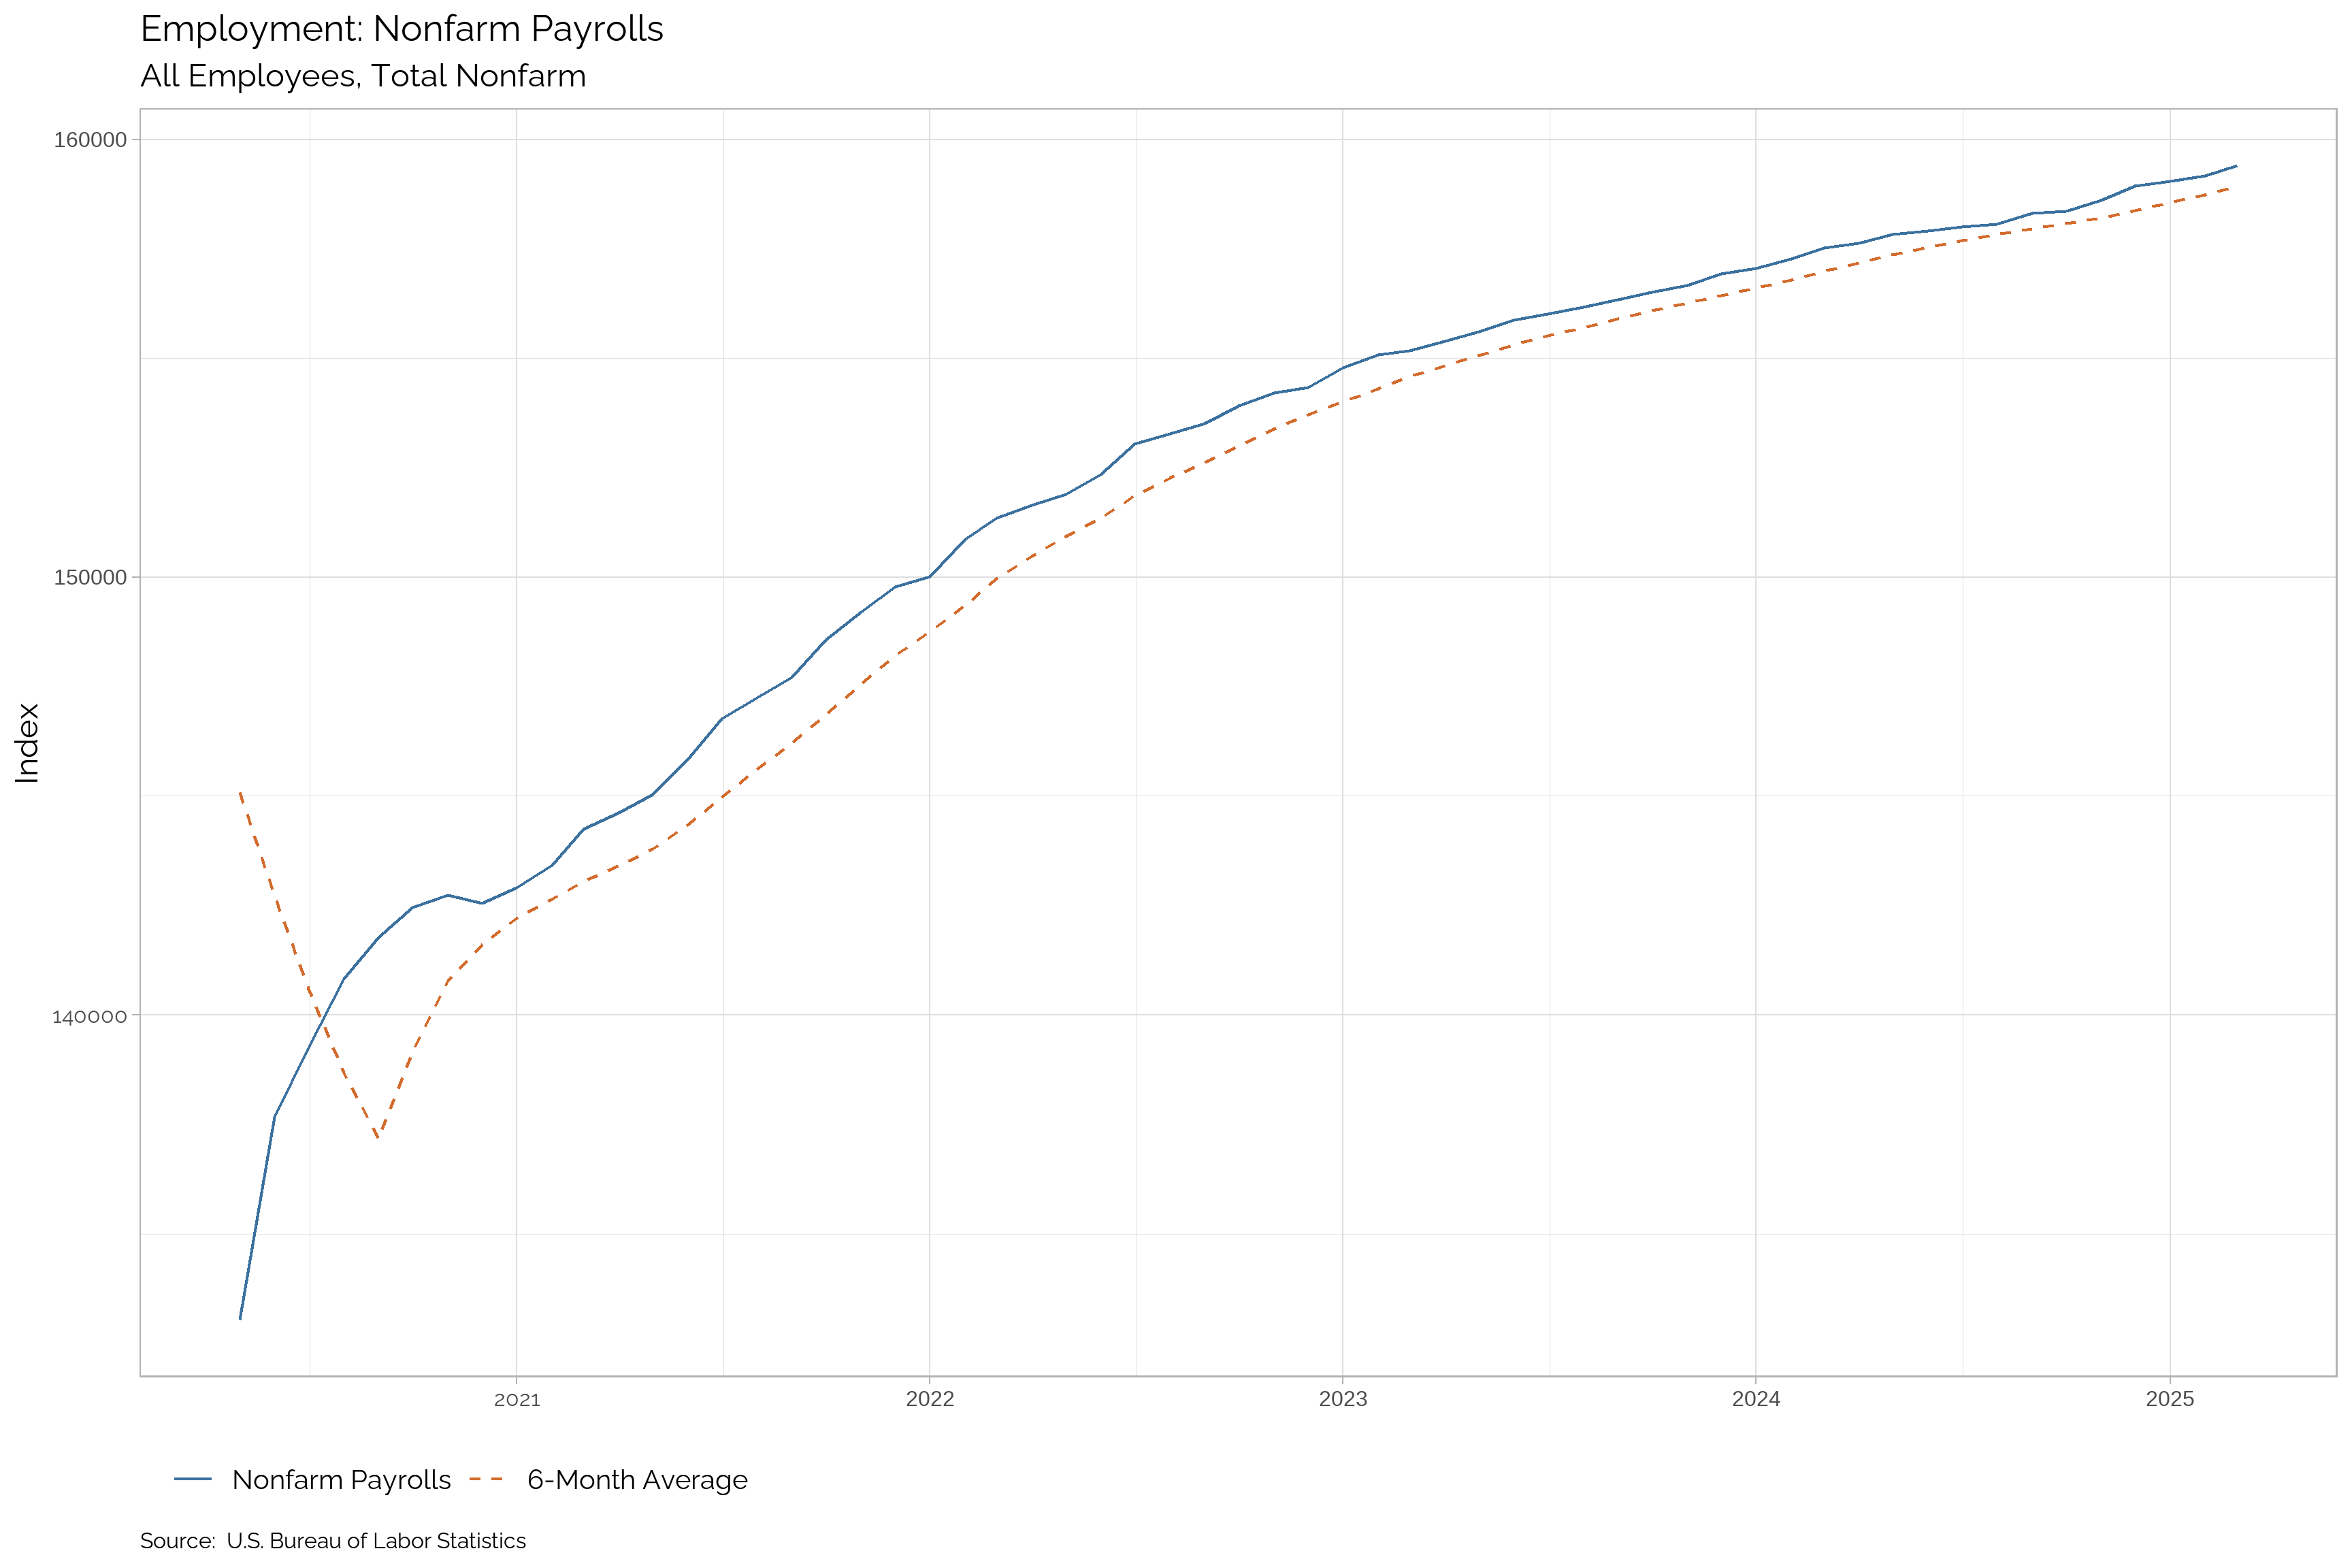
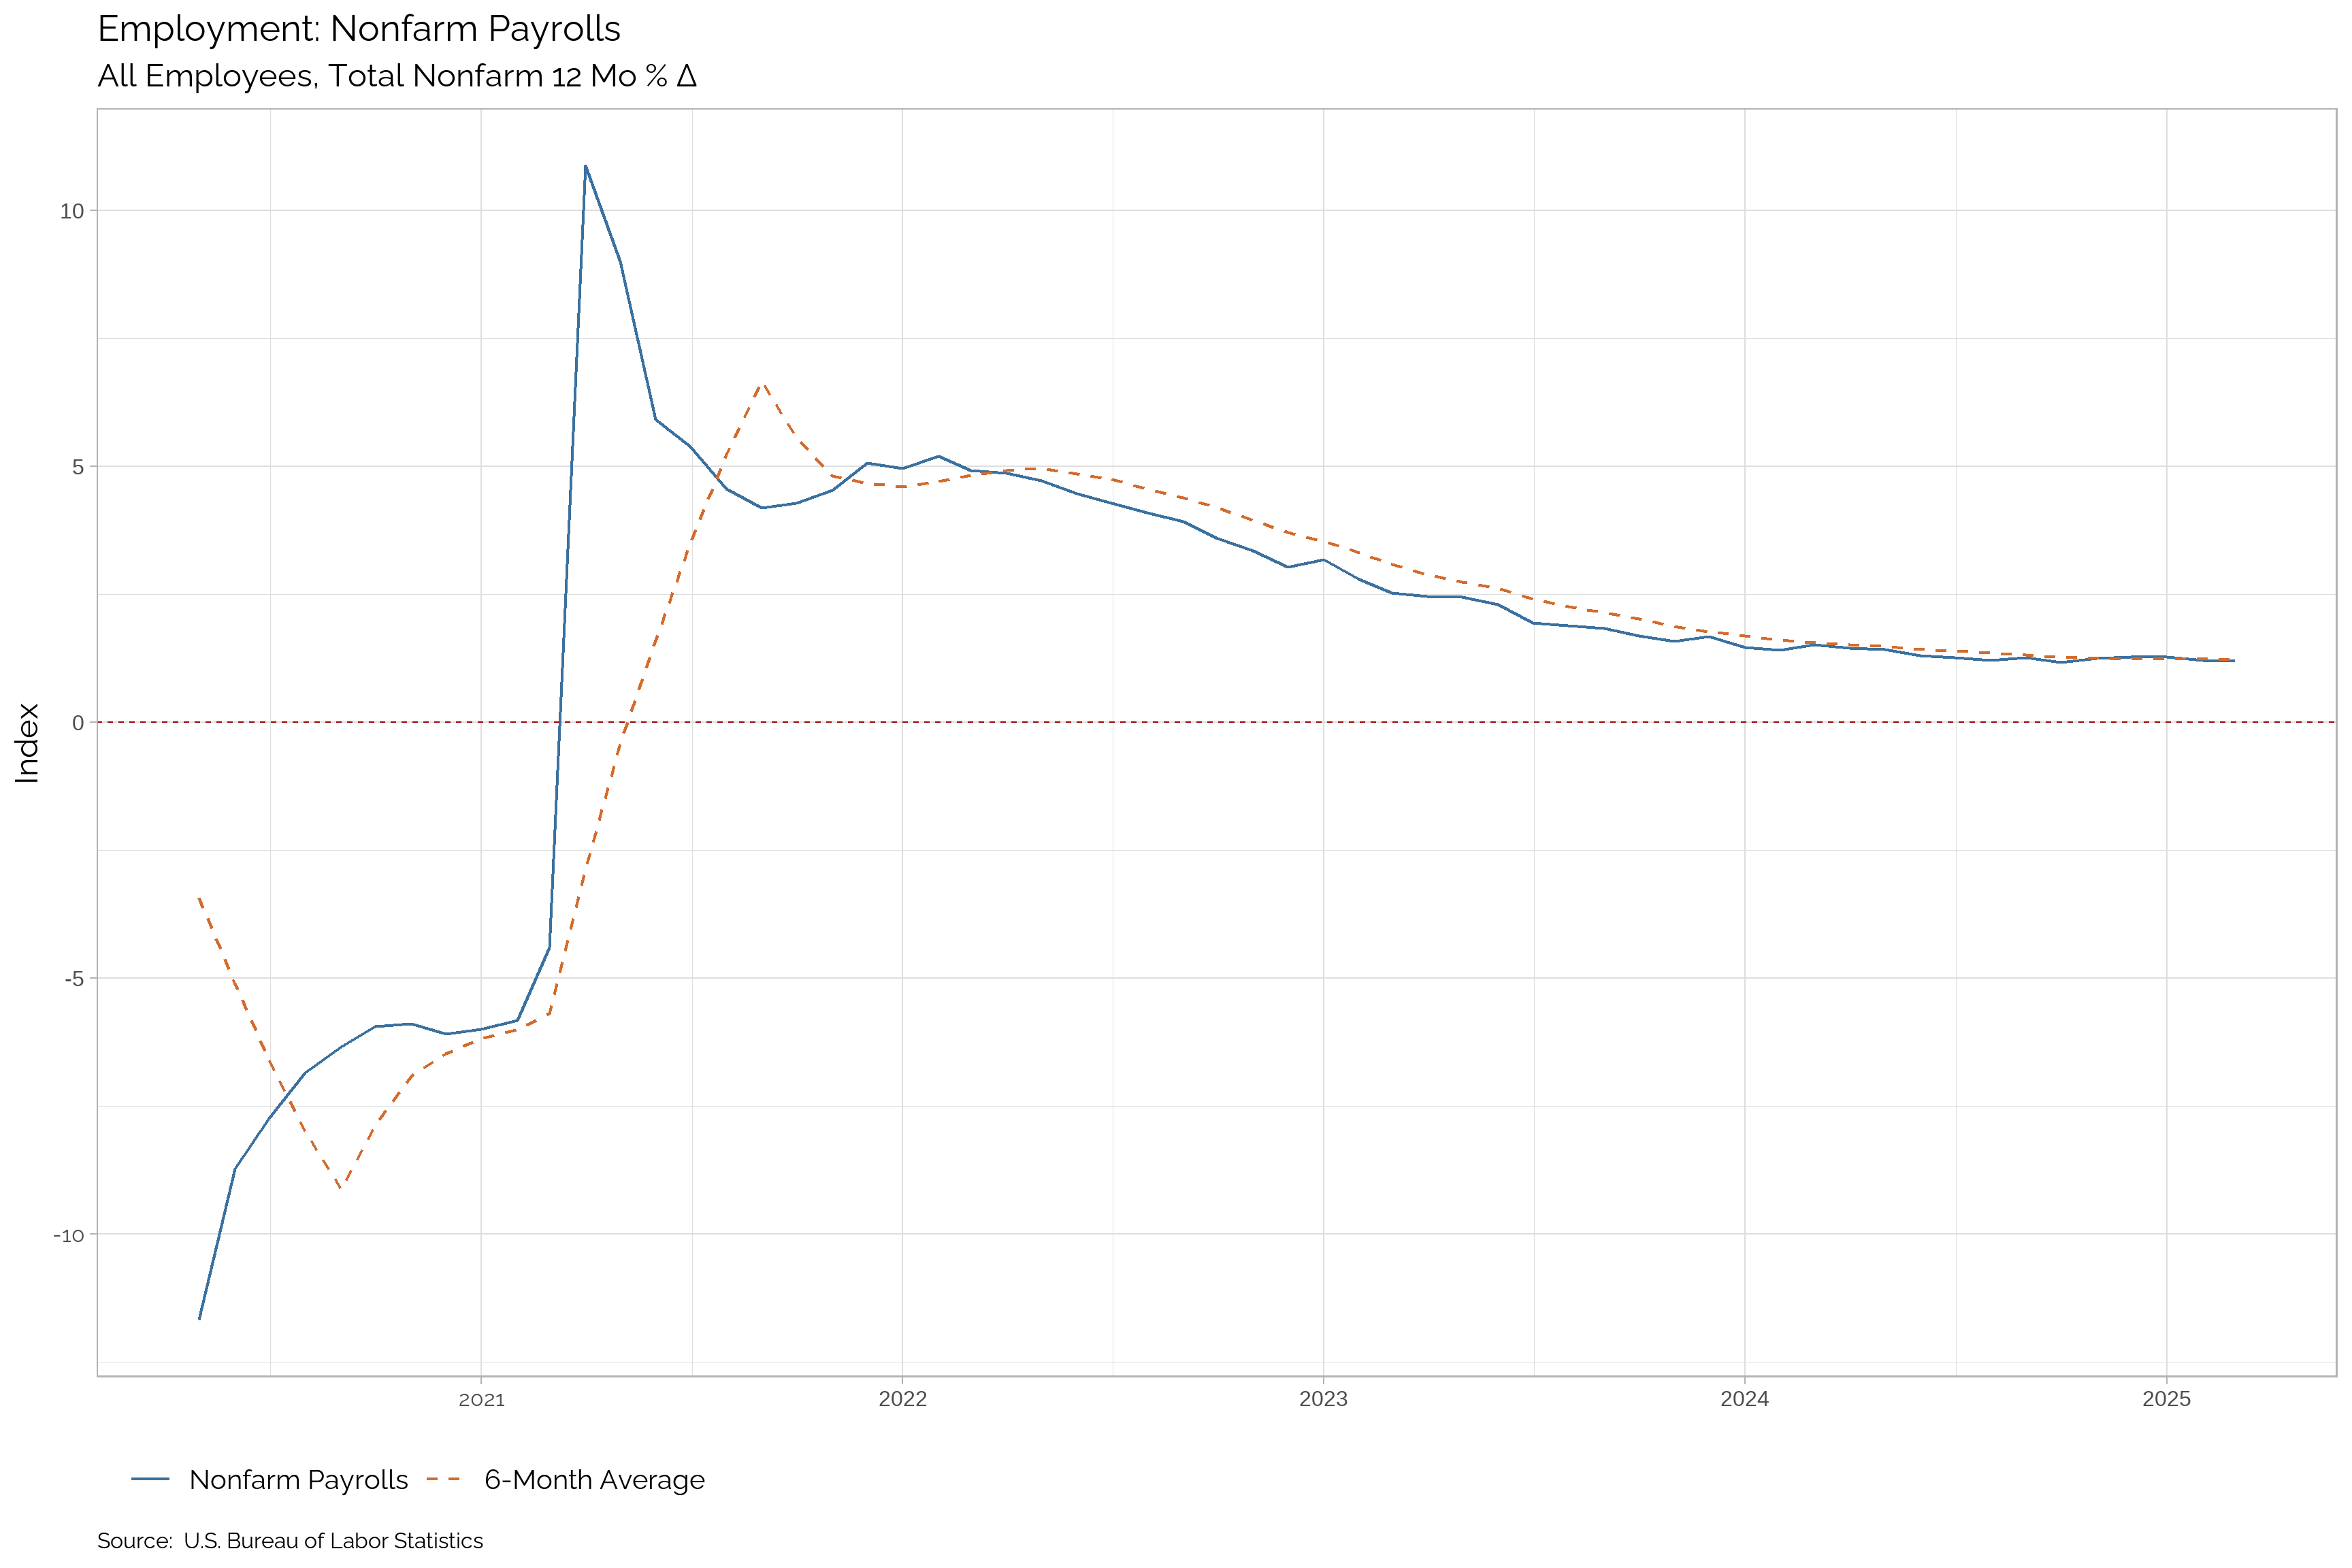
Nonfarm Payrolls
Nonfarm payrolls are a critical indicator of employment trends, reflecting the number of jobs added or lost in the economy, excluding farm workers, government employees, and a few other categories. This metric provides a comprehensive view of the labor market’s health, offering insights into job creation, wage growth, and overall economic activity. A rising trend in nonfarm payrolls indicates a growing job market, increased consumer spending, and a healthier economy.
| Apr-25 | Mar-25 | Feb-25 | Jan-25 | Dec-24 | Nov-24 | Oct-24 | Sep-24 | Aug-24 | Jul-24 | Jun-24 | May-24 | |
|---|---|---|---|---|---|---|---|---|---|---|---|---|
| Nonfarm Payrolls | -- | 159398 | 159170 | 159053 | 158942 | 158619 | 158358 | 158314 | 158074 | 158003 | 157915 | 157828 |
| Δ Change | -- | 228 | 117 | 111 | 323 | 261 | 44 | 240 | 71 | 88 | 87 | 193 |
| Percent Δ Change | -- | 0.14 | 0.07 | 0.07 | 0.2 | 0.16 | 0.03 | 0.15 | 0.04 | 0.06 | 0.06 | 0.12 |
| Growth Rate | -- | 1.19 | 1.21 | 1.28 | 1.28 | 1.25 | 1.17 | 1.27 | 1.22 | 1.27 | 1.31 | 1.42 |
| Trend | -- | Up | Up | Up | Up | Up | Up | Up | Up | Up | Up | Up |
| Trend in Growth Rate | -- | Down | Down | Up | Up | Up | Down | Down | Down | Down | Down | Down |
Coincident Analysis
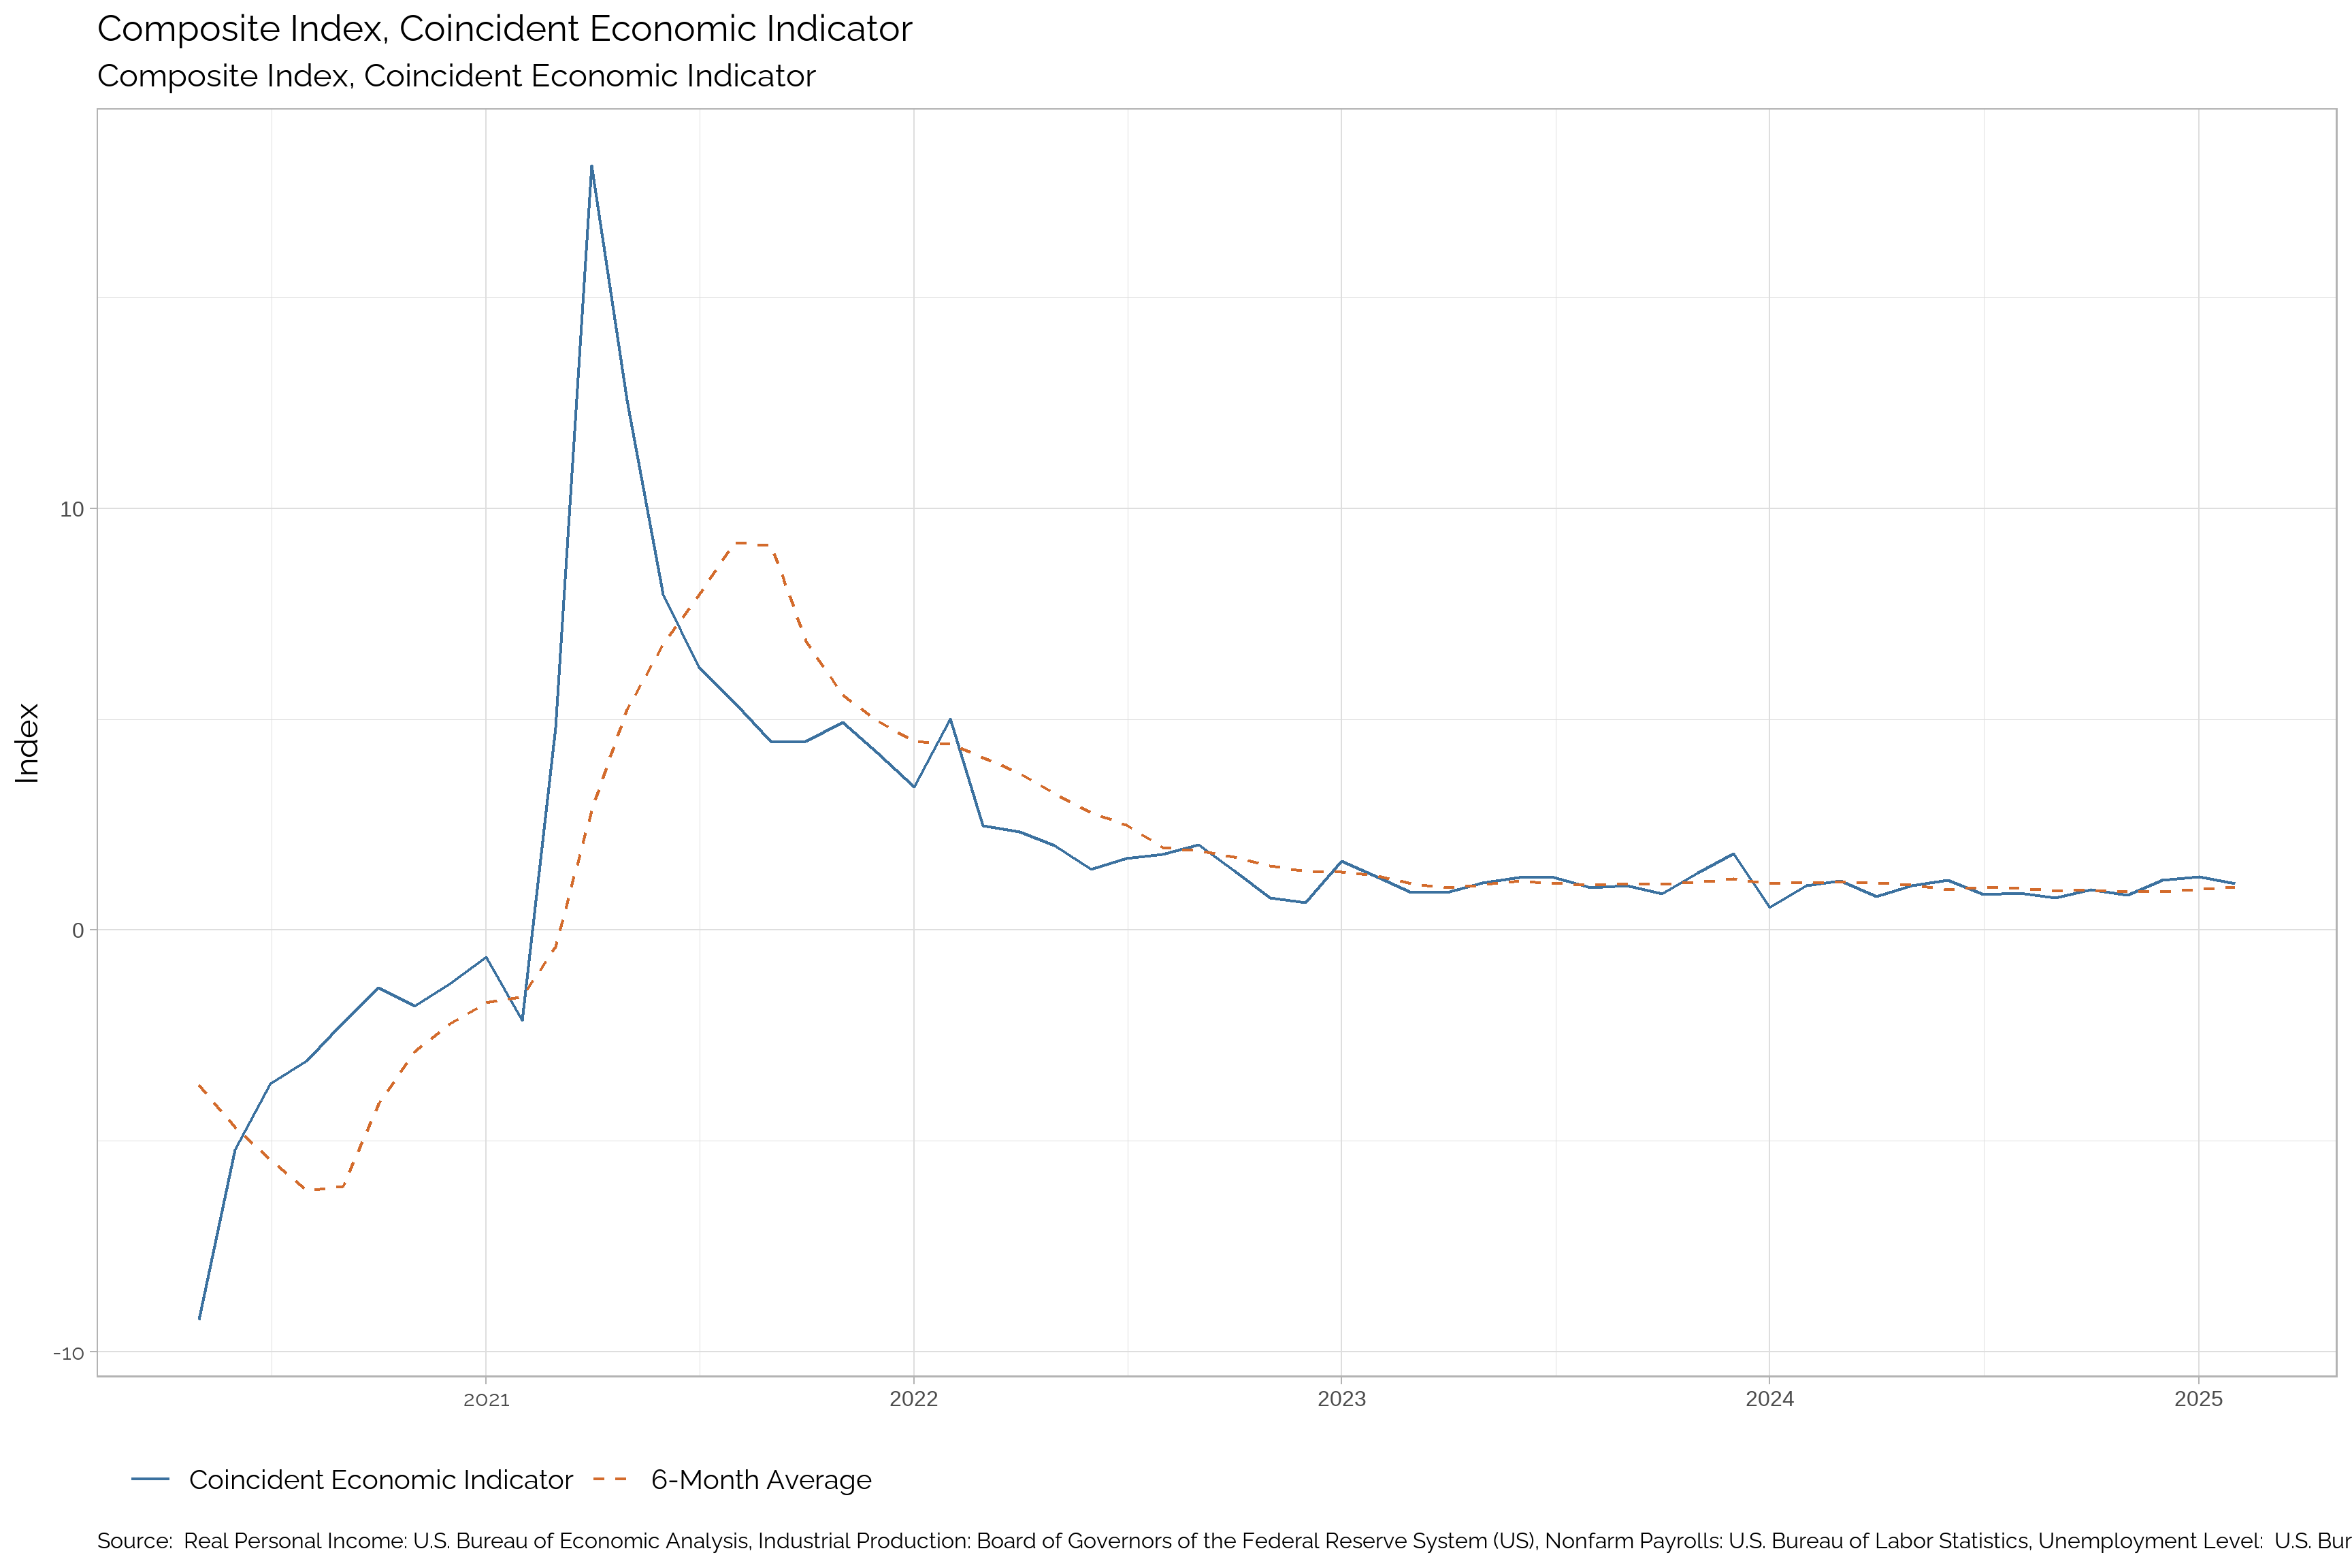
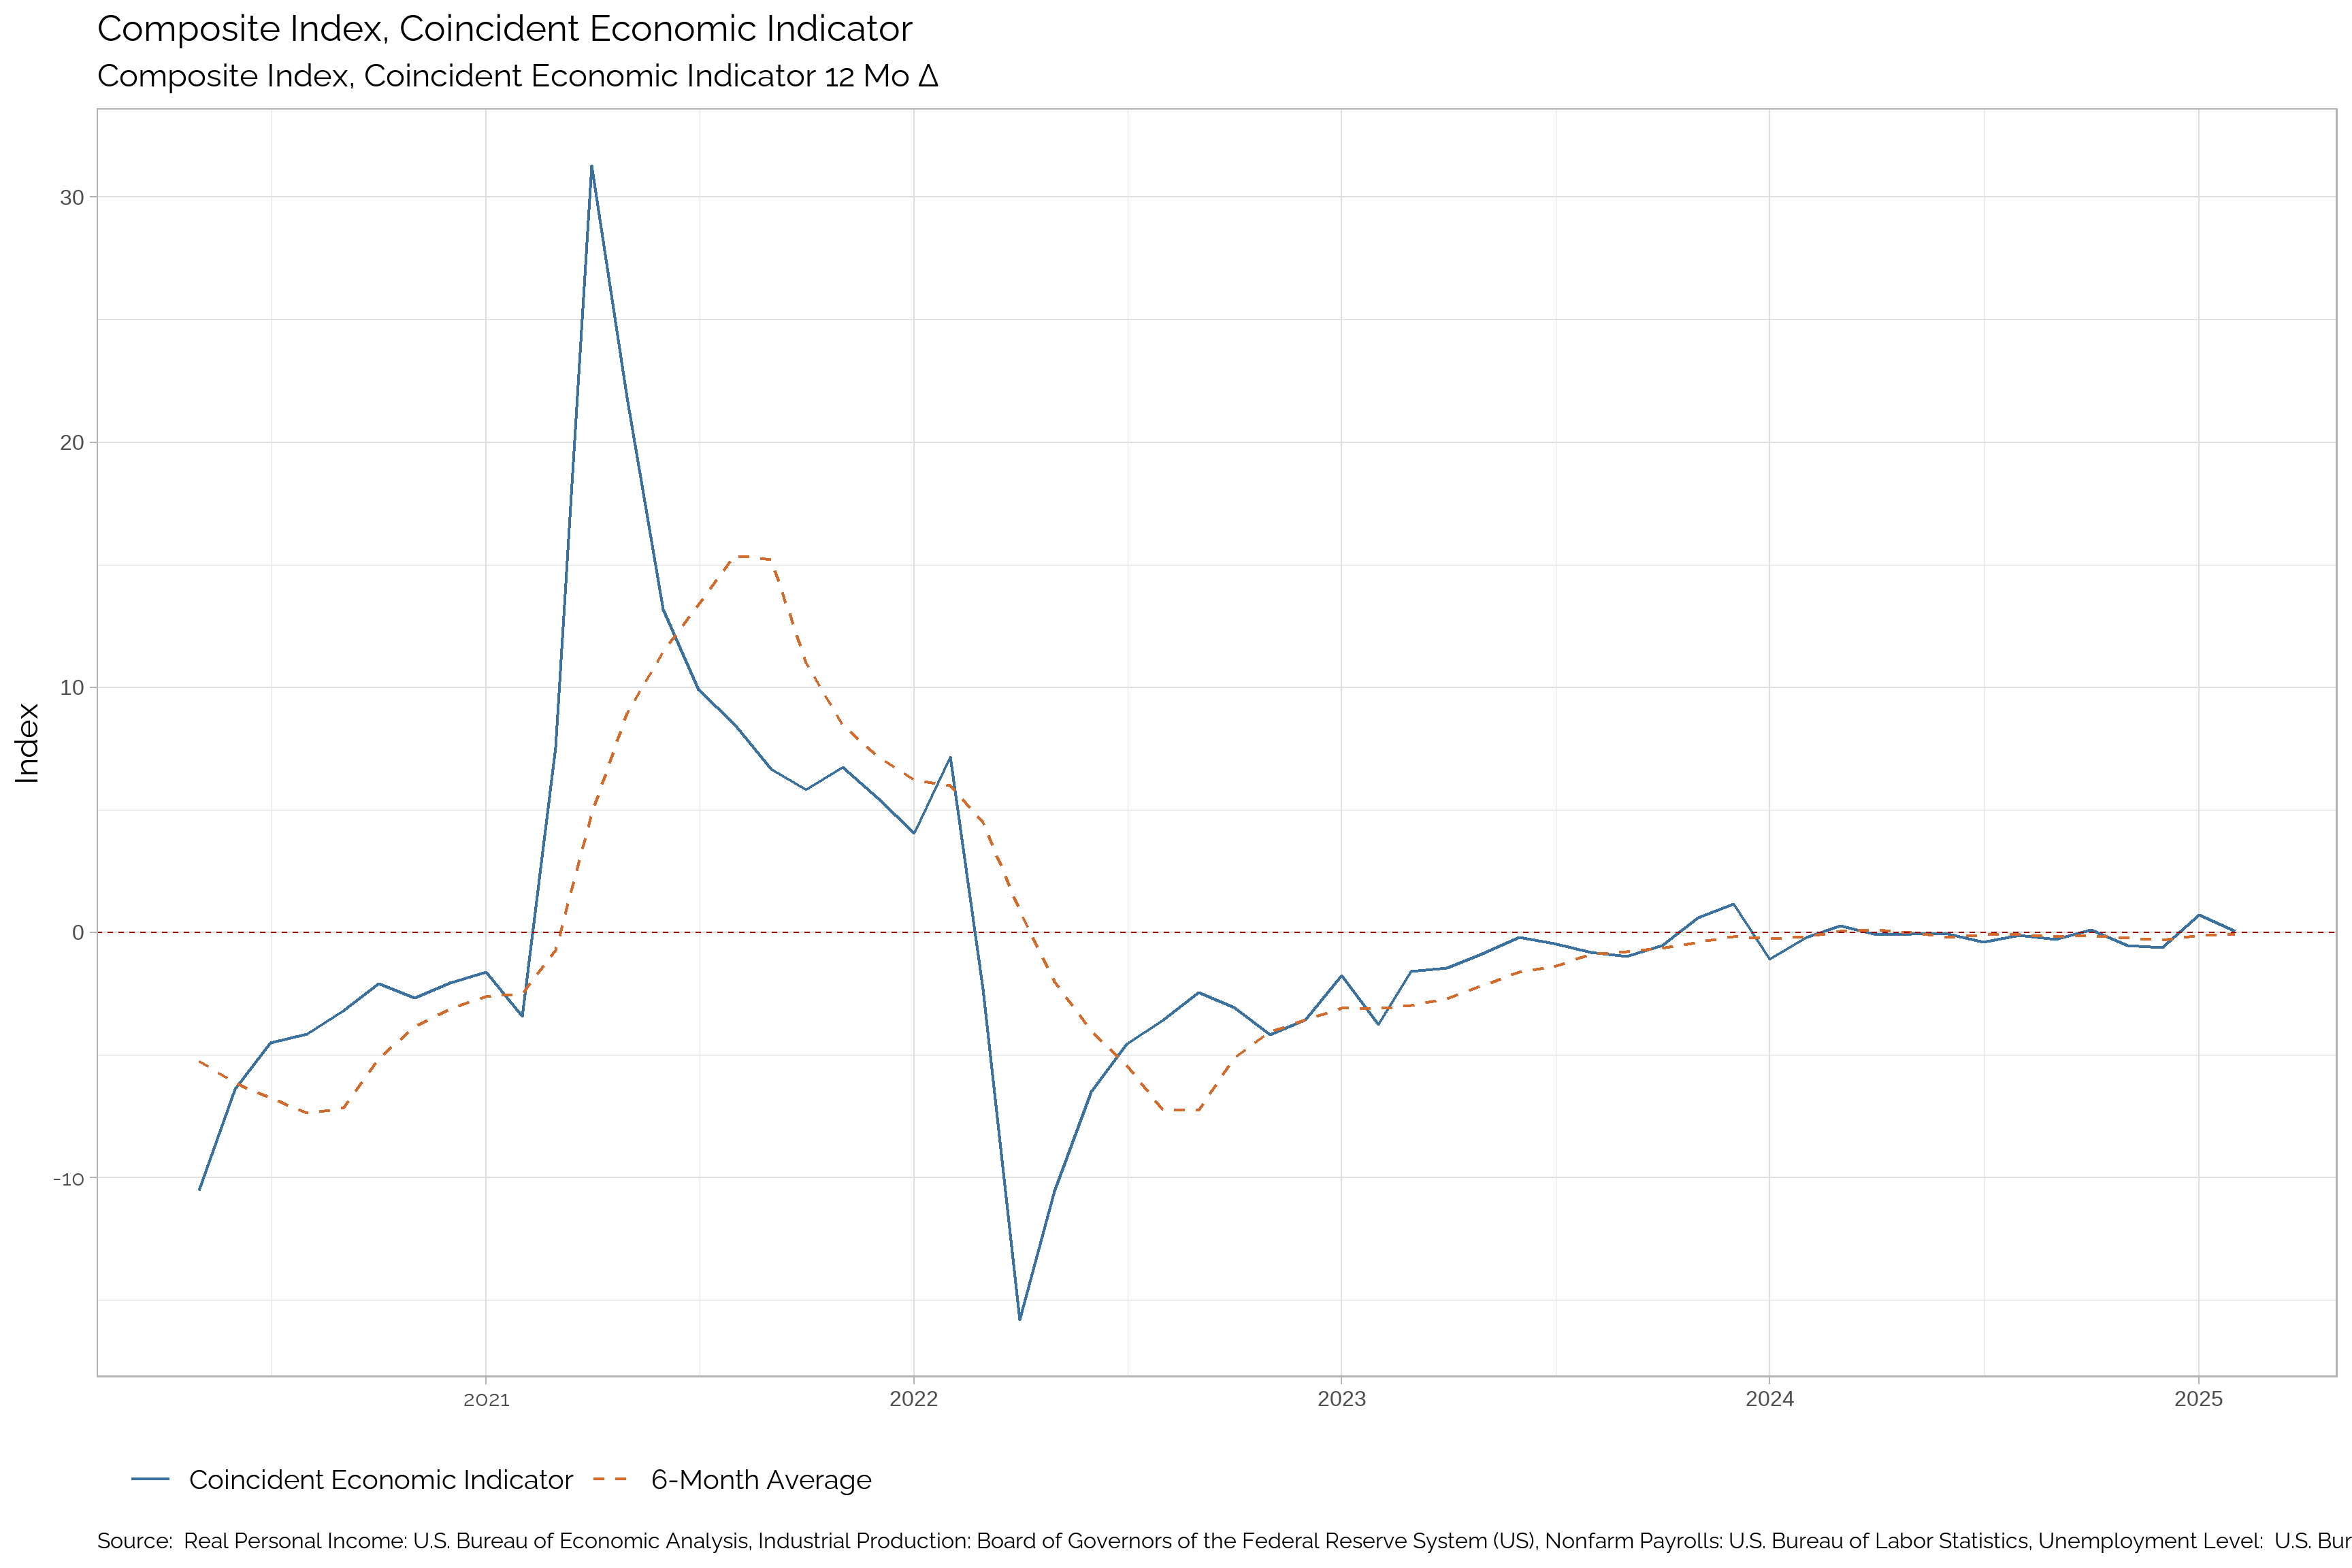
Composite Index, Coincident Economic Indicator
| Apr-25 | Mar-25 | Feb-25 | Jan-25 | Dec-24 | Nov-24 | Oct-24 | Sep-24 | Aug-24 | Jul-24 | Jun-24 | May-24 | |
|---|---|---|---|---|---|---|---|---|---|---|---|---|
| Coincident Economic Indicator | -- | -- | 1.1 | 1.27 | 1.19 | 0.84 | 0.97 | 0.77 | 0.87 | 0.85 | 1.19 | 1.05 |
| Δ Change | -- | -- | -0.16 | 0.08 | 0.35 | -0.13 | 0.2 | -0.1 | 0.02 | -0.33 | 0.13 | 0.26 |
| Percent Δ Change | -- | -- | -12.86 | 6.56 | 42.29 | -13.42 | 25.79 | -11.91 | 2.38 | -28.17 | 12.5 | 32.48 |
| Growth Rate | -- | -- | 0.05 | 0.72 | -0.62 | -0.53 | 0.11 | -0.28 | -0.13 | -0.4 | -0.07 | -0.07 |
| Trend | -- | -- | Up | Up | Up | Down | Up | Down | Down | Down | Up | Down |
| Trend in Growth Rate | -- | -- | Up | Up | Down | Down | Up | Down | Down | Down | Up | Down |
Regression Analysis
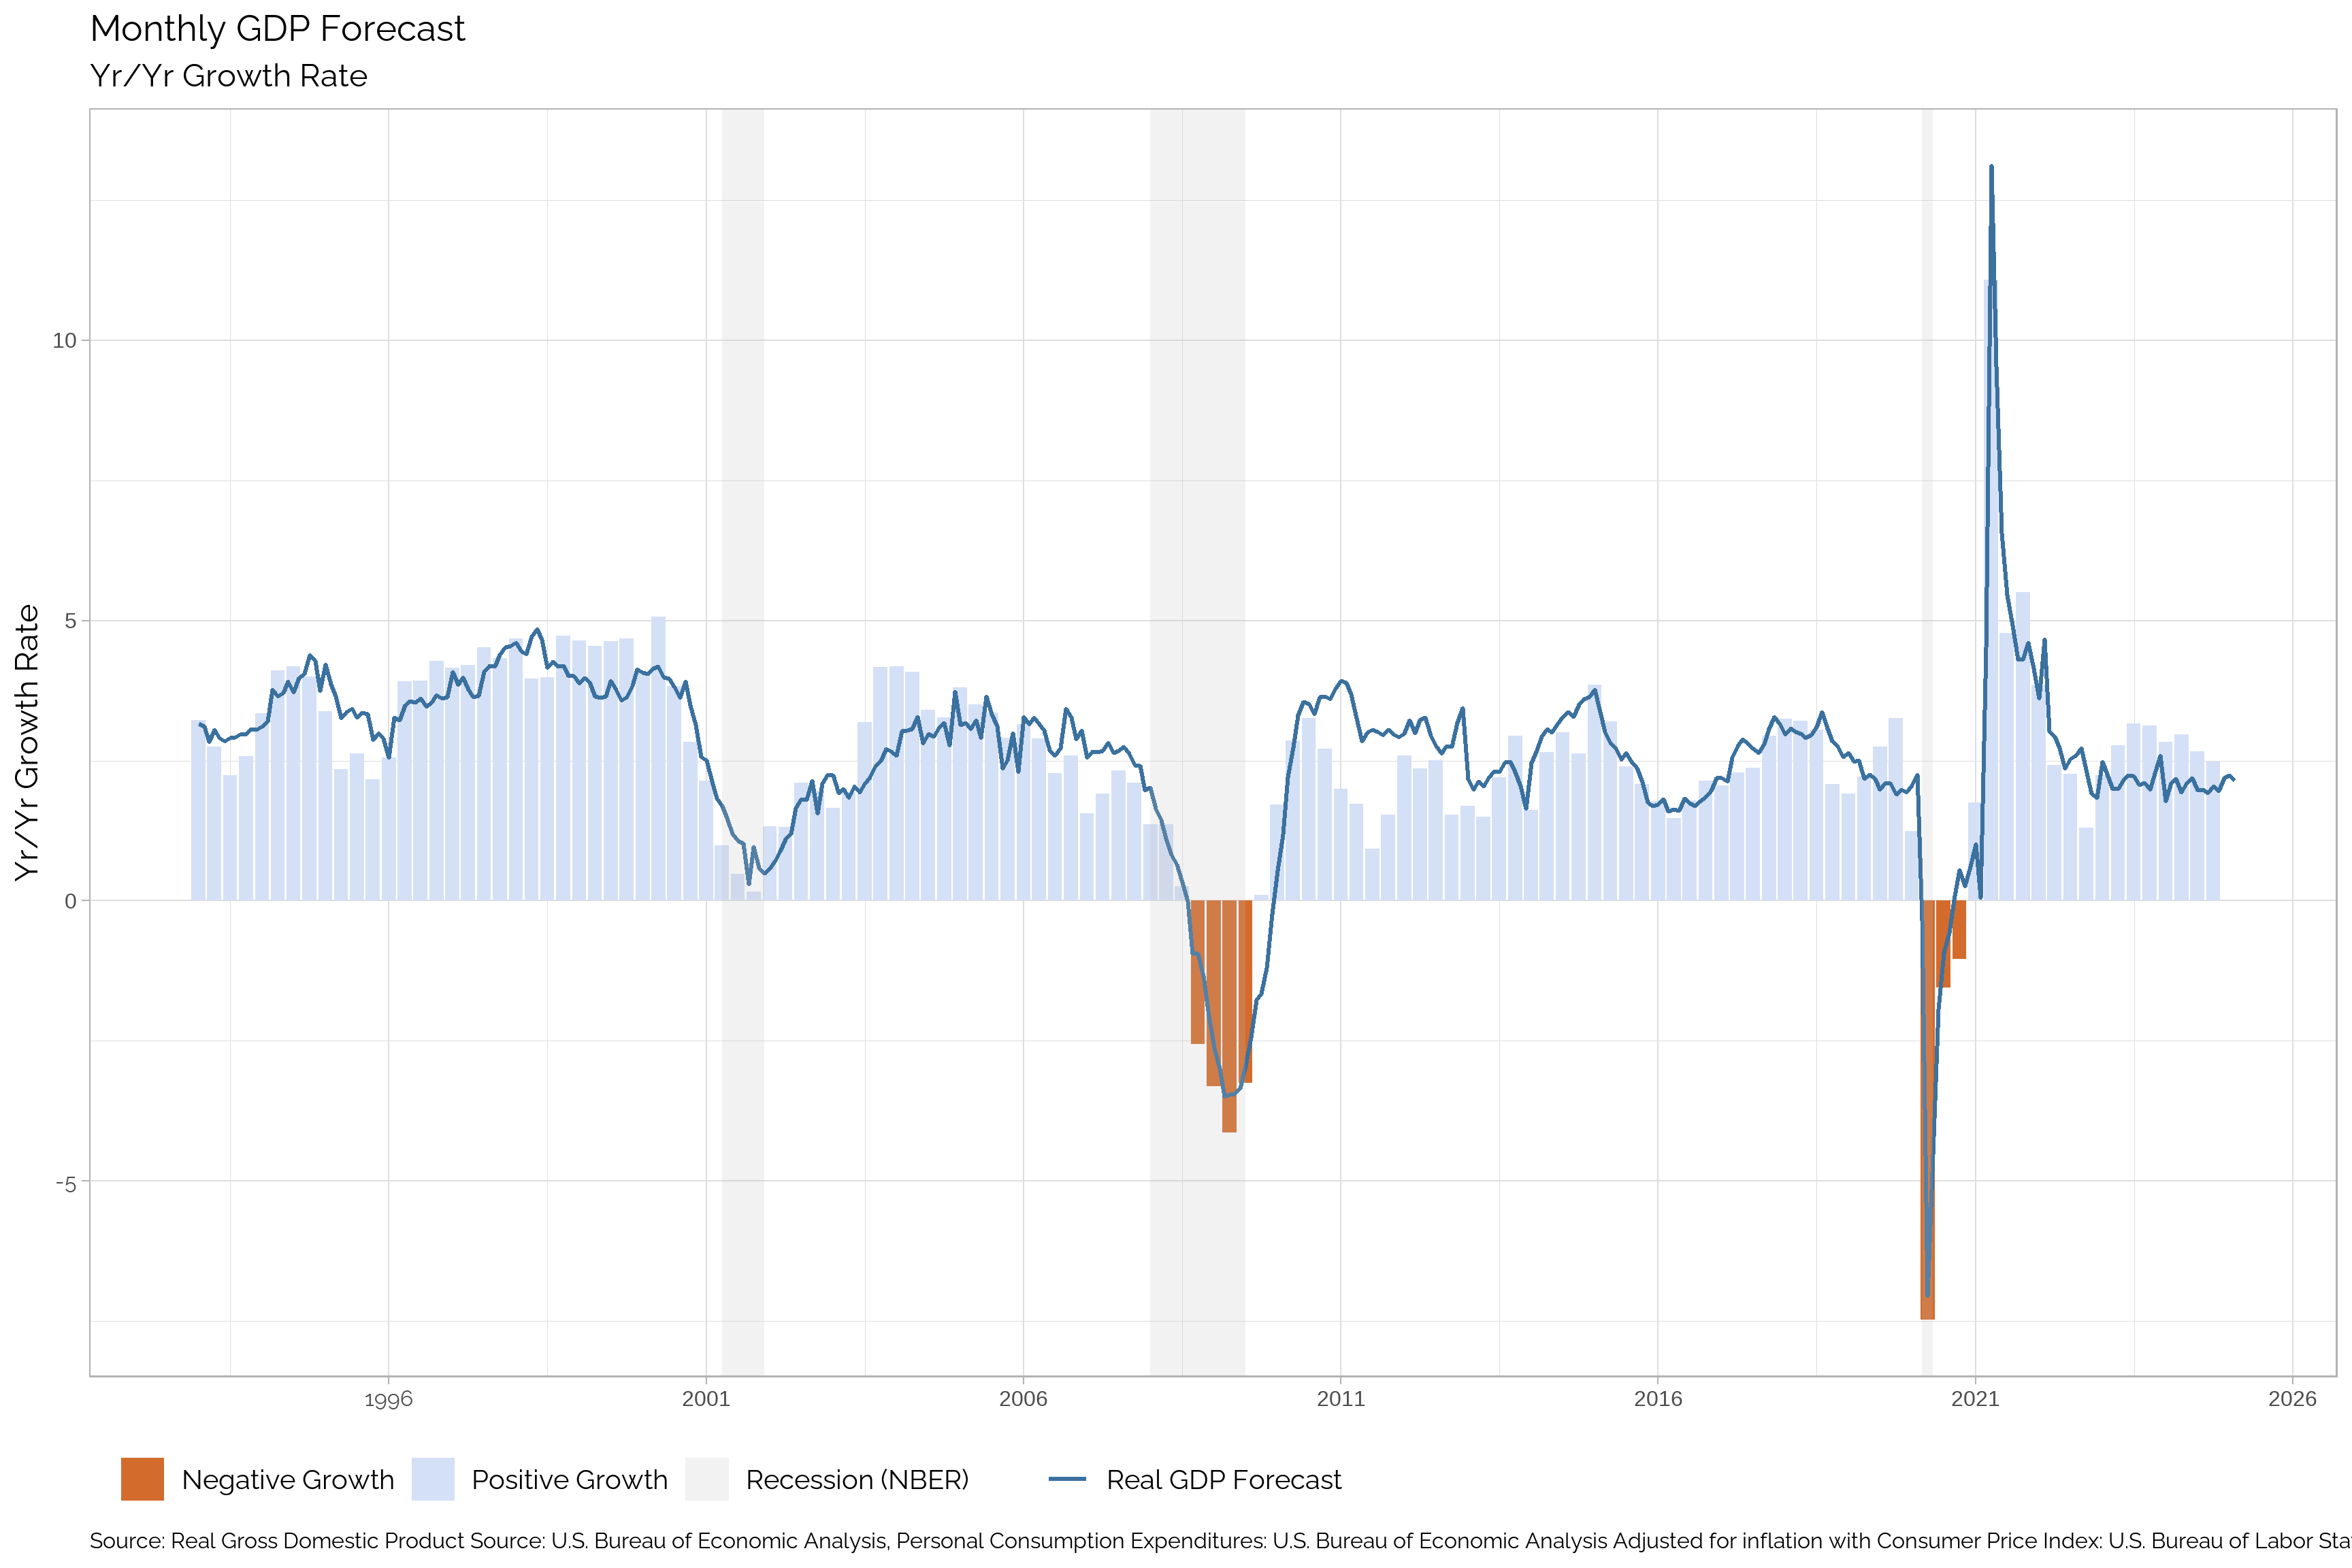
The coincident index growth rate serves as a remarkably powerful predictor of real GDP growth, offering a more immediate and insightful view into the economy’s current trajectory. The strong correlation between these two variables, measured at an impressive 0.93, underscores their close relationship. Furthermore, the R-squared value of 0.87 reveals that the coincident index accounts for a substantial 87% of the variability observed in real GDP growth. This high R-squared value emphasizes the index’s ability to effectively capture and explain the fluctuations in overall economic output.
The statistical significance of this model, validated at the stringent 1% level, reinforces its reliability and robustness. This high level of significance indicates that the observed relationship between the coincident index and real GDP growth is unlikely to be due to chance, providing a solid foundation for using the index in economic analysis. By leveraging this strong statistical relationship, we can generate a “nowcast” for real GDP growth, effectively providing a real-time estimate of current economic activity. This nowcasting capability offers a significant advantage over traditional quarterly GDP reports, which are released with a substantial delay, often several weeks or even months after the period they represent. This delay can hinder timely economic analysis and policy decisions, as it relies on historical data rather than current economic conditions.
In contrast, the coincident index, by incorporating variables that reflect the economy’s present state, allows for a more dynamic and responsive analysis. This ability to produce a near-real-time assessment of GDP growth is invaluable for policymakers, investors, and businesses alike, enabling them to make more informed decisions based on the most current economic information available. The nowcast generated from this model provides a valuable tool for understanding the present economic landscape, allowing for faster reactions to changing economic conditions and enabling more effective economic management.
Monthly GDP Forecast
The result of the regression analysis is used to generate a forecast for real GDP growth, providing valuable insights into the future trajectory of the economy. By leveraging the strong relationship between the coincident index and real GDP growth, we can produce an accurate and timely forecast of economic activity. This forecast offers a forward-looking view of GDP growth, enabling policymakers, investors, and businesses to anticipate future economic conditions and make informed decisions based on this information.
Apendix
Note
Last Updated: April 07, 2025