| Oct 25 | Sep 25 | Aug 25 | Jul 25 | Jun 25 | May 25 | Apr 25 | Mar 25 | Feb 25 | Jan 25 | Dec 24 | Nov 24 | |
|---|---|---|---|---|---|---|---|---|---|---|---|---|
| Leading Economic Index | ||||||||||||
| ISM New Orders | ||||||||||||
| ISM Manufacturing PMI | ||||||||||||
| S&P 500 Index |
Anticipatory Economic Indicators
Anticipatory Economic Indicators (AEIs)
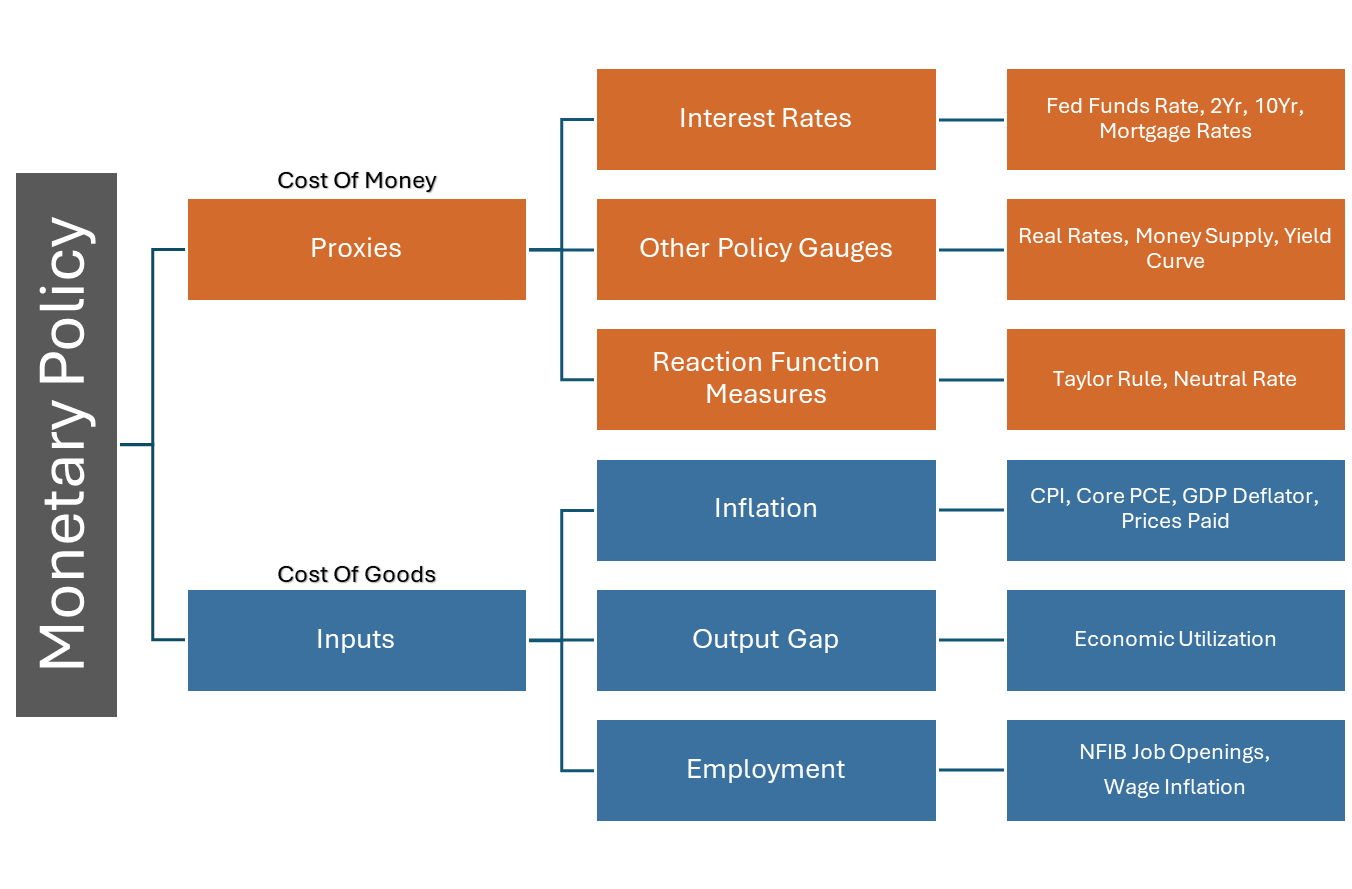
AEIs can be broken down into two main channels. On one side you have interest rates and the cost of money. On the other hand you have the cost of goods, or inflation. Both are part of the Federal Reserves Dual mandate and in turn are early indicators to the monetray policy cycle which drives the the business cycle.
AEIs are useful in determining the direction of LEIs including the market.
The main use of AEIs is to help forecast future movement in LEIs, including the S&P 500 Index. The main LEIs we watch is the soft data or ISM PMI data for both manufacturing and New orders.
Leading Economic Indicators
Lead-Lag Analysis
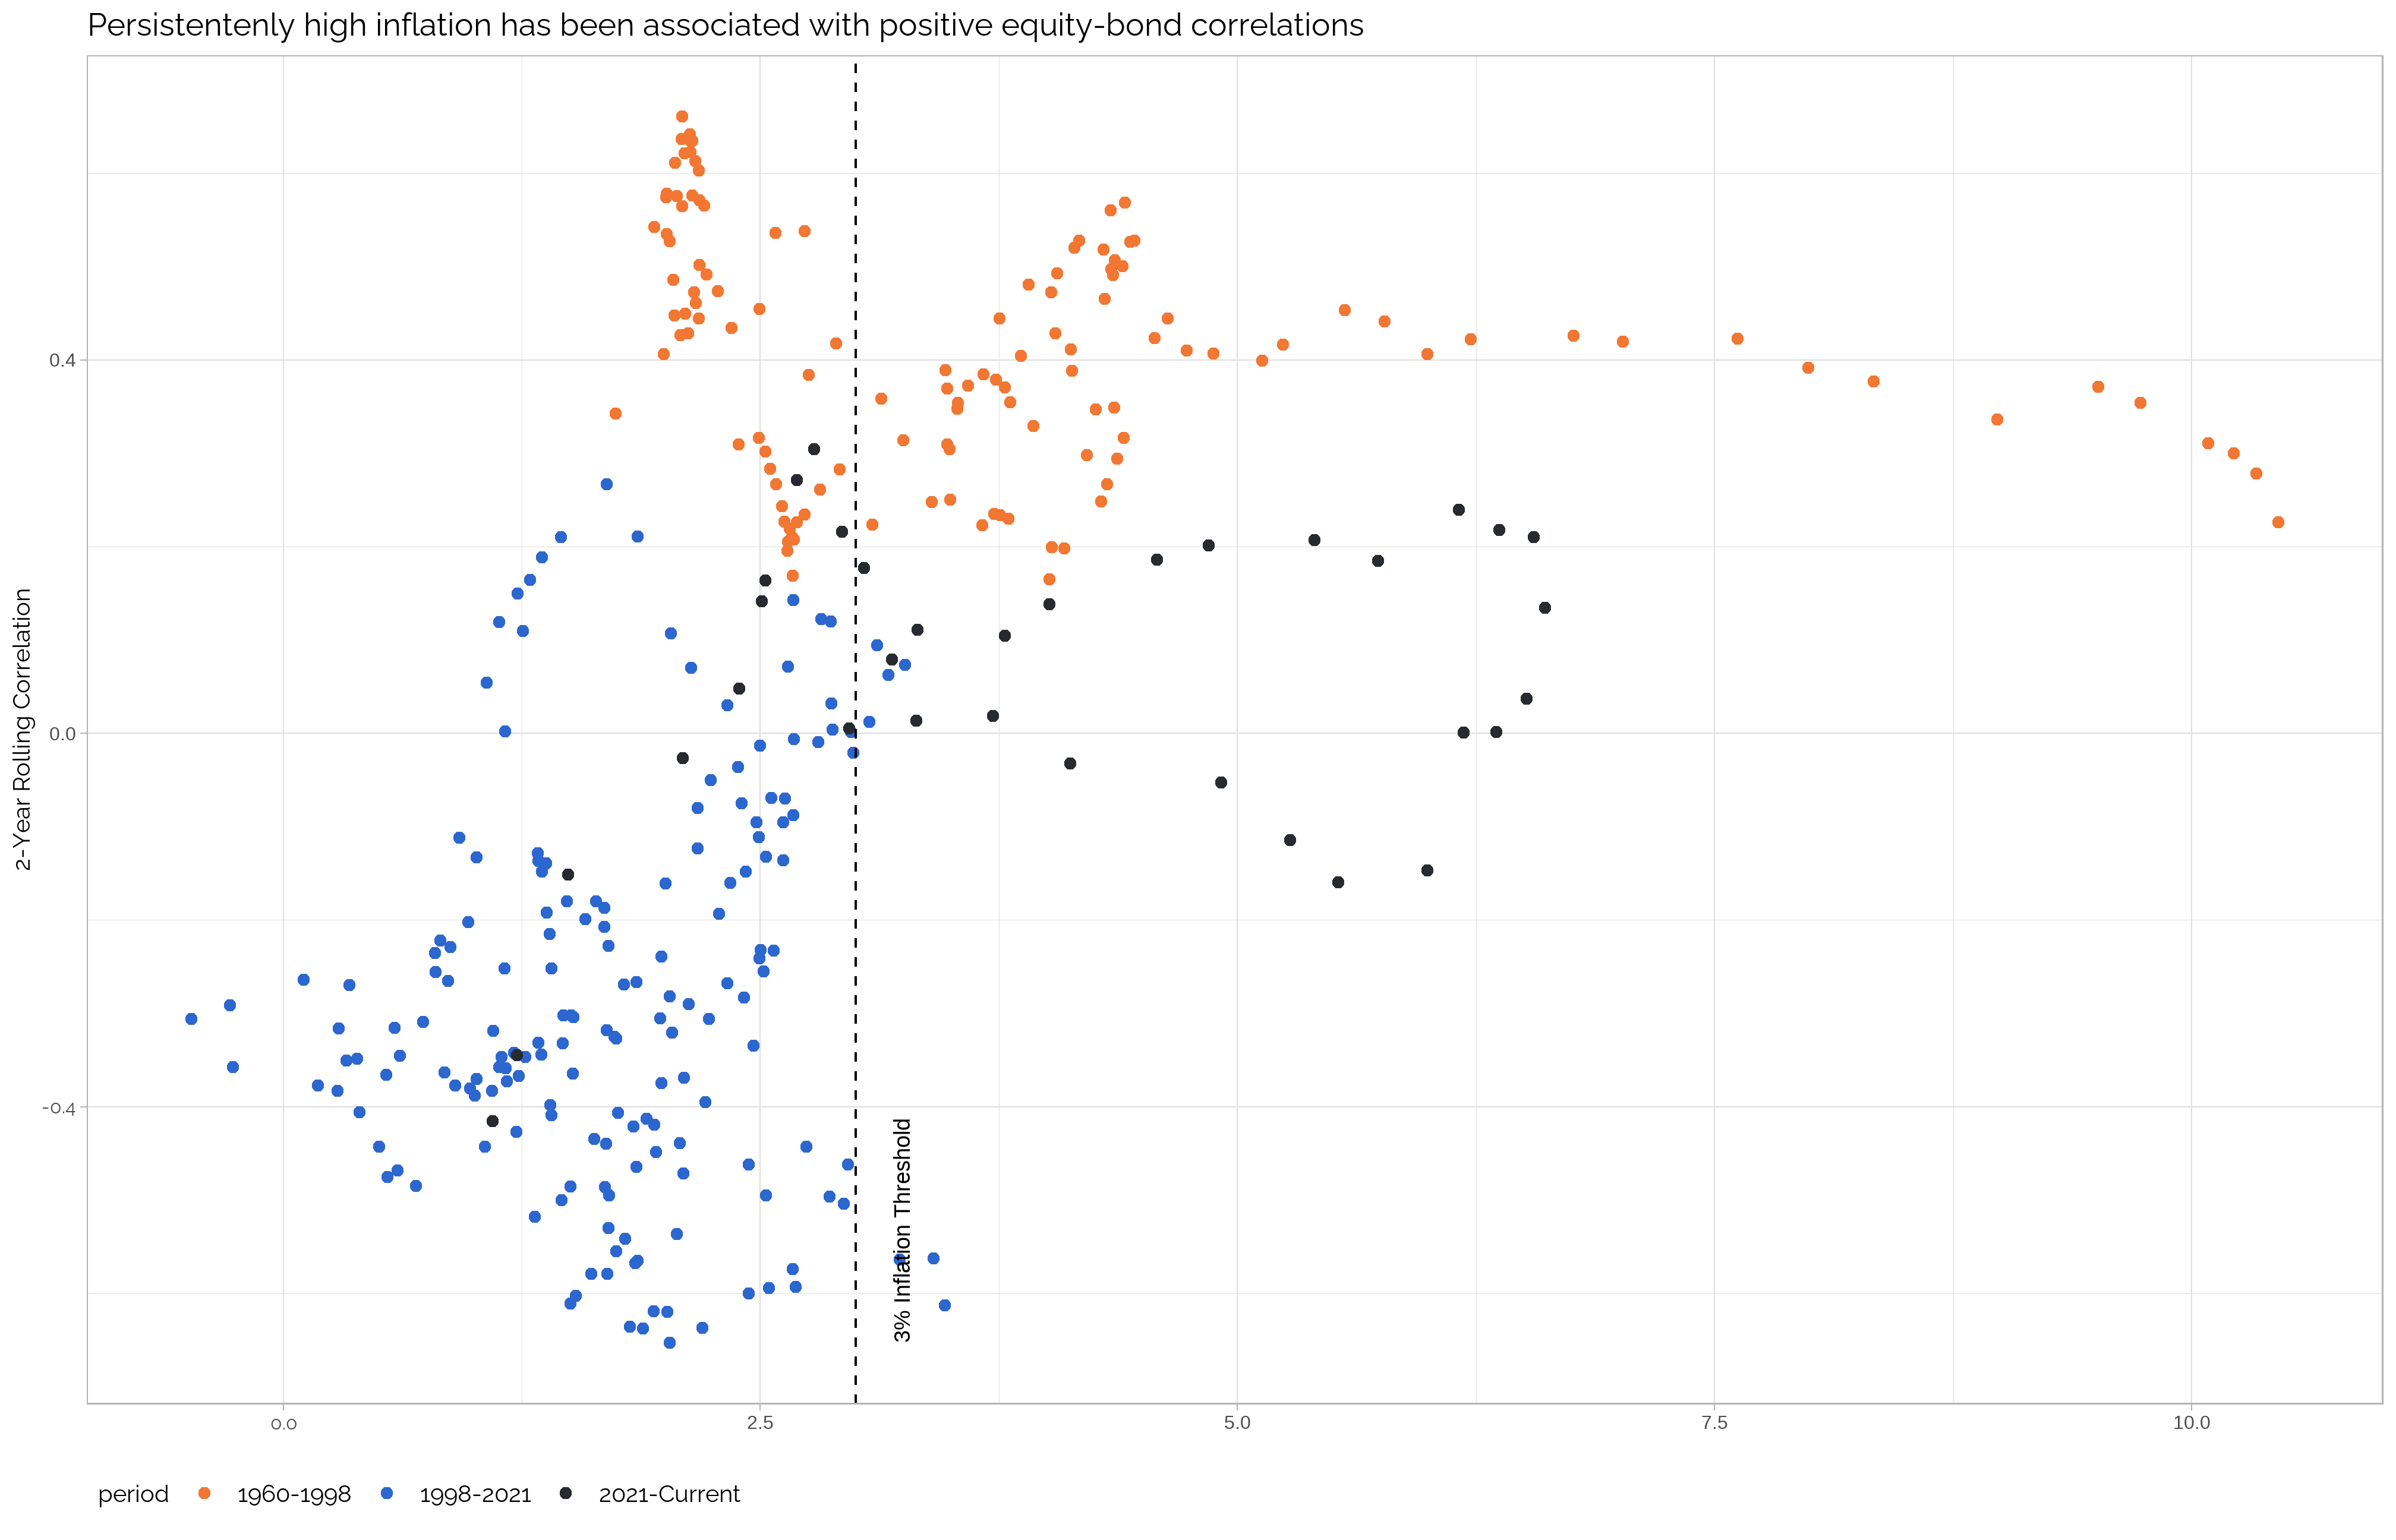
When inflation runs high, stocks and bonds tend to correlate. This relationship has an impact on the ability to forecast the economy using interest rates and a different model is needed, because the risk premium driving interest rates is the term premium (real rates) plus inflation expectation premium.
This relationship can be observed by plotting (Figure 2) the inflation and the correlation between stocks and bonds together.
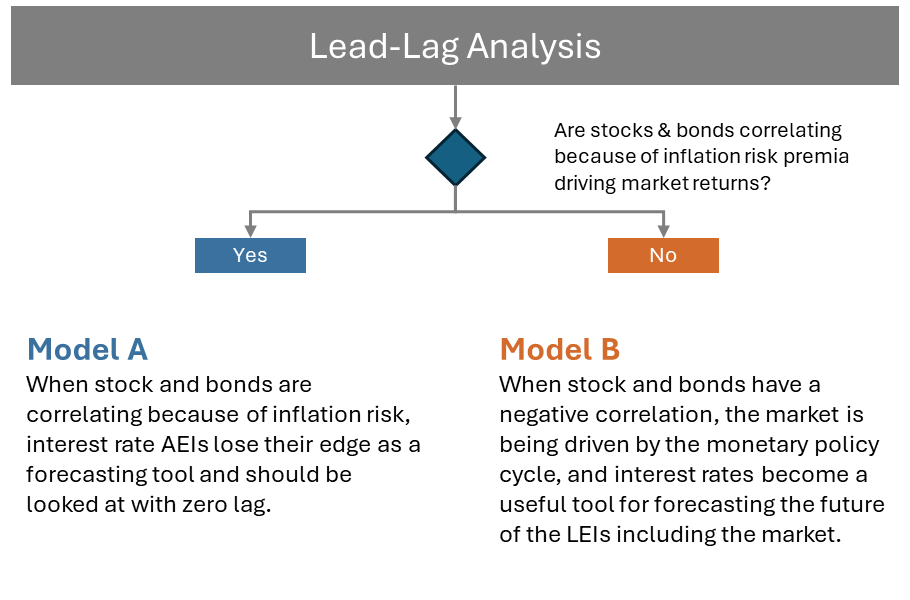
We have designed two separate models for each of the two economic regimes. The first steps to understanding the economy is to determine what economic regime we are in, and in turn decide what model to use.
We need to determine what is driving the monetary policy cycle, is it inflation risk or business cycle risk?
Model A: Cyclical Risk, If the market is more focused on the business cycle (the labor market) the yields can be a powerful tool for forecasting the future path of the business cycle and the market. In this case yields tends to lead LEIs by about 18 months.
Model B: Inflation Risk, When the market is pricing in inflation risk premium, then stocks ten to correlate with yields. This in turn breaks the leading ability of interest rates, and the model should be reactionary to yields, not anticiapotry.
Do Not Use Model A With Inflation still above 3% stocks and bonds tend to correlate, this correlation removes the anticipatory relationship between interest rates, spreads and LEIs. We are currently recommending using model B.
With inflation driving market risk, we recommend using model B, reacting to interest rates and using inflation as the forward growth potential for LEIs.


