Leading Economic Indicators
Interactive Charts
Indicies
Leading Economic Index (LEI)
Not to be confused with Leading Economic Indicators (LEIs), the Leading Economic Index (LEI)1 is a composite index that is designed to signal peaks and troughs in the business cycle. It is constructed from a variety of economic indicators that have historically shown a strong correlation with future economic activity. The LEI is widely used by economists and policymakers to gauge the health of the economy and to anticipate changes in economic conditions.
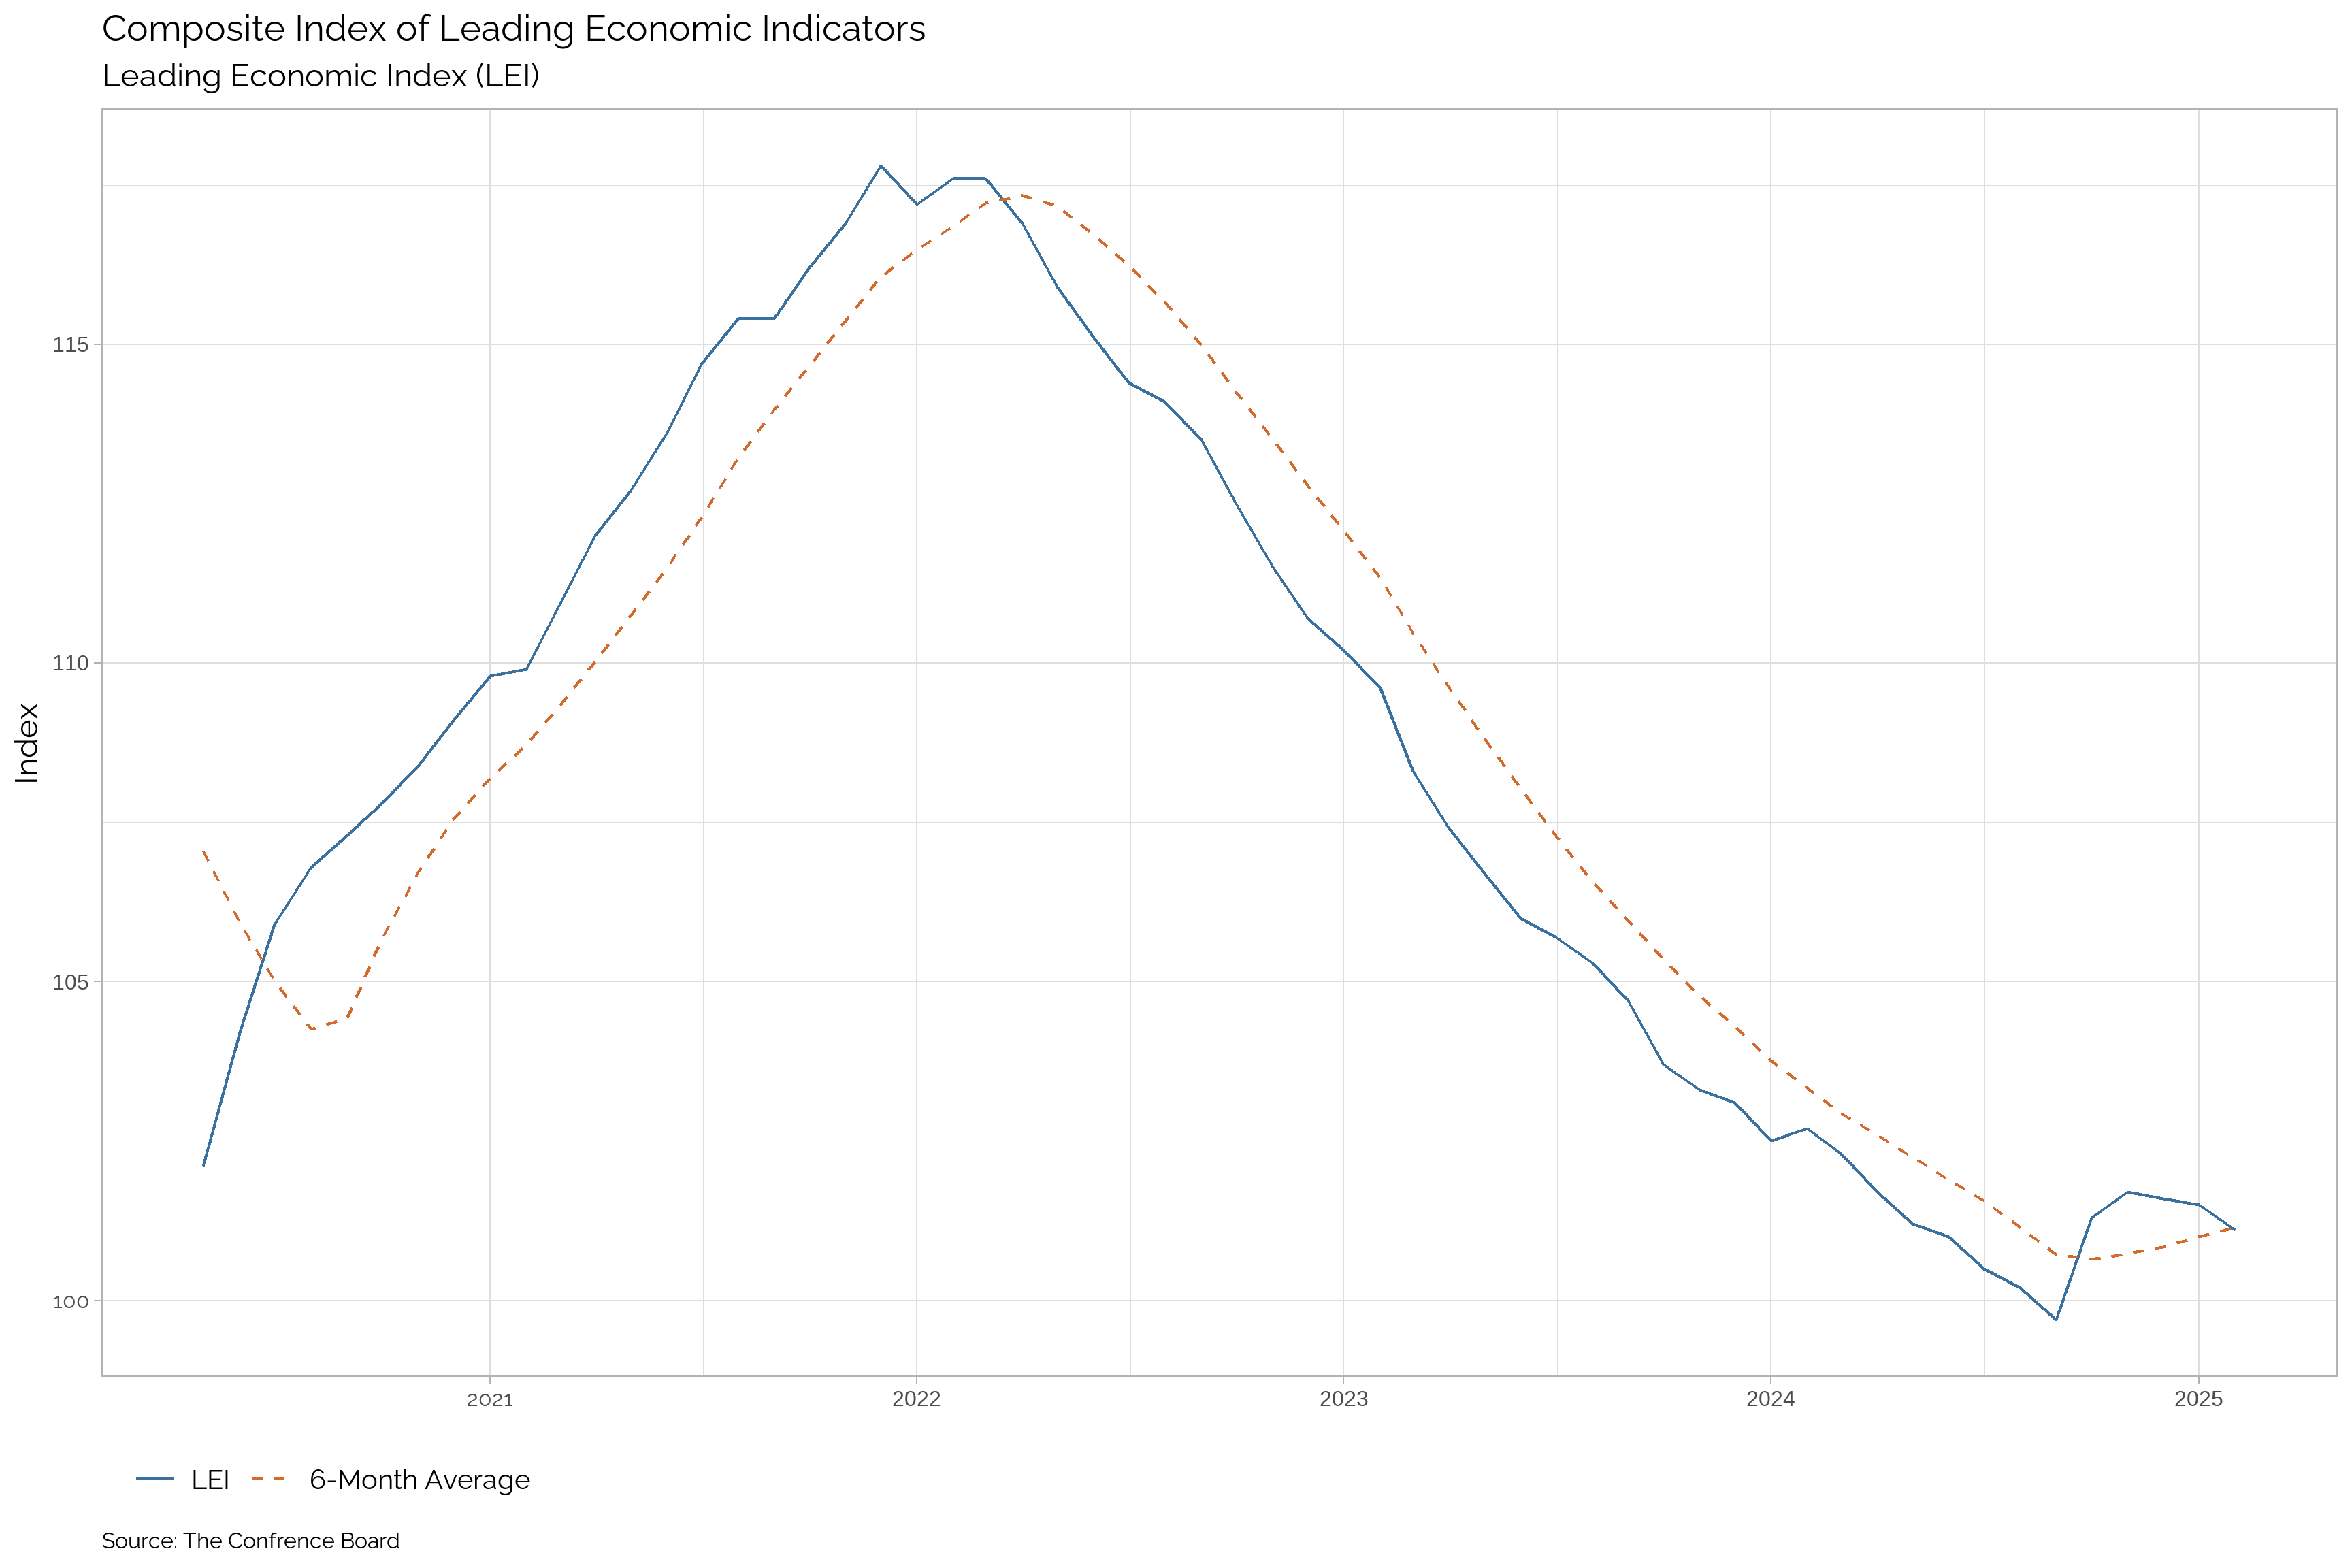
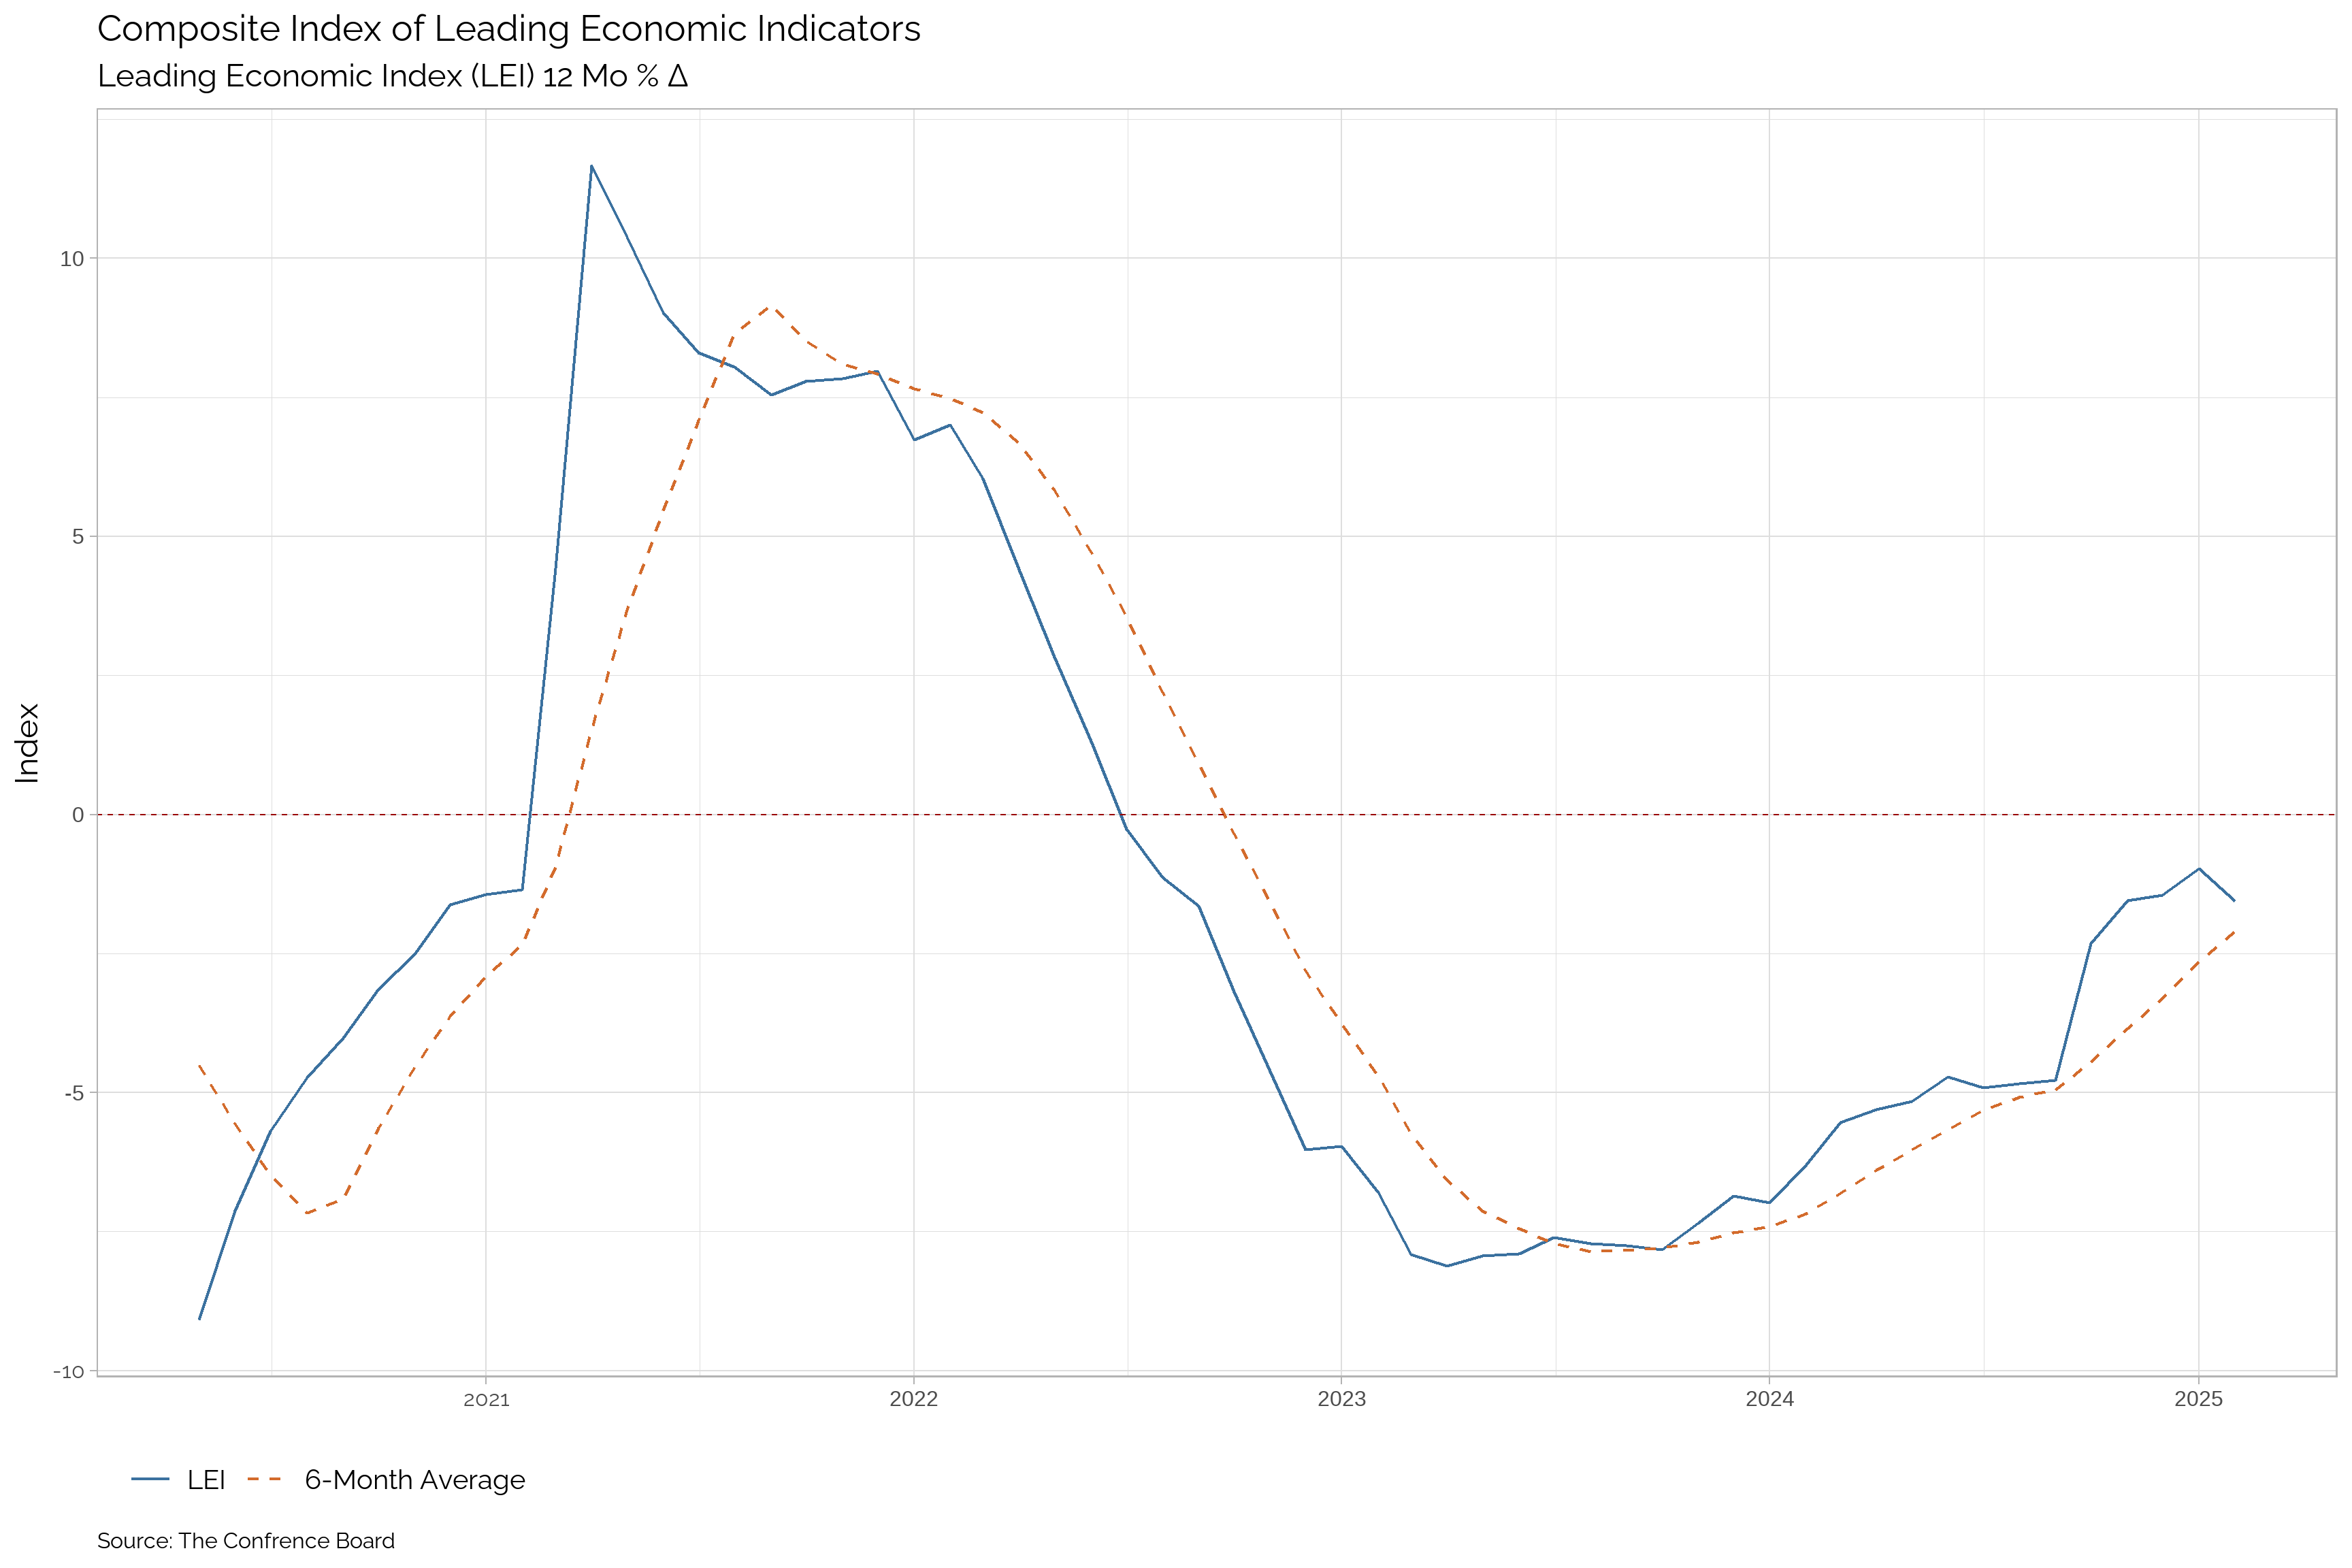
| Apr-25 | Mar-25 | Feb-25 | Jan-25 | Dec-24 | Nov-24 | Oct-24 | Sep-24 | Aug-24 | Jul-24 | Jun-24 | May-24 | |
|---|---|---|---|---|---|---|---|---|---|---|---|---|
| LEI | -- | -- | 101.1 | 101.5 | 101.6 | 101.7 | 101.3 | 99.7 | 100.2 | 100.5 | 101 | 101.2 |
| Δ Change | -- | -- | -0.4 | -0.1 | -0.1 | 0.4 | 1.6 | -0.5 | -0.3 | -0.5 | -0.2 | -0.5 |
| Percent Δ Change | -- | -- | -0.39 | -0.1 | -0.1 | 0.39 | 1.6 | -0.5 | -0.3 | -0.5 | -0.2 | -0.49 |
| Yr/Yr Growth Rate | -- | -- | -1.56 | -0.98 | -1.45 | -1.55 | -2.31 | -4.78 | -4.84 | -4.92 | -4.72 | -5.15 |
| Trend | -- | -- | Down | Up | Up | Up | Up | Down | Down | Down | Down | Down |
| Trend in Growth Rate | -- | -- | Up | Up | Up | Up | Up | Up | Up | Up | Up | Up |
Market Data
The S&P 500 Index
The S&P 500 Index2 is a market-capitalization-weighted index of the 500 largest publicly traded companies in the U.S. It is widely regarded as the best single gauge of large-cap U.S. equities. The index includes companies from all sectors of the economy and is considered a bellwether for the overall health of the U.S. stock market.
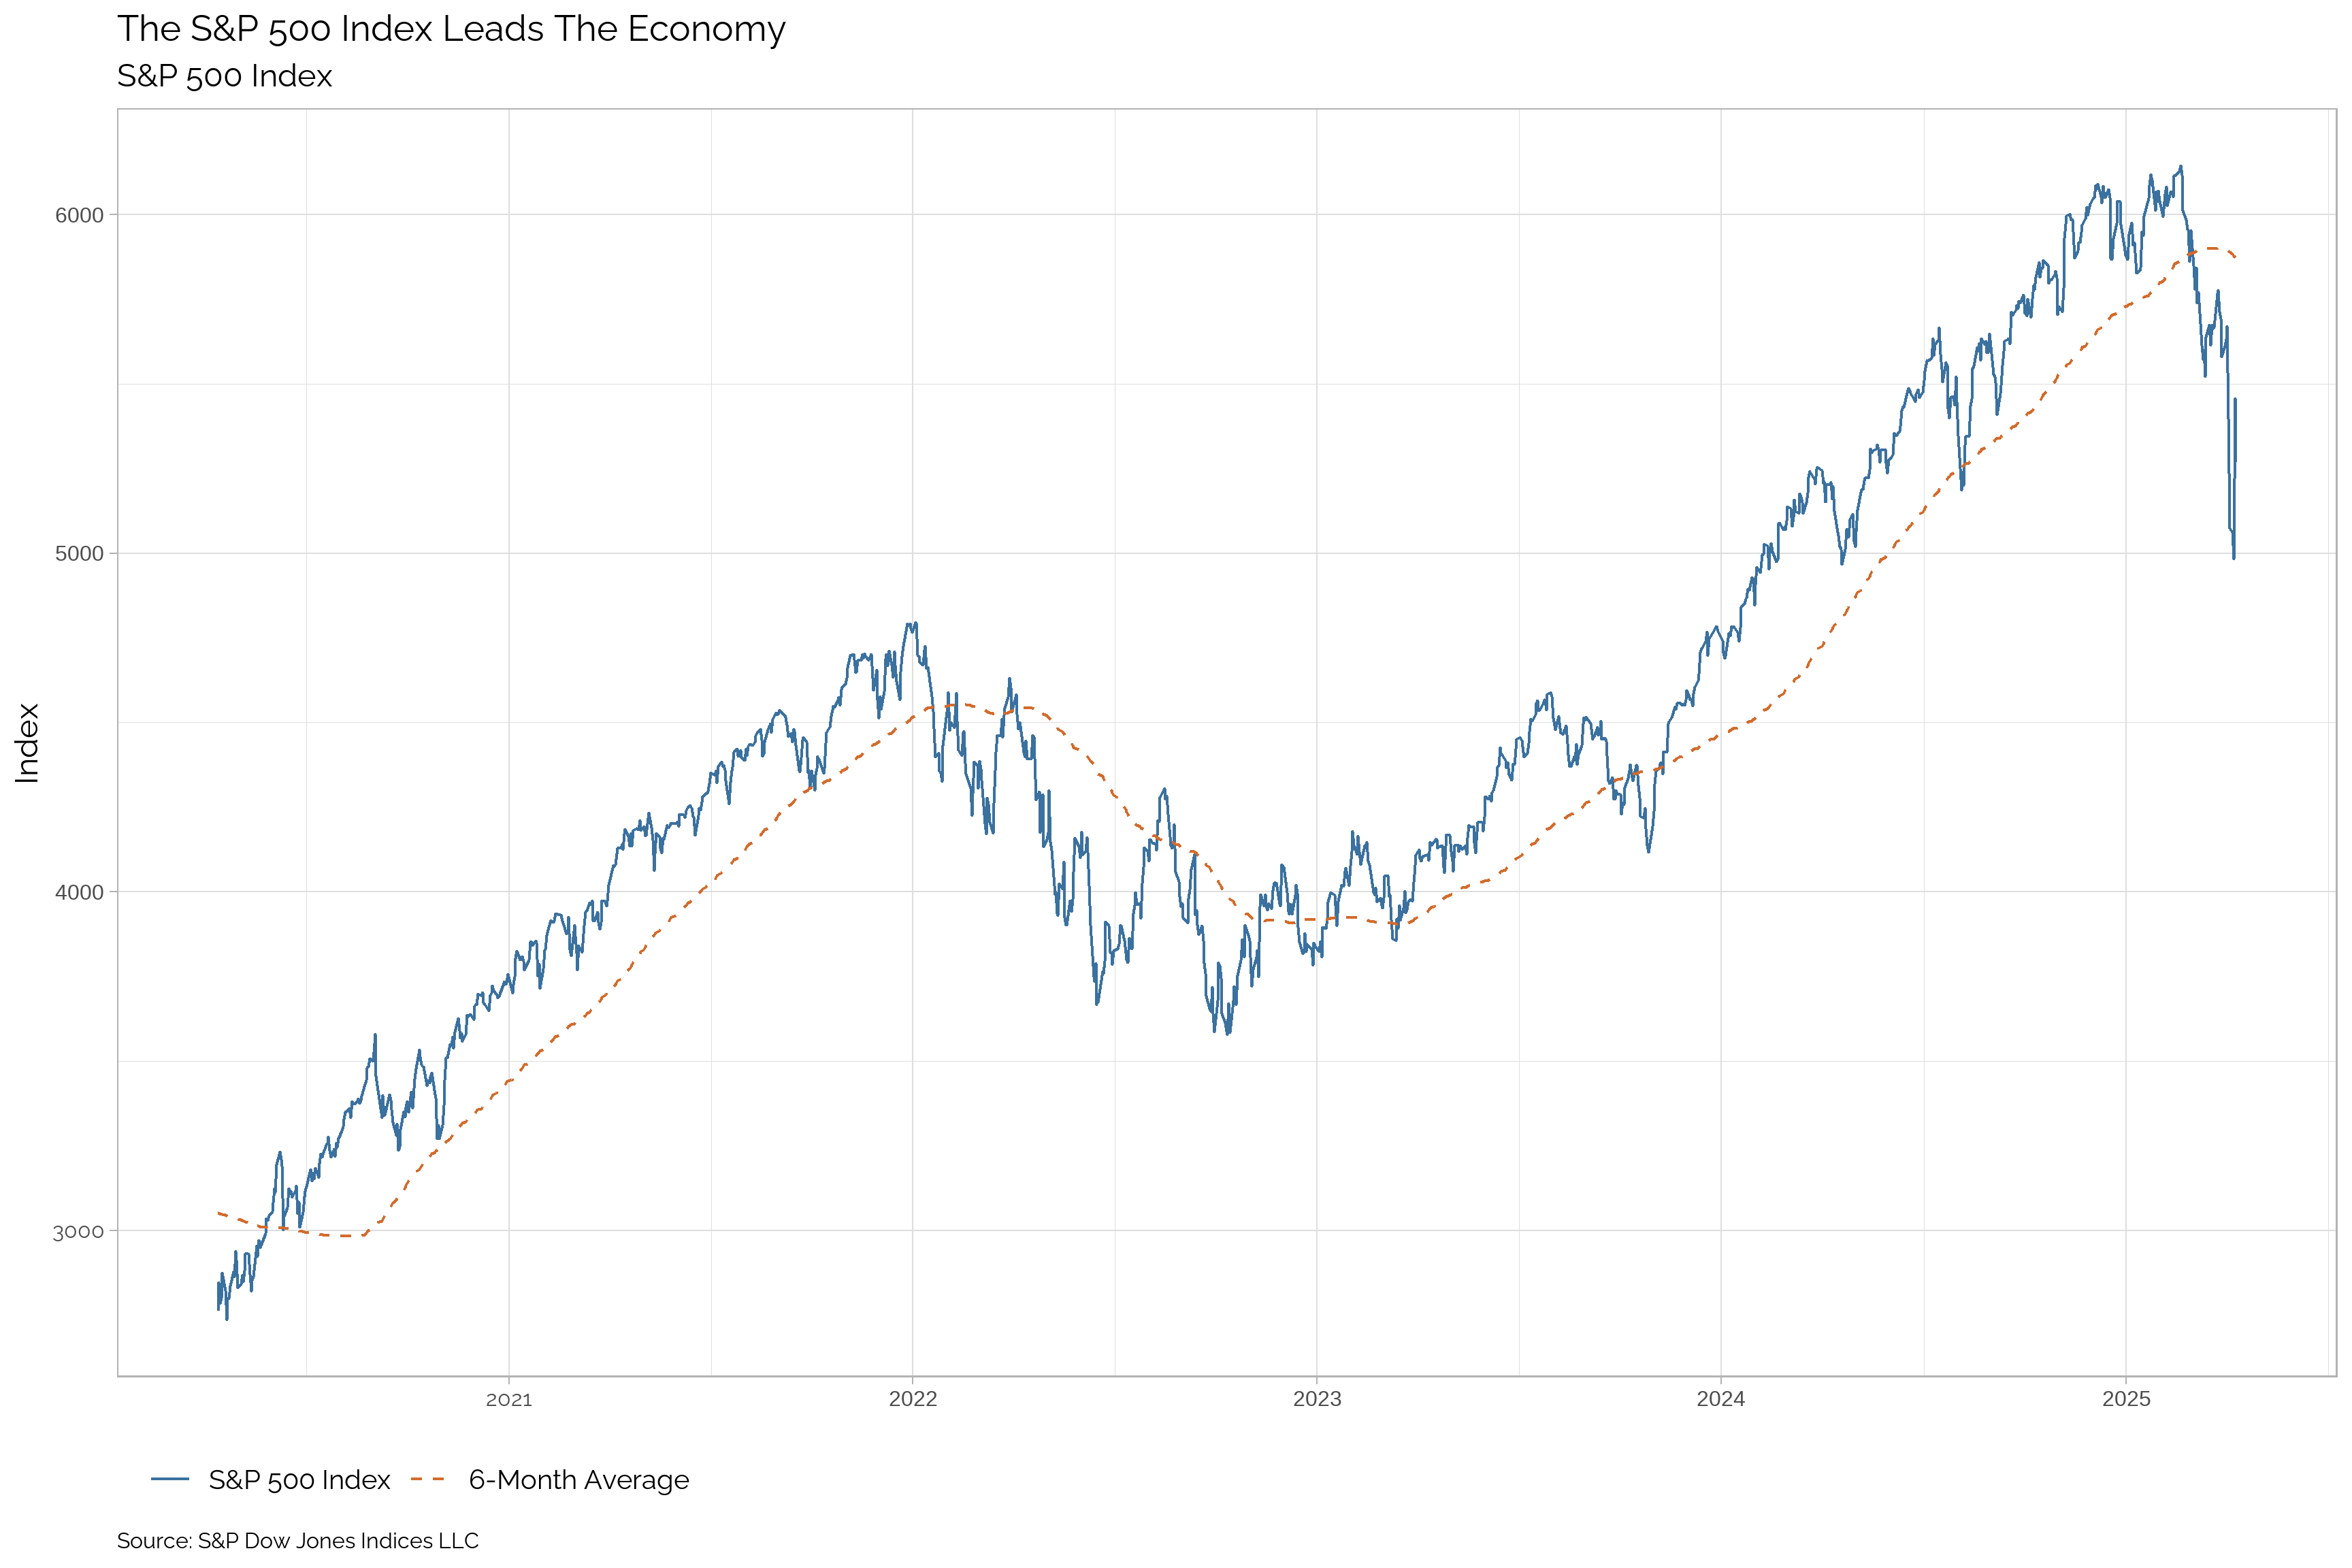
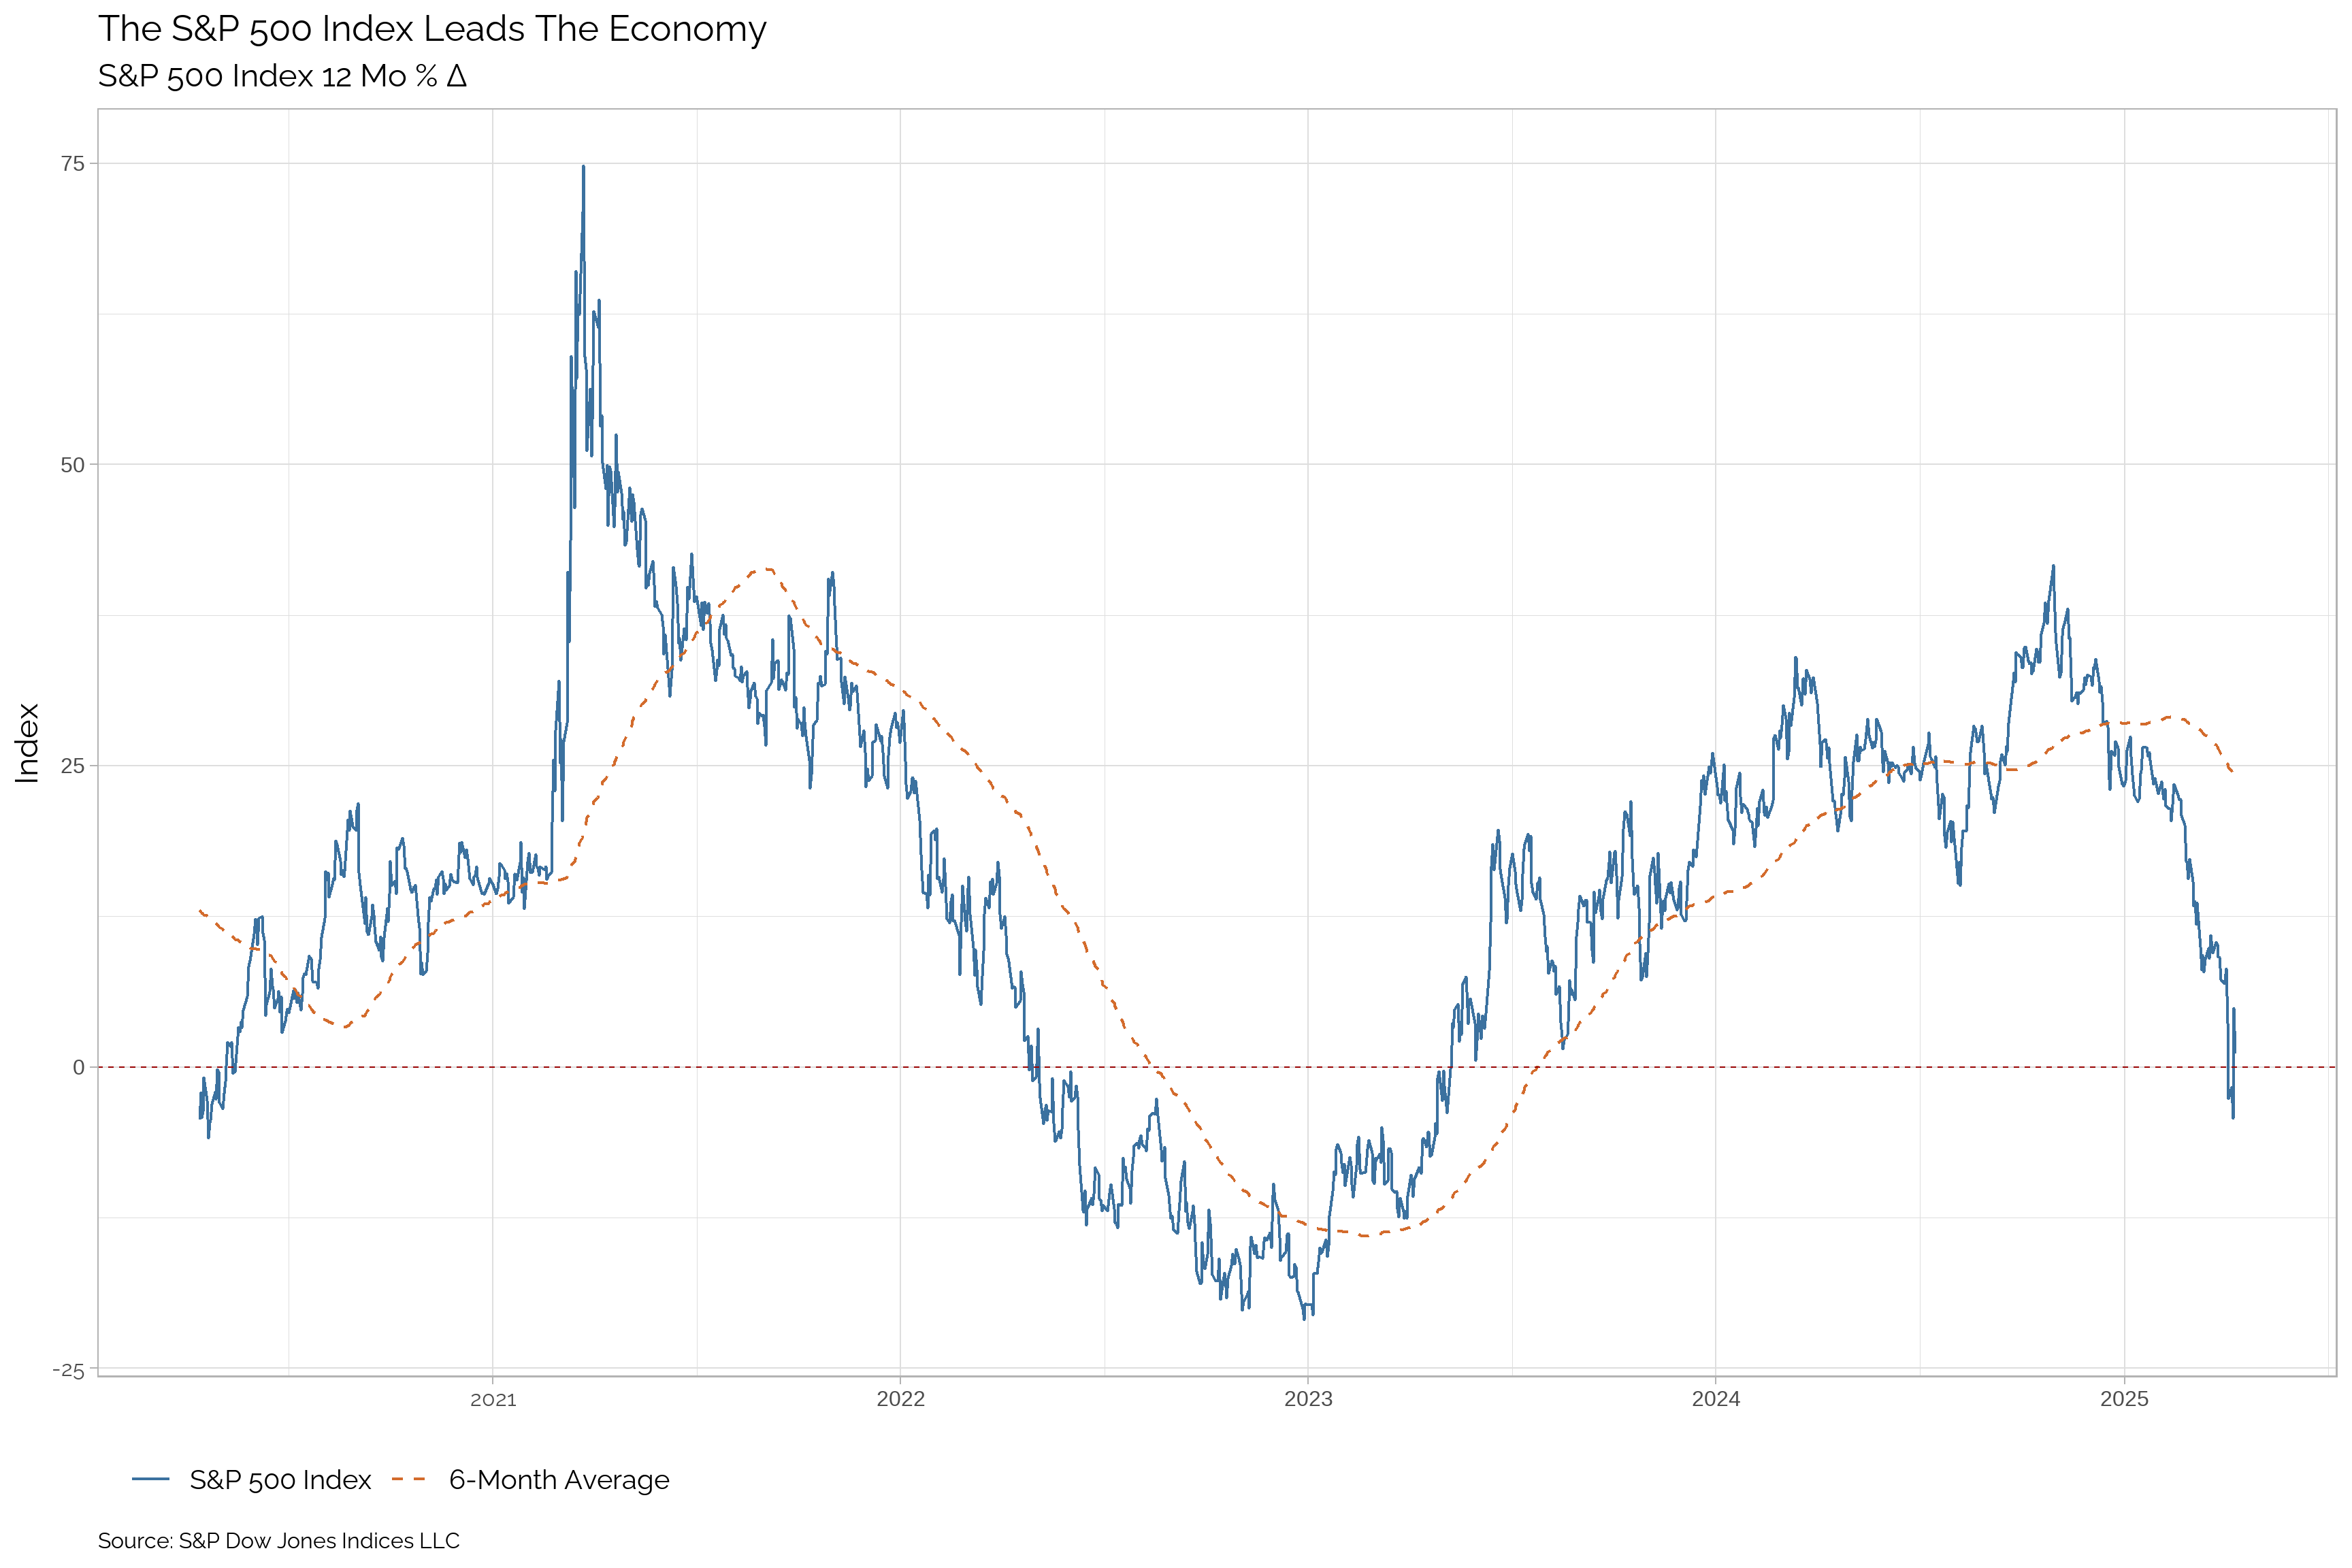
| Apr-25 | Mar-25 | Feb-25 | Jan-25 | Dec-24 | Nov-24 | Oct-24 | Sep-24 | Aug-24 | Jul-24 | Jun-24 | May-24 | |
|---|---|---|---|---|---|---|---|---|---|---|---|---|
| S&P 500 Index | 5074.08 | 5611.85 | 5954.5 | 6040.53 | 5881.63 | 6032.38 | 5705.45 | 5762.48 | 5648.4 | 5522.3 | 5460.48 | 5277.51 |
| Δ Change | -537.77 | -342.65 | -86.03 | 158.9 | -150.75 | 326.93 | -57.03 | 114.08 | 126.1 | 61.82 | 182.97 | 241.82 |
| Percent Δ Change | -9.58 | -5.75 | -1.42 | 2.7 | -2.5 | 5.73 | -0.99 | 2.02 | 2.28 | 1.13 | 3.47 | 4.8 |
| Yr/Yr Growth Rate | -2.64 | 6.92 | 17.26 | 22.65 | 23.31 | 32.56 | 36.04 | 34.02 | 25.11 | 20.34 | 24.76 | 26.26 |
| Trend | Down | Down | Up | Up | Up | Up | Up | Up | Up | Up | Up | Up |
| Trend in Growth Rate | Down | Down | Down | Down | Down | Up | Up | Up | Down | Down | Down | Up |
High Yield Credit Spreads
ICE publish a option adjusted spread on CCC rated bonds is a measure of the risk premium investors demand to hold these bonds over the risk-free rate. It is a key indicator of the health of the high yield bond market and the broader economy.
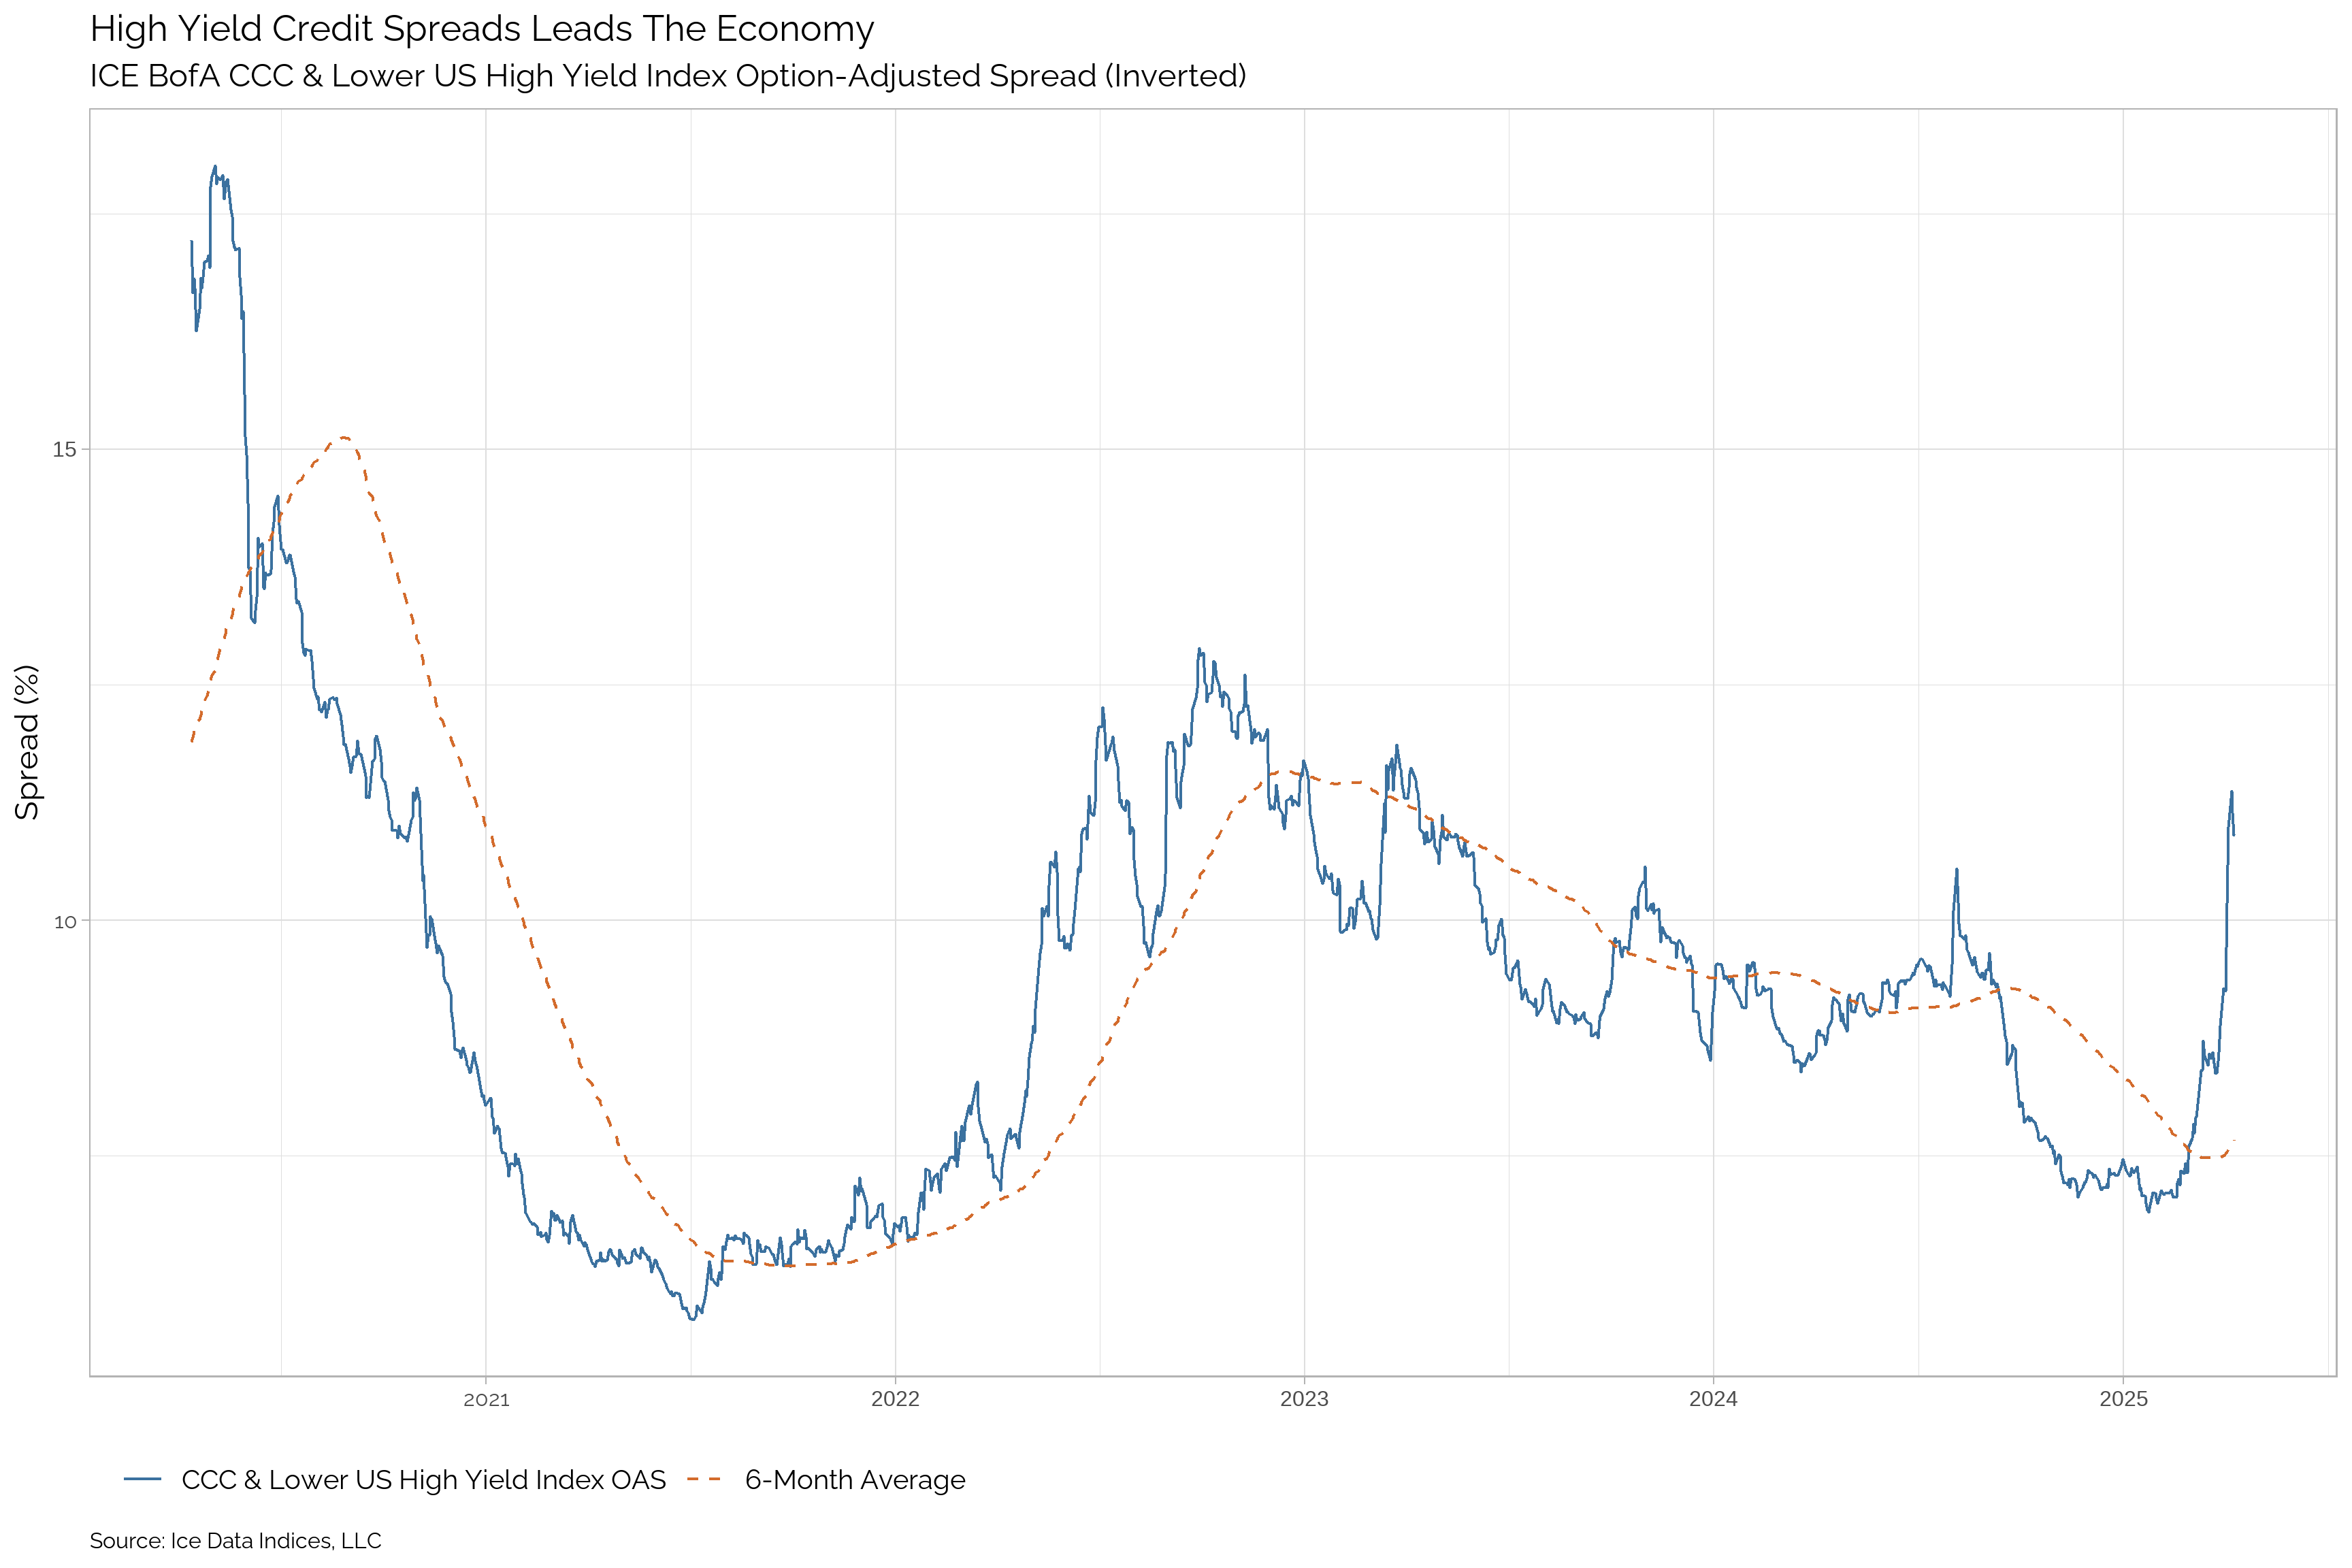
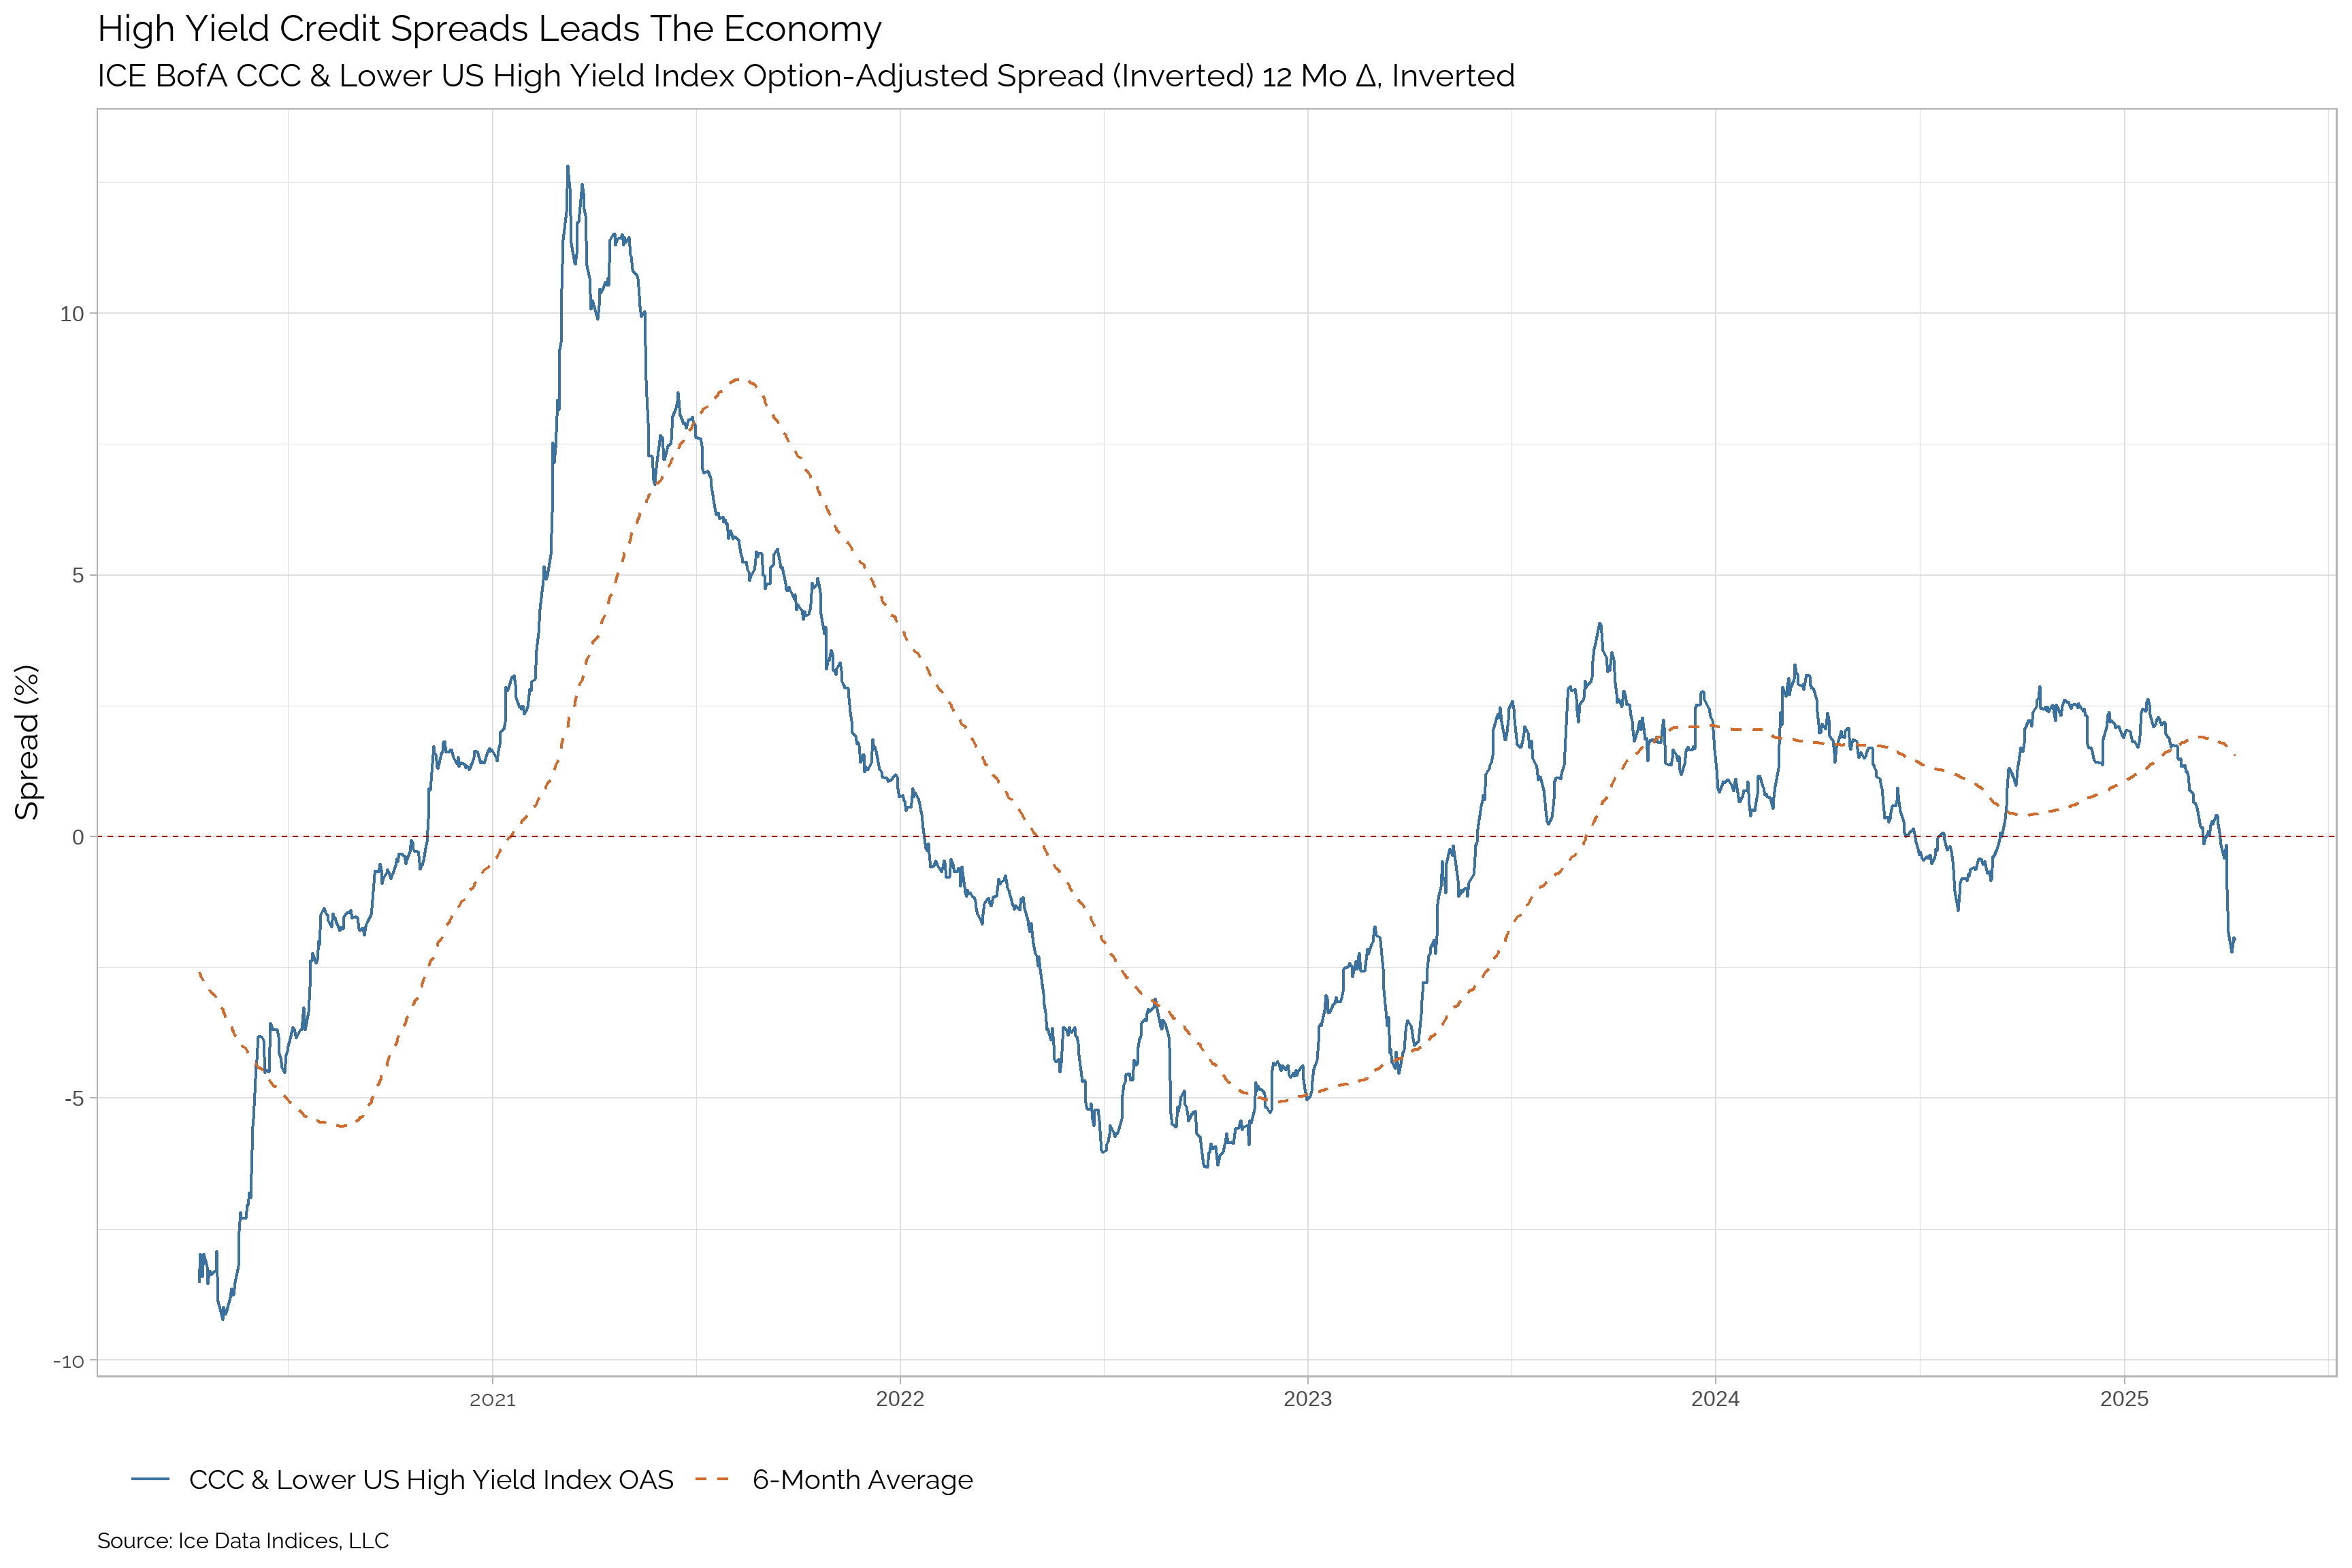
| Apr-25 | Mar-25 | Feb-25 | Jan-25 | Dec-24 | Nov-24 | Oct-24 | Sep-24 | Aug-24 | Jul-24 | Jun-24 | May-24 | |
|---|---|---|---|---|---|---|---|---|---|---|---|---|
| CCC & Lower US High Yield Index OAS | 10.99 | 9.28 | 7.6 | 6.99 | 7.46 | 7.35 | 7.56 | 8.02 | 9.47 | 9.42 | 9.53 | 9.34 |
| Δ Change | 1.71 | 1.68 | 0.61 | -0.47 | 0.11 | -0.21 | -0.46 | -1.45 | 0.05 | -0.11 | 0.19 | 0.18 |
| Percent Δ Change | 18.43 | 22.11 | 8.73 | -6.3 | 1.5 | -2.78 | -5.74 | -15.31 | 0.53 | -1.15 | 2.03 | 1.97 |
| Yr/Yr Δ Inverted | -1.83 | -0.42 | 0.89 | 2.29 | 1.88 | 1.69 | 2.21 | 1.7 | -0.7 | -0.47 | -0.24 | 0.35 |
| Trend | Up | Up | Up | Down | Down | Down | Down | Down | Up | Up | Up | Up |
| Trend in Δ Inverted | Down | Down | Down | Up | Up | Up | Up | Up | Down | Down | Down | Down |
Soft Data
ISM New Orders
ISM New Orders3 is a key leading indicator of economic activity in the U.S. economy. It is a component of the Institute for Supply Management’s (ISM) Manufacturing Report on Business, which is based on a survey of purchasing managers at more than 300 manufacturing firms. The New Orders Index is a forward-looking indicator that provides insight into future production levels and overall economic activity.
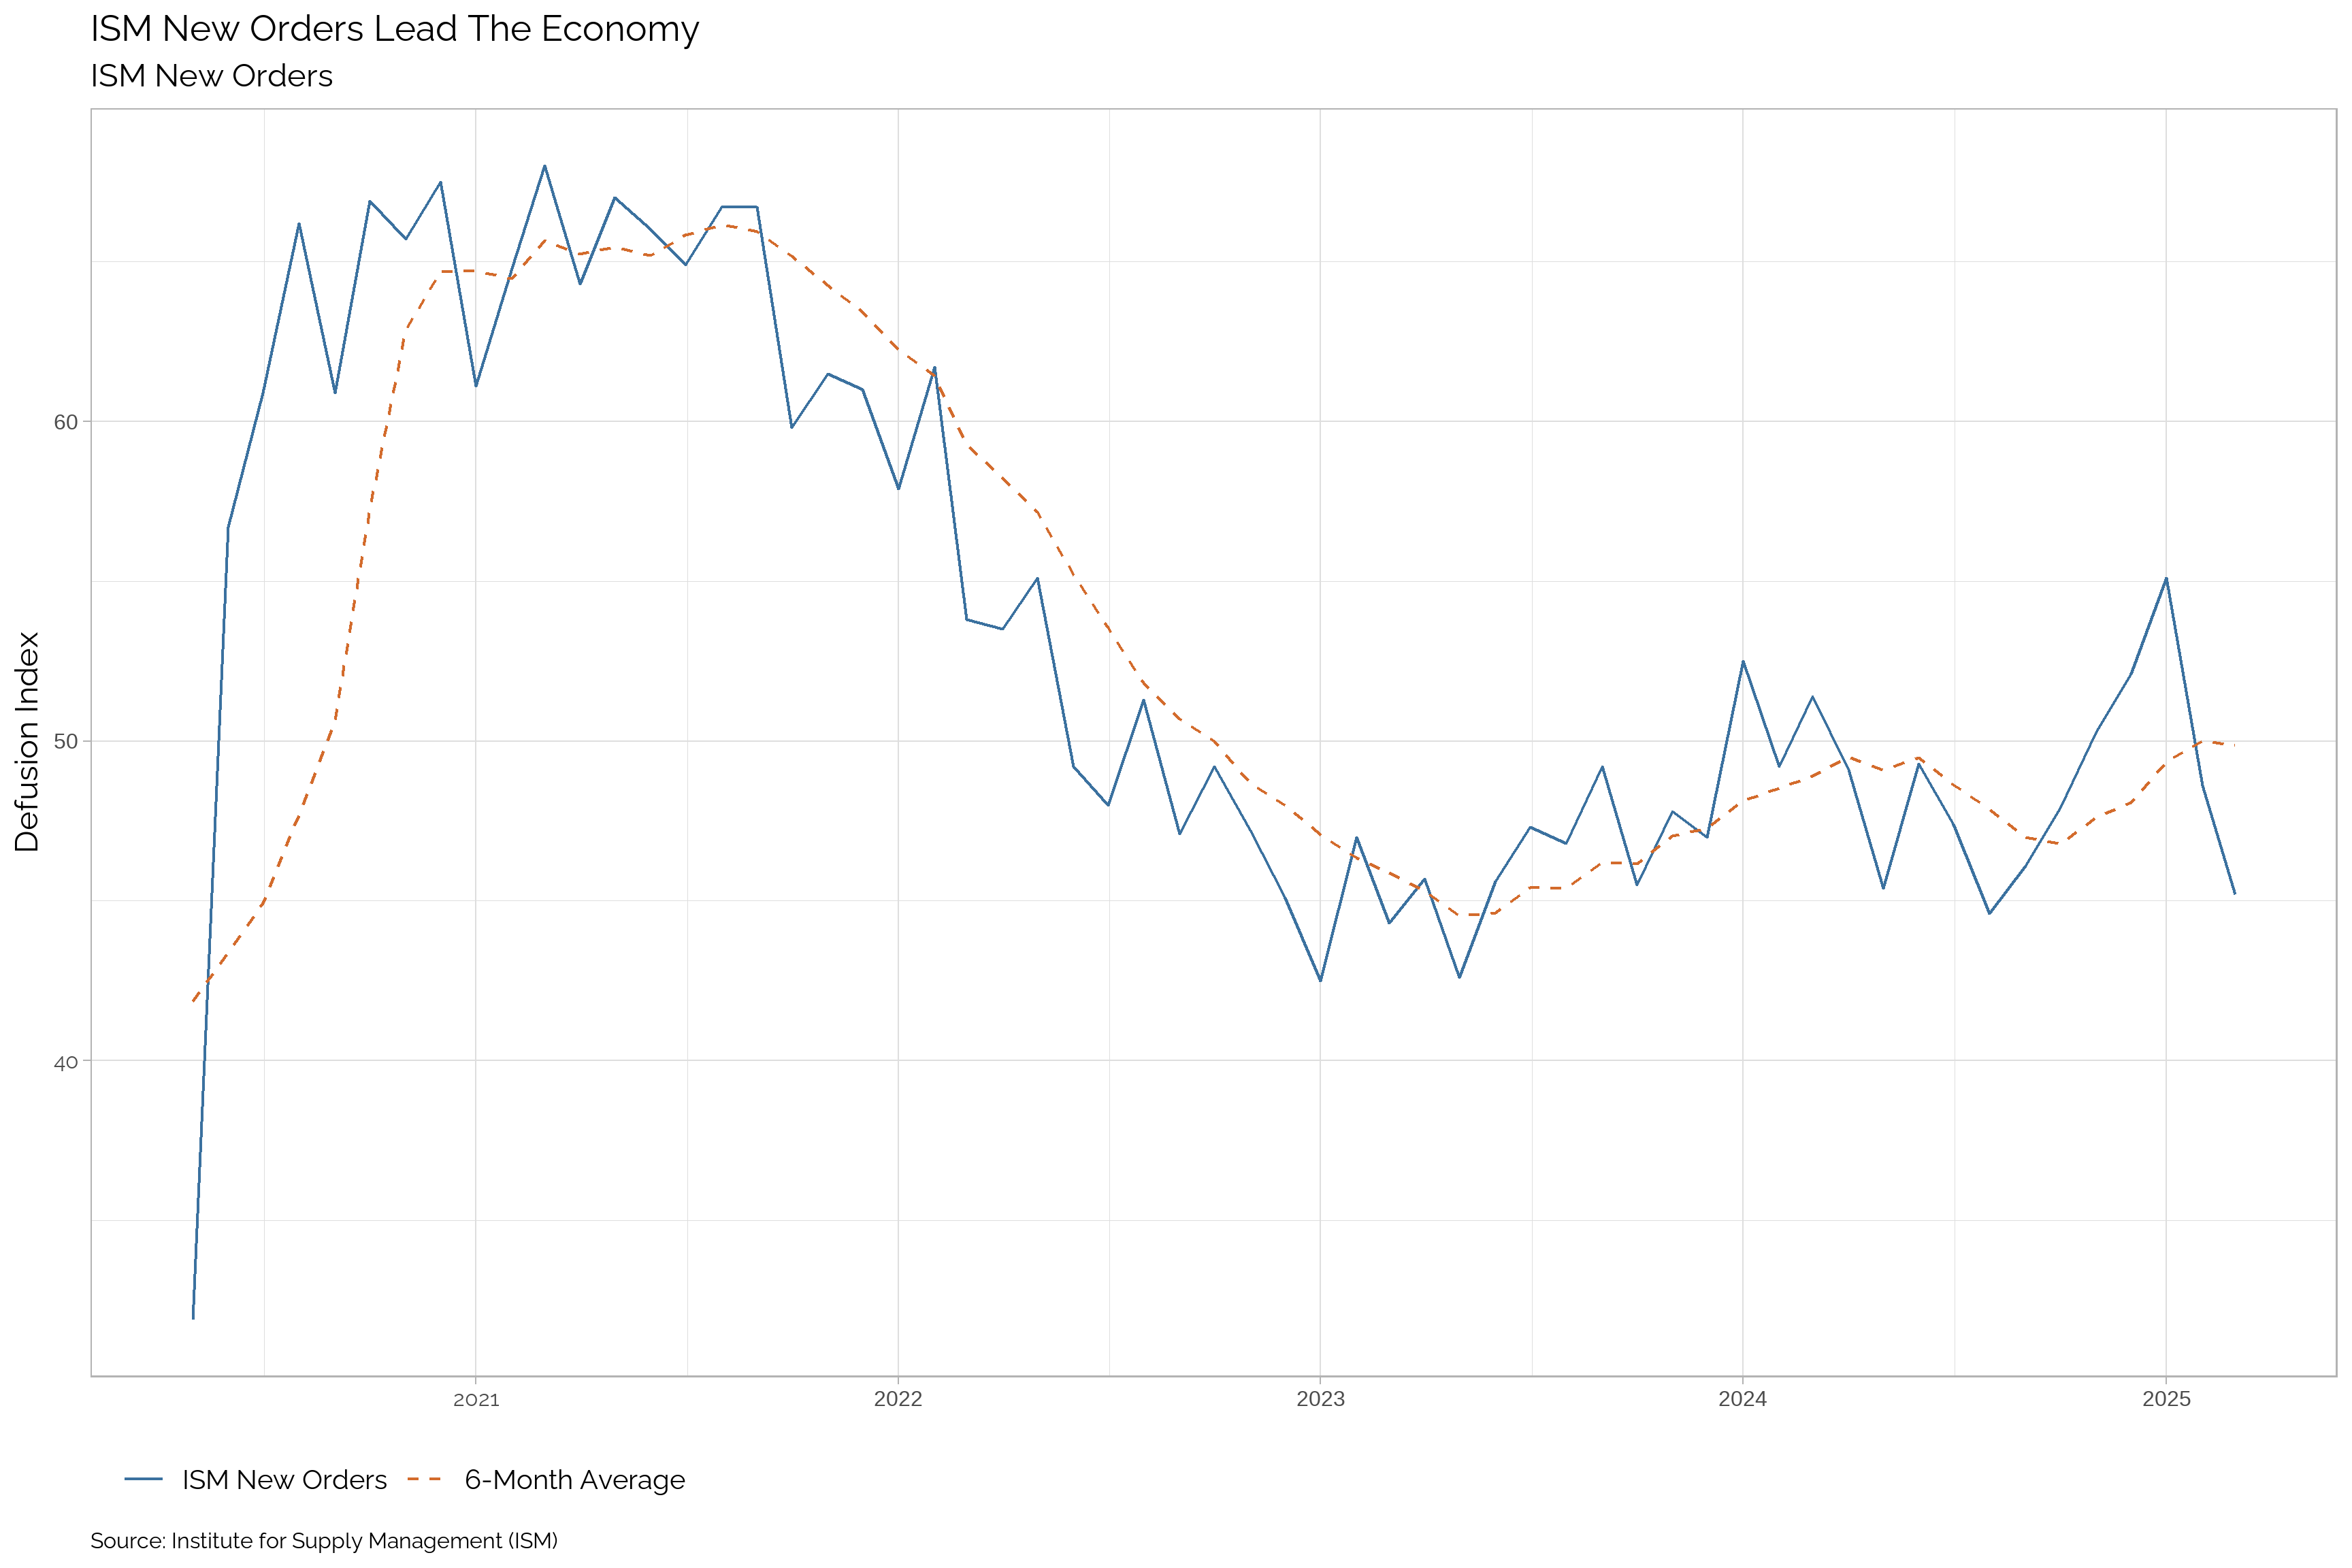
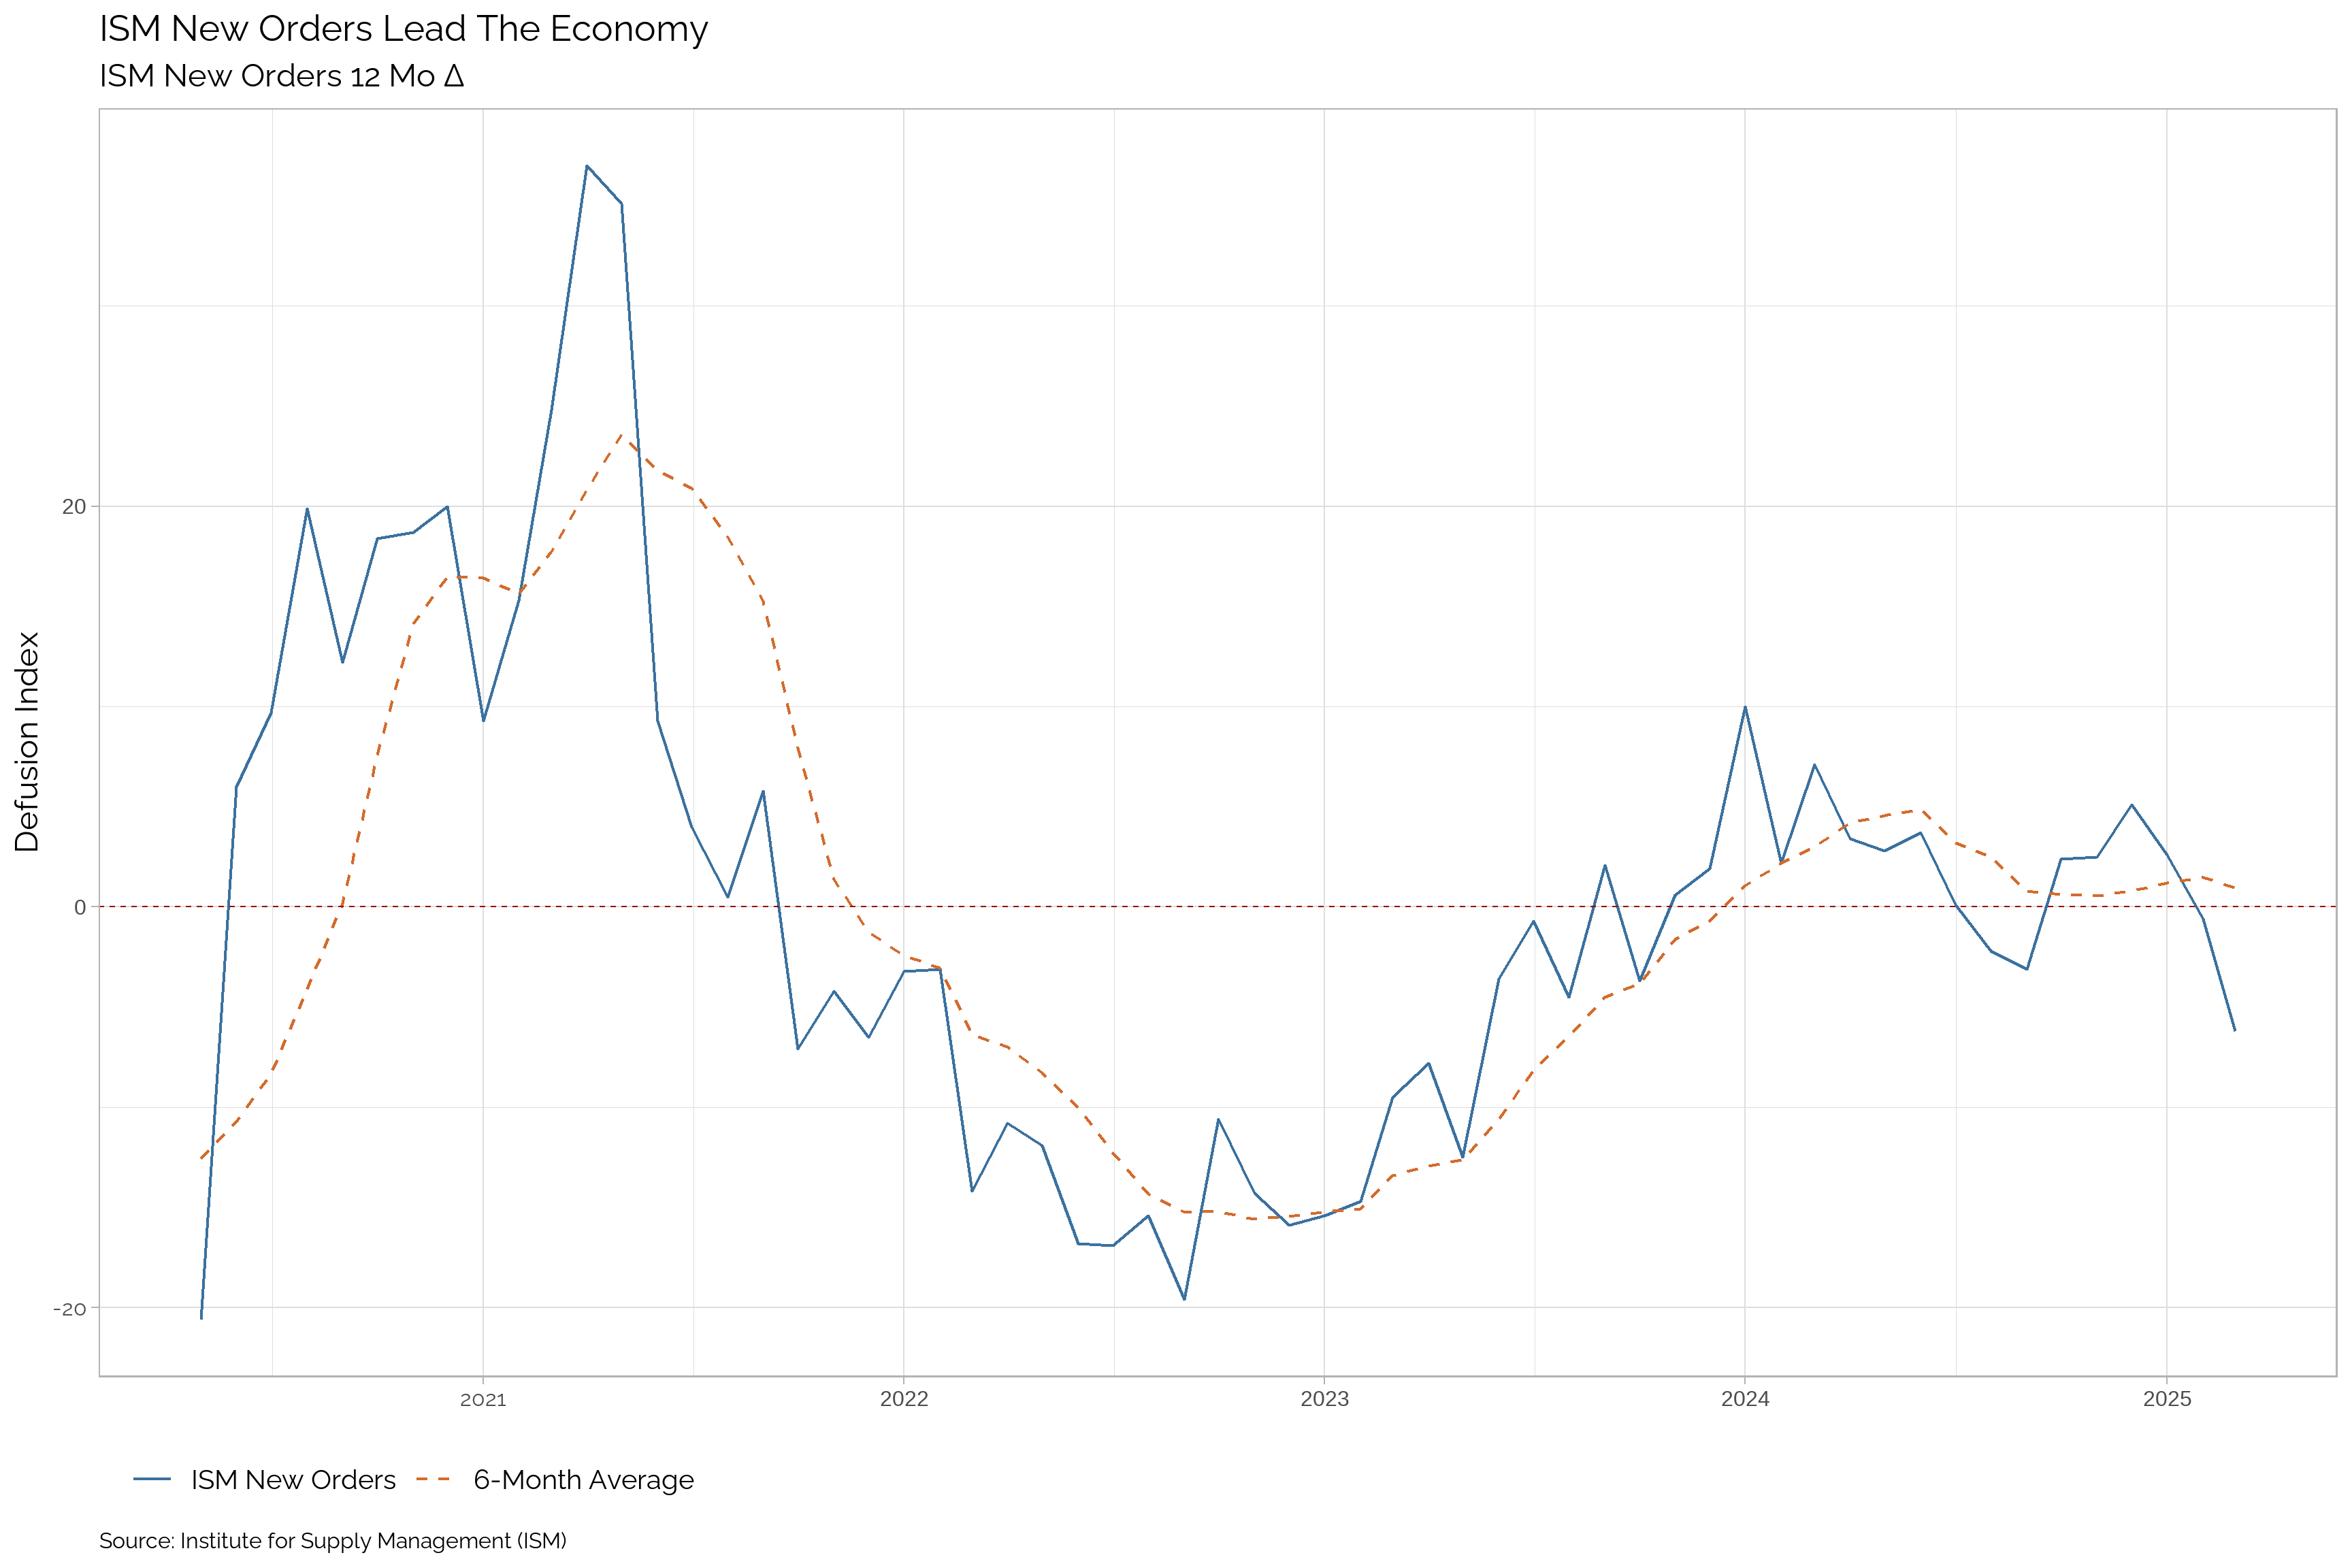
| Apr-25 | Mar-25 | Feb-25 | Jan-25 | Dec-24 | Nov-24 | Oct-24 | Sep-24 | Aug-24 | Jul-24 | Jun-24 | May-24 | |
|---|---|---|---|---|---|---|---|---|---|---|---|---|
| ISM New Orders | -- | 45.2 | 48.6 | 55.1 | 52.1 | 50.3 | 47.9 | 46.1 | 44.6 | 47.4 | 49.3 | 45.4 |
| Δ Change | -- | -3.4 | -6.5 | 3 | 1.8 | 2.4 | 1.8 | 1.5 | -2.8 | -1.9 | 3.9 | -3.7 |
| Percent Δ Change | -- | -7 | -11.8 | 5.76 | 3.58 | 5.01 | 3.9 | 3.36 | -5.91 | -3.85 | 8.59 | -7.54 |
| Yr/Yr Change | -- | -6.2 | -0.6 | 2.6 | 5.1 | 2.5 | 2.4 | -3.1 | -2.2 | 0.1 | 3.7 | 2.8 |
| Trend | -- | Down | Down | Up | Up | Up | Up | Down | Down | Down | Down | Down |
| Trend in Growth Rate | -- | Down | Down | Up | Up | Up | Up | Down | Down | Down | Down | Down |
ISM Manufacturing PMI
The ISM Manufacturing PMI4 is a key leading indicator of economic activity in the U.S. economy. It is a component of the Institute for Supply Management’s (ISM) Manufacturing Report on Business, which is based on a survey of purchasing managers at more than 300 manufacturing firms. The PMI is a forward-looking indicator that provides insight into future production levels and overall economic activity.
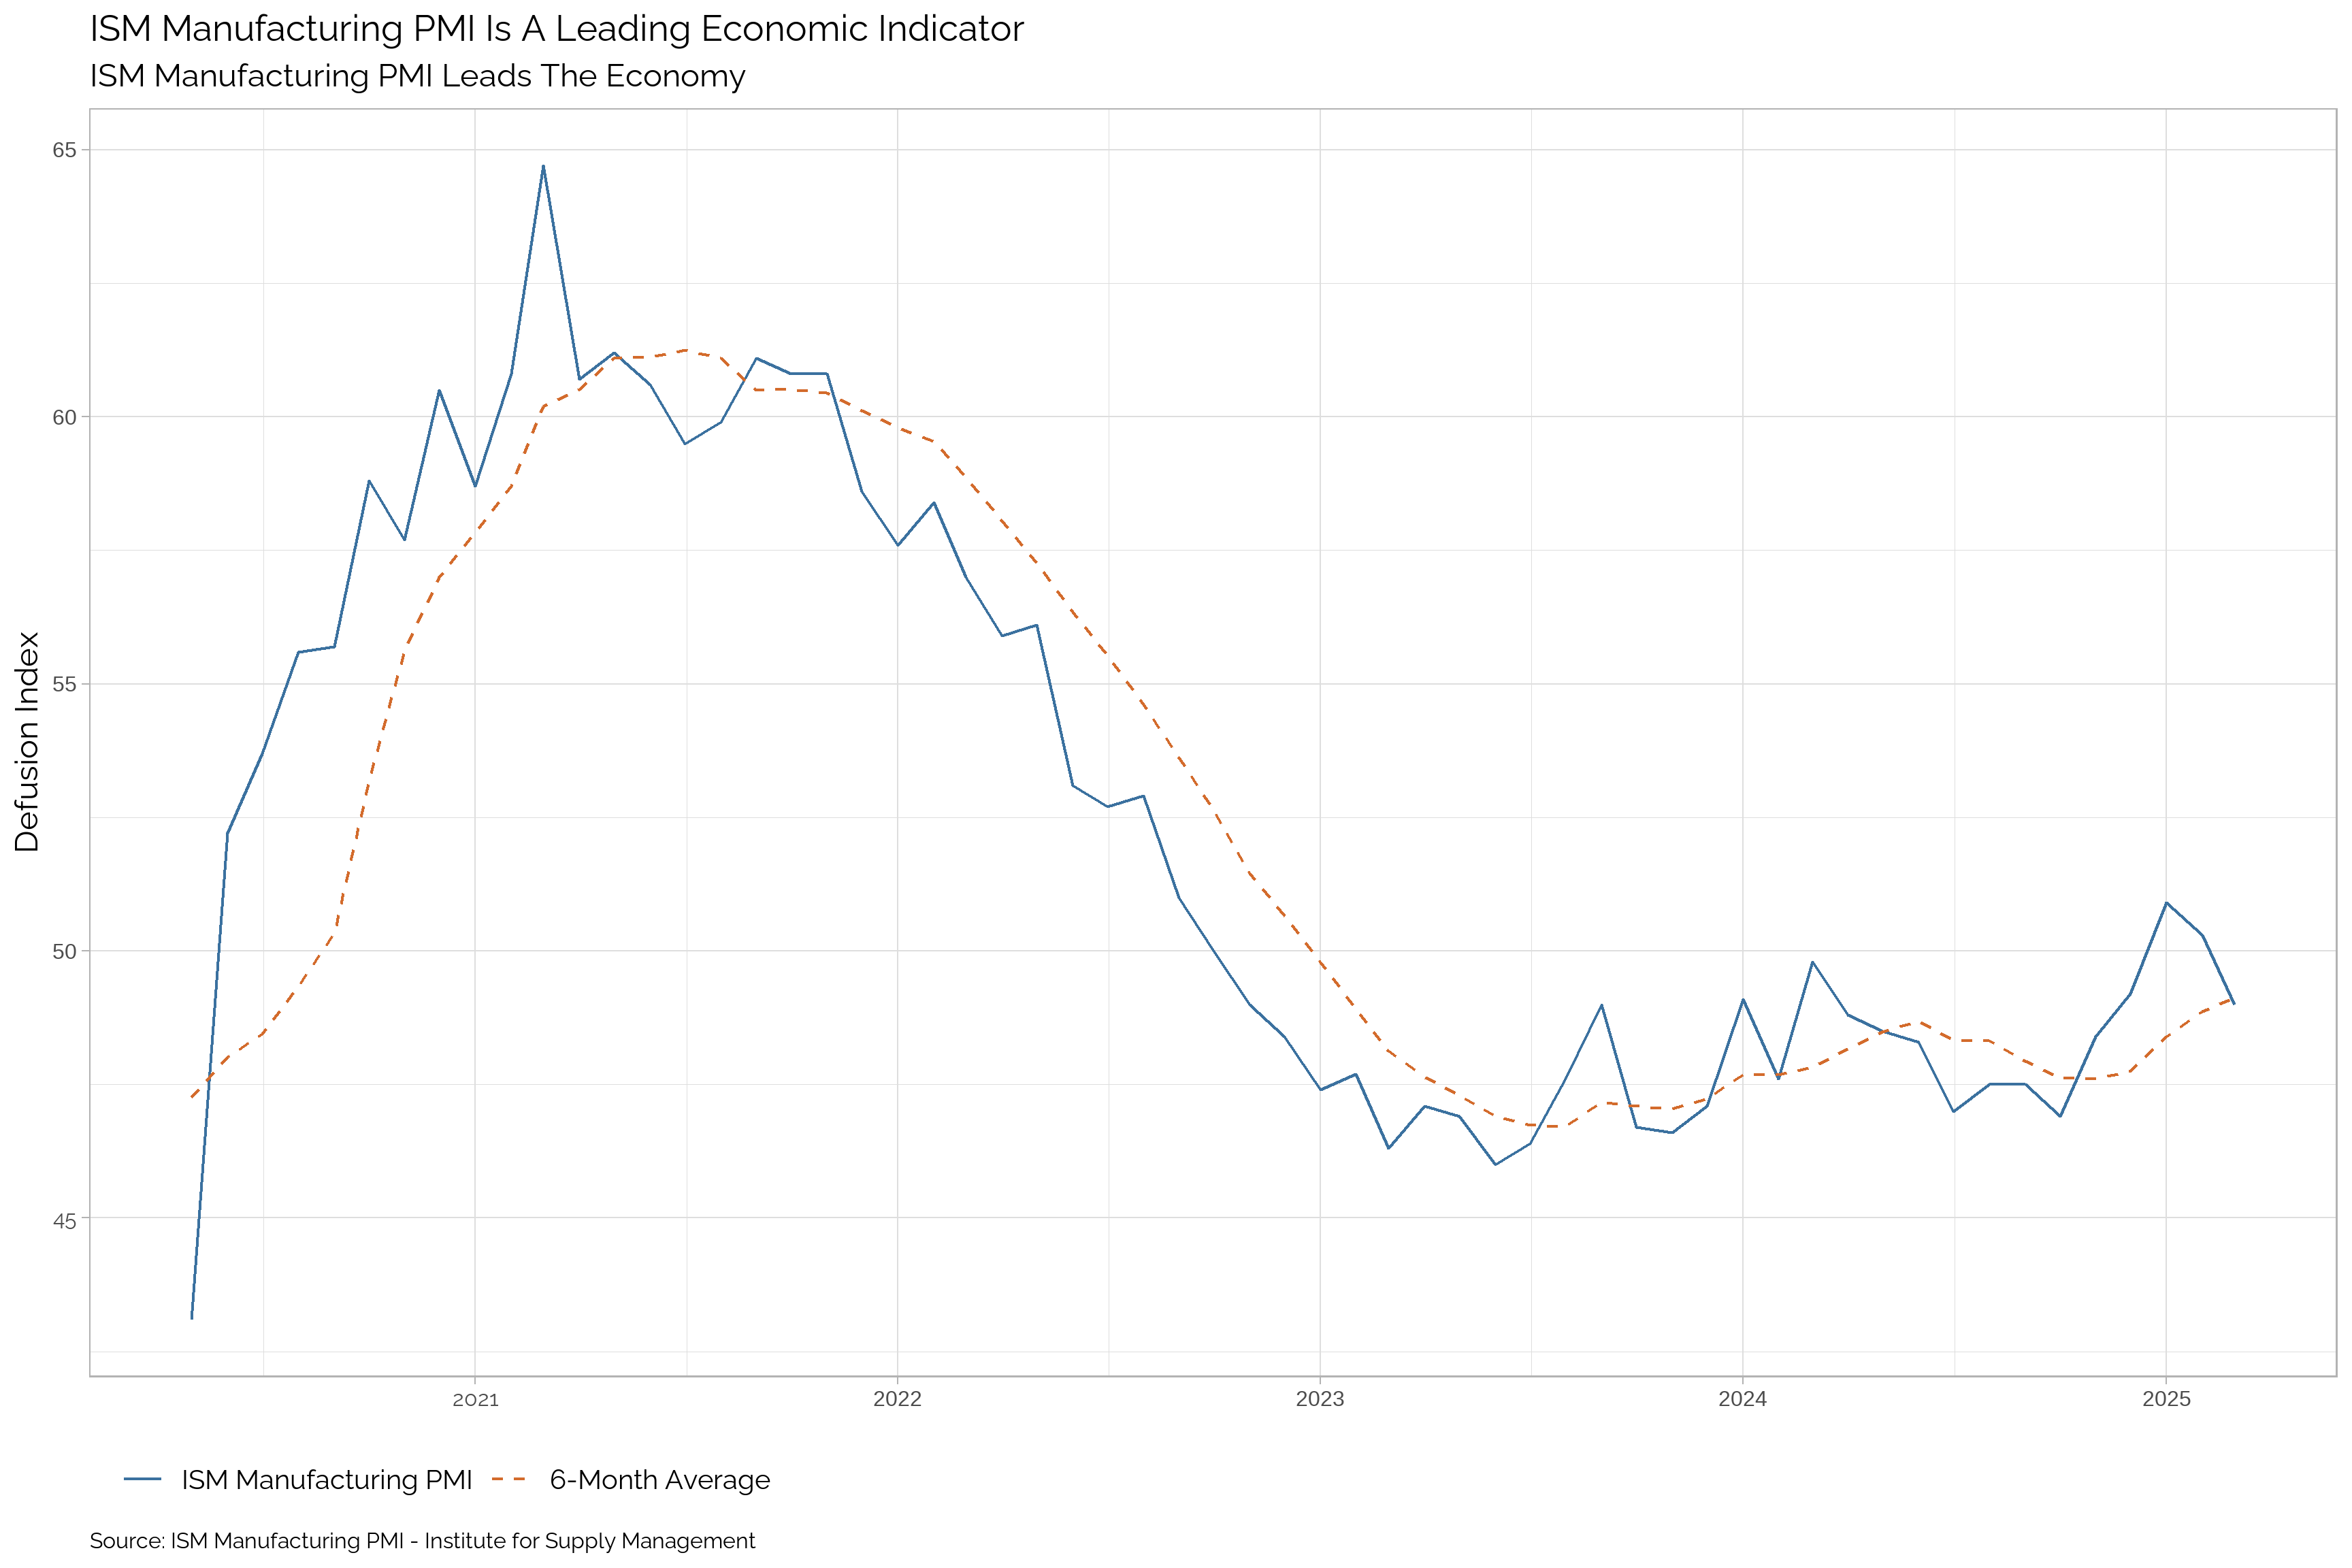
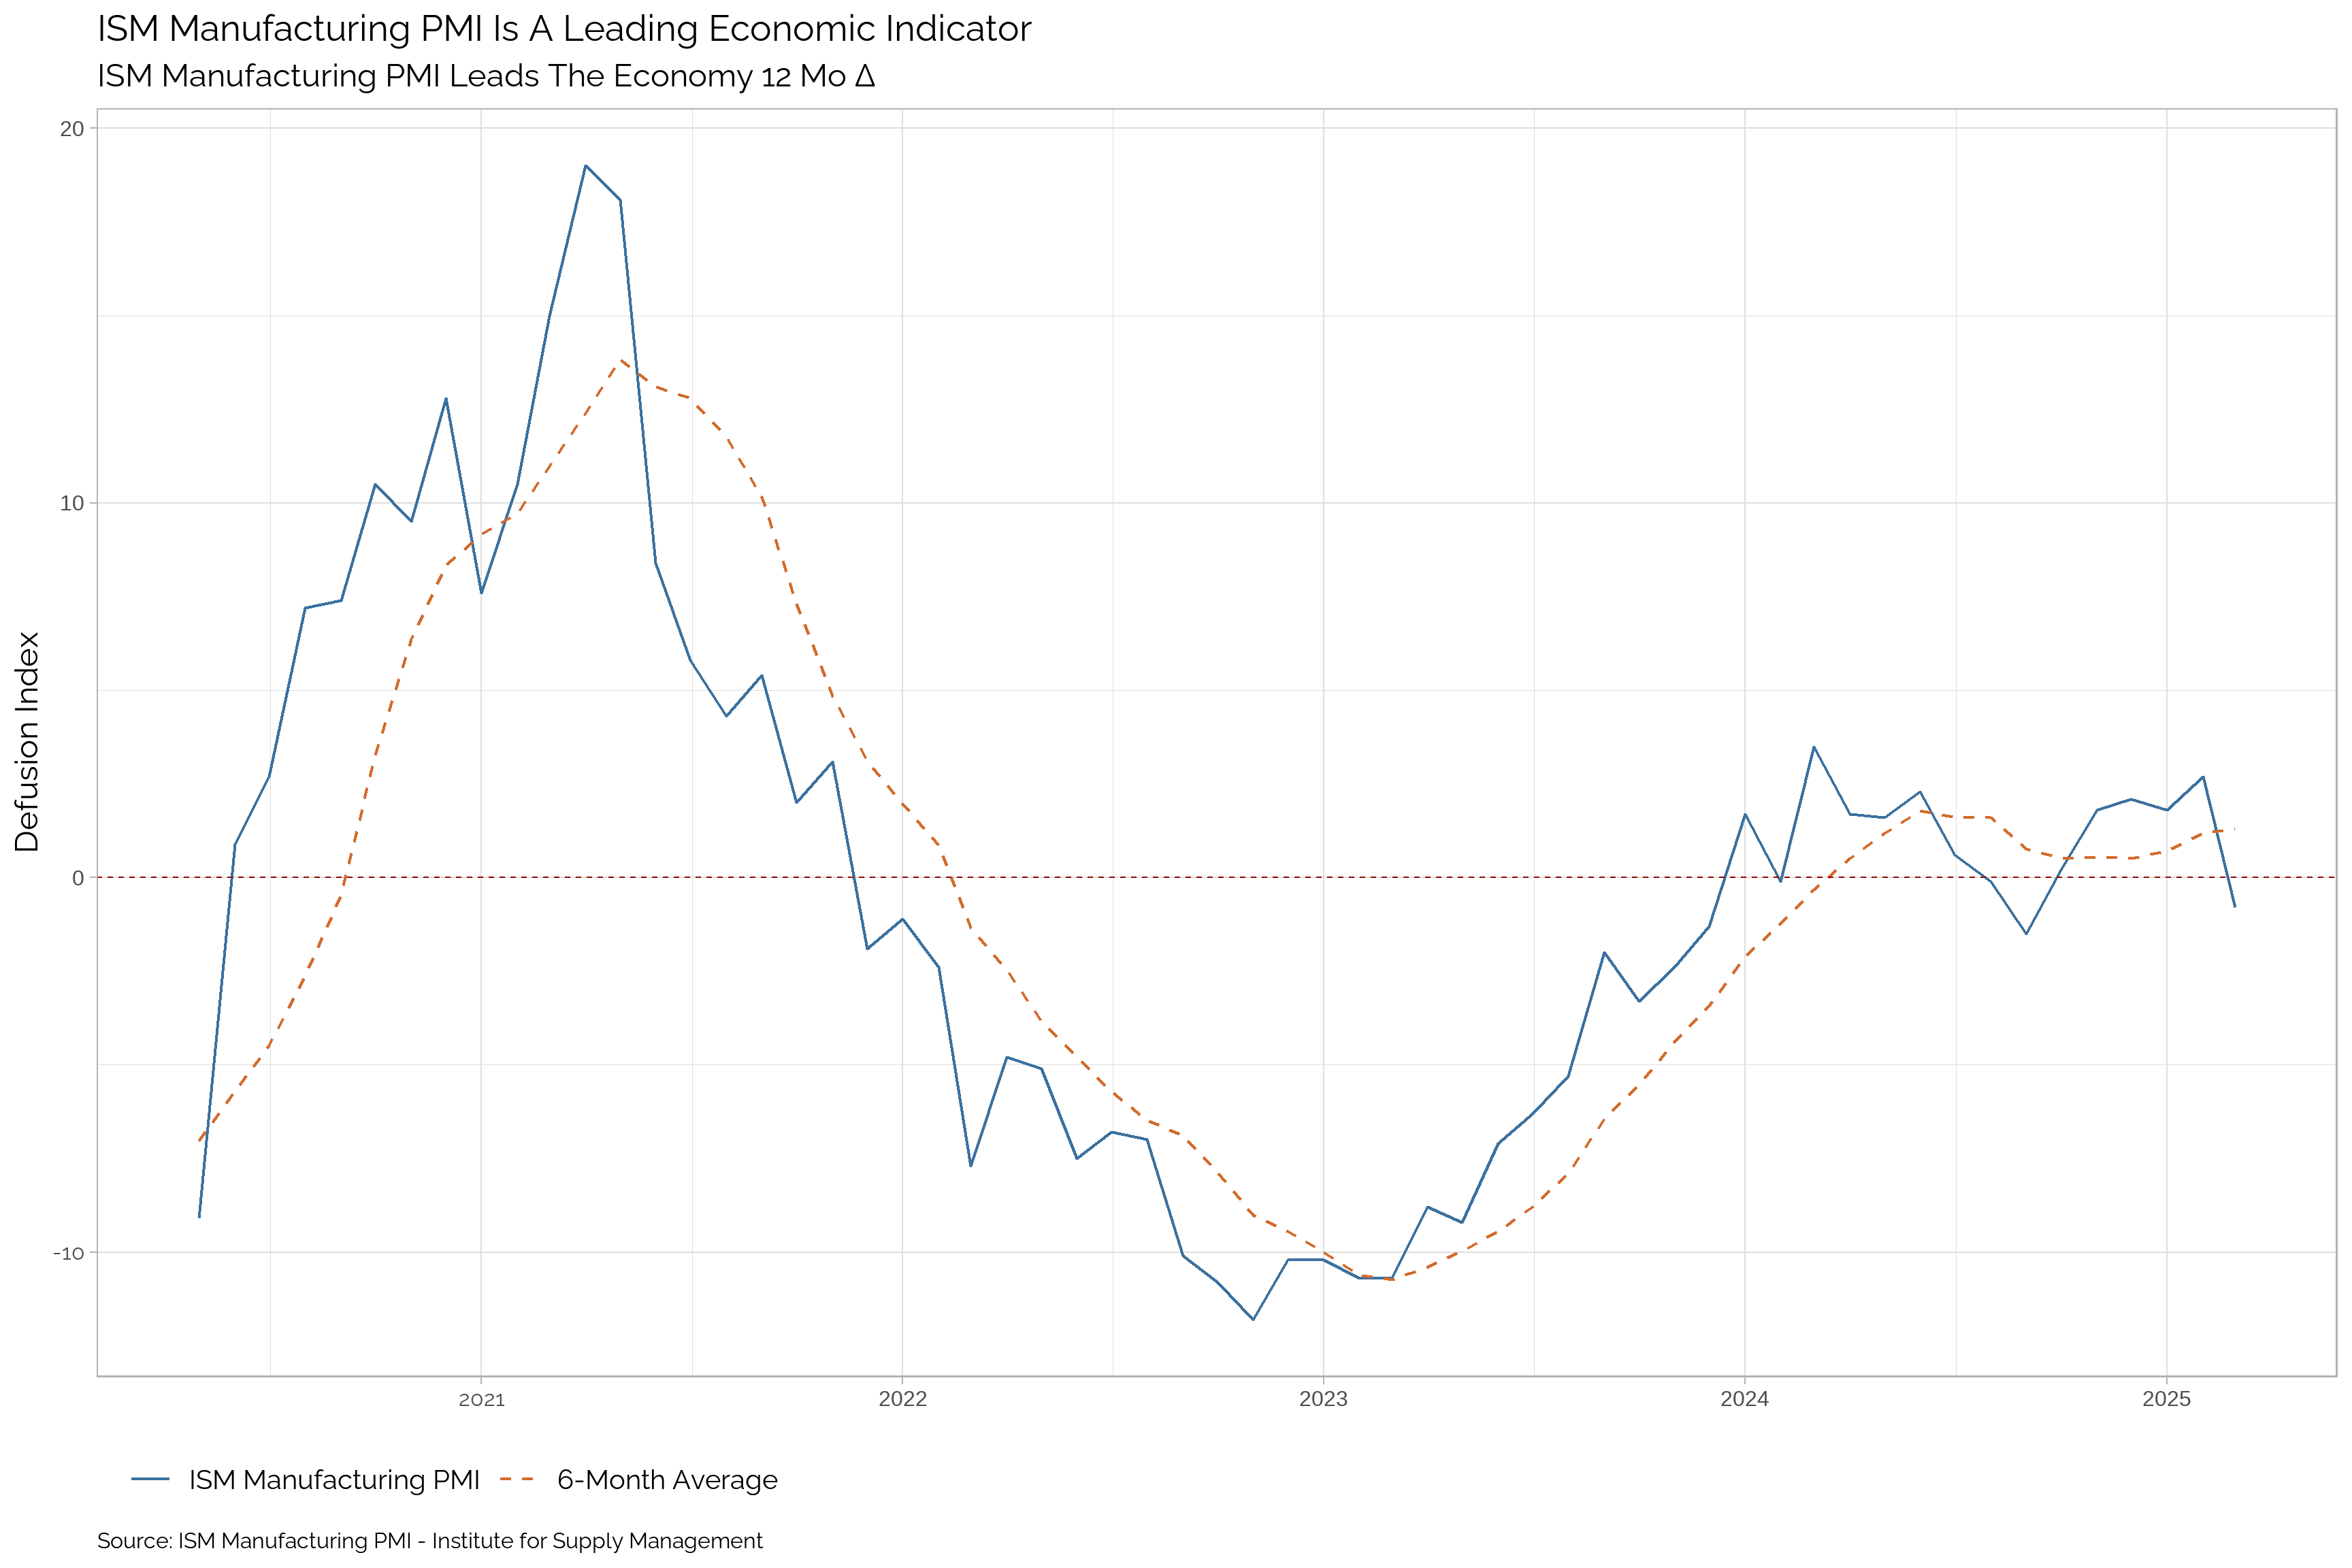
| Apr-25 | Mar-25 | Feb-25 | Jan-25 | Dec-24 | Nov-24 | Oct-24 | Sep-24 | Aug-24 | Jul-24 | Jun-24 | May-24 | |
|---|---|---|---|---|---|---|---|---|---|---|---|---|
| ISM Manufacturing PMI | -- | 49 | 50.3 | 50.9 | 49.2 | 48.4 | 46.9 | 47.5 | 47.5 | 47 | 48.3 | 48.5 |
| Δ Change | -- | -1.3 | -0.6 | 1.7 | 0.8 | 1.5 | -0.6 | 0 | 0.5 | -1.3 | -0.2 | -0.3 |
| Percent Δ Change | -- | -2.58 | -1.18 | 3.46 | 1.65 | 3.2 | -1.26 | 0 | 1.06 | -2.69 | -0.41 | -0.61 |
| Yr/Yr Change | -- | -0.8 | 2.7 | 1.8 | 2.1 | 1.8 | 0.2 | -1.5 | -0.1 | 0.6 | 2.3 | 1.6 |
| Trend | -- | Down | Up | Up | Up | Up | Down | Down | Down | Down | Down | Up |
| Trend in Growth Rate | -- | Down | Up | Up | Up | Up | Down | Down | Down | Down | Up | Up |
Hard Data
Manufacturers’ New Orders
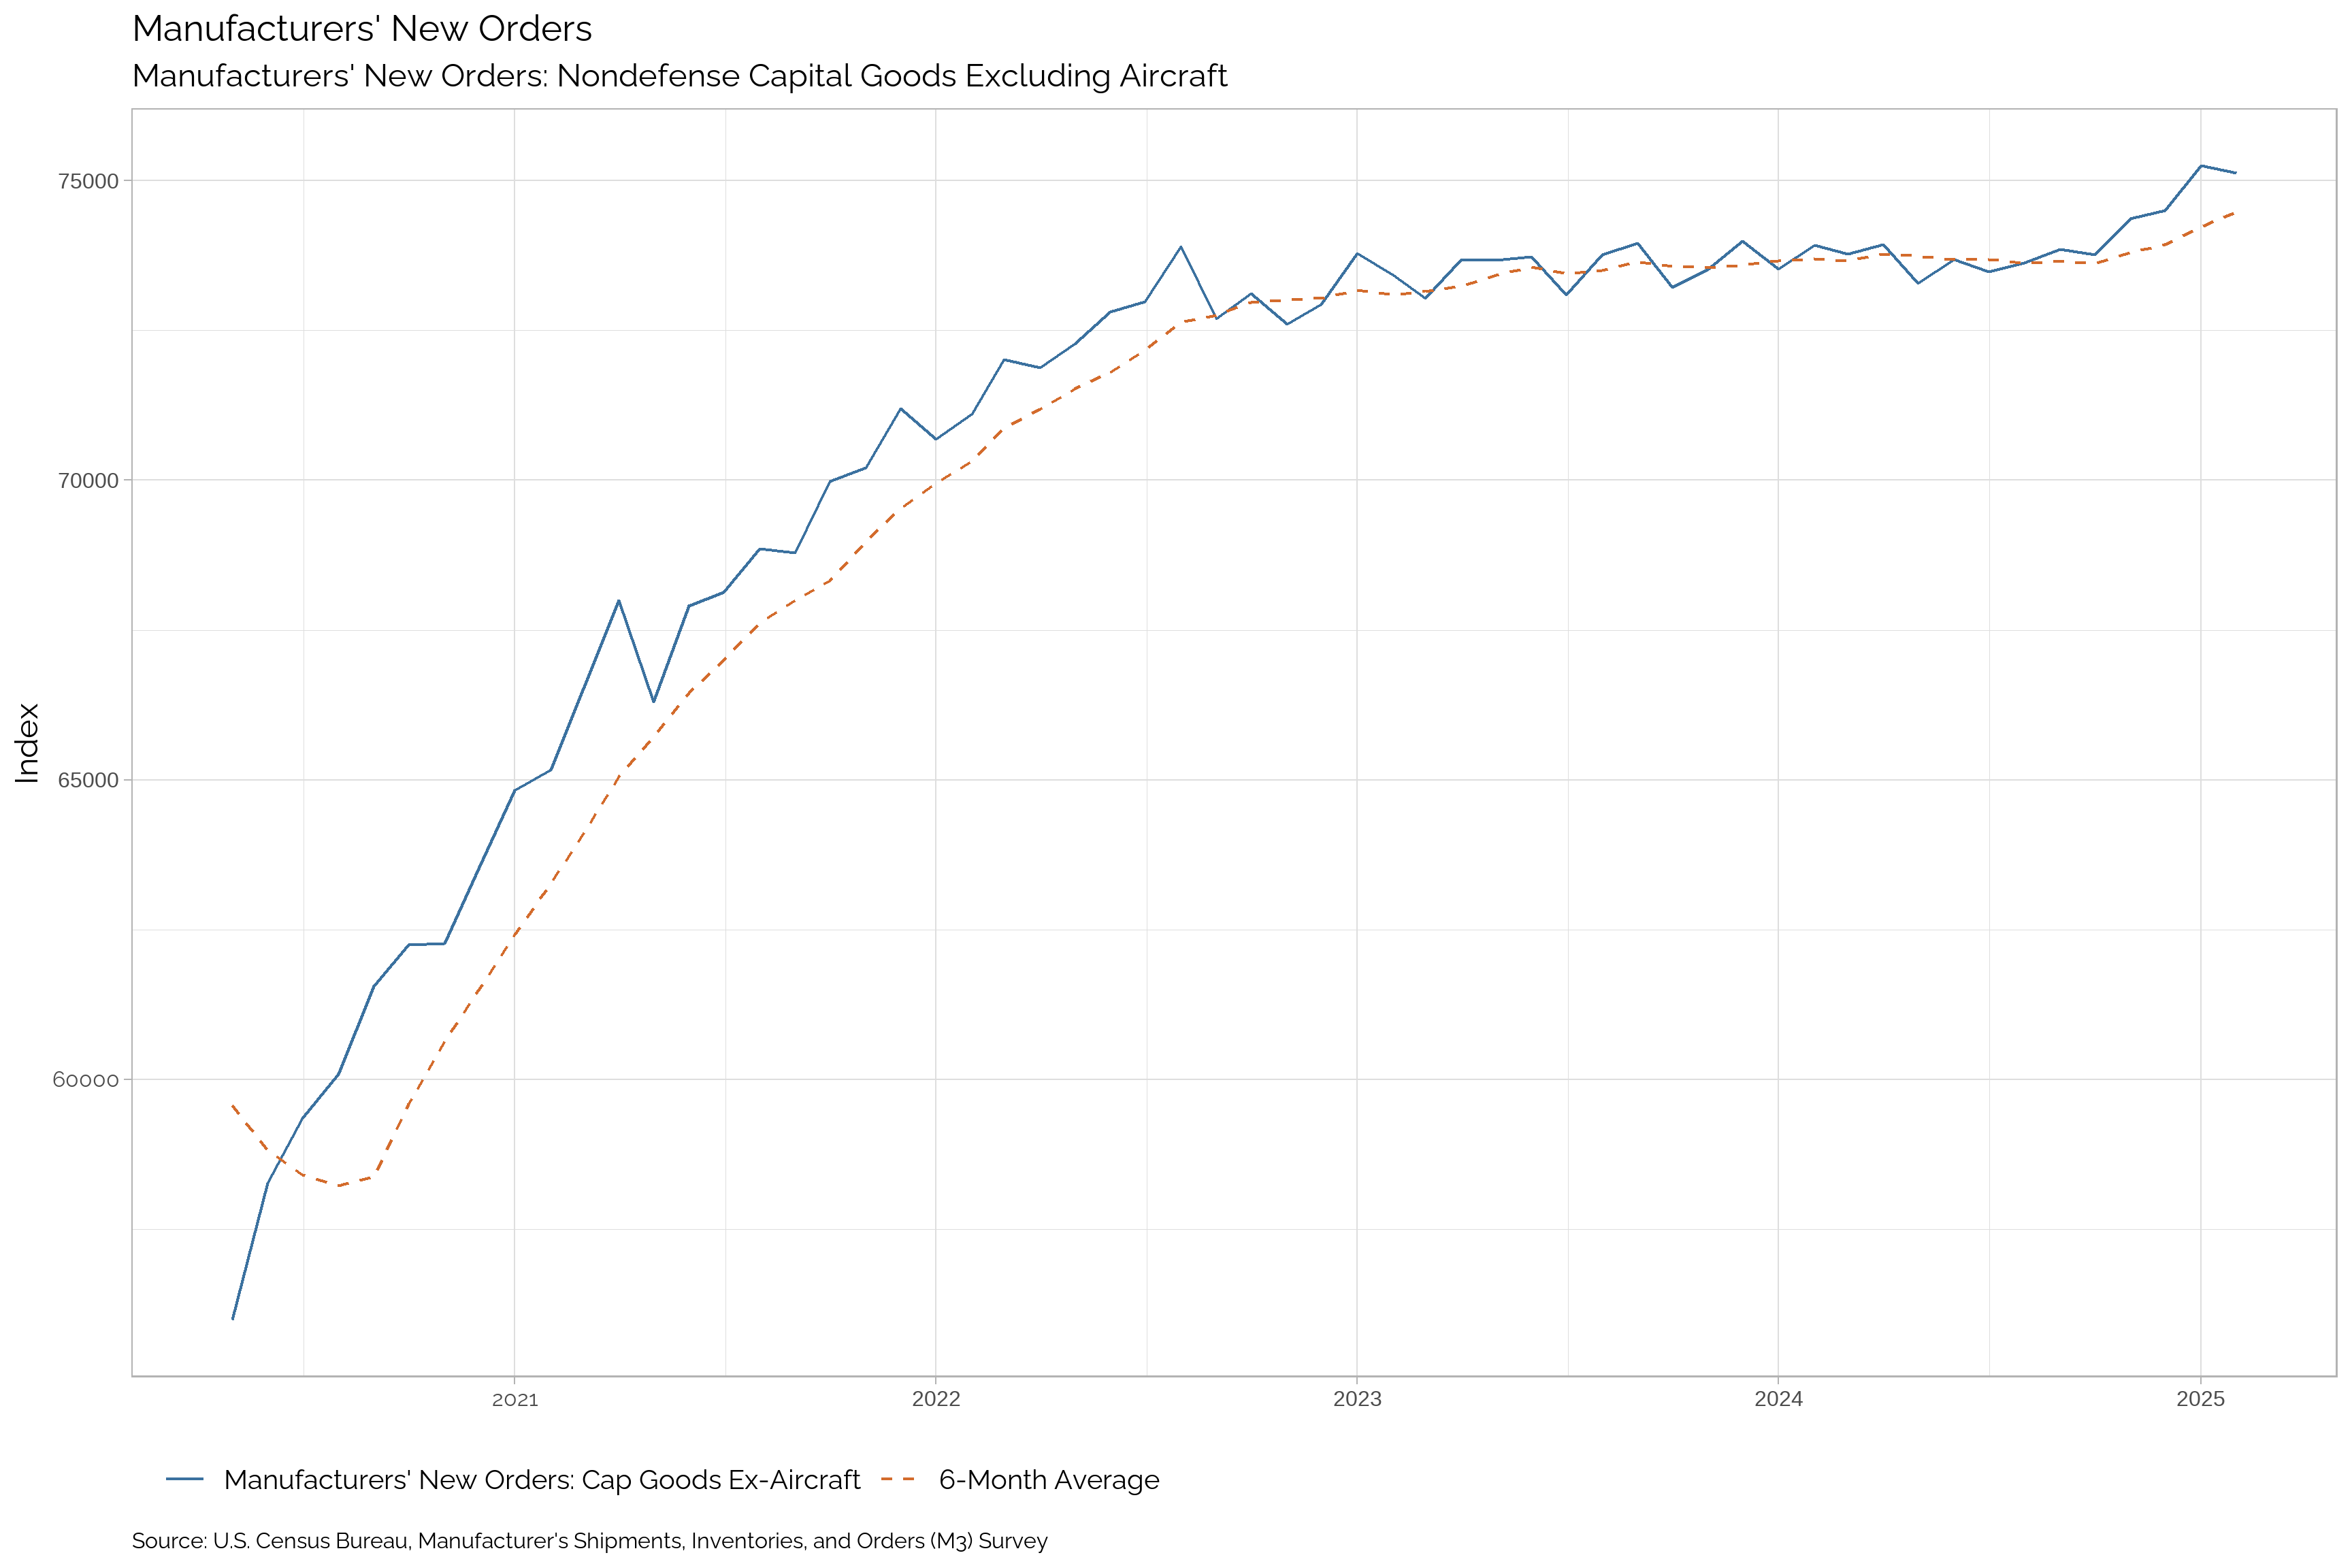
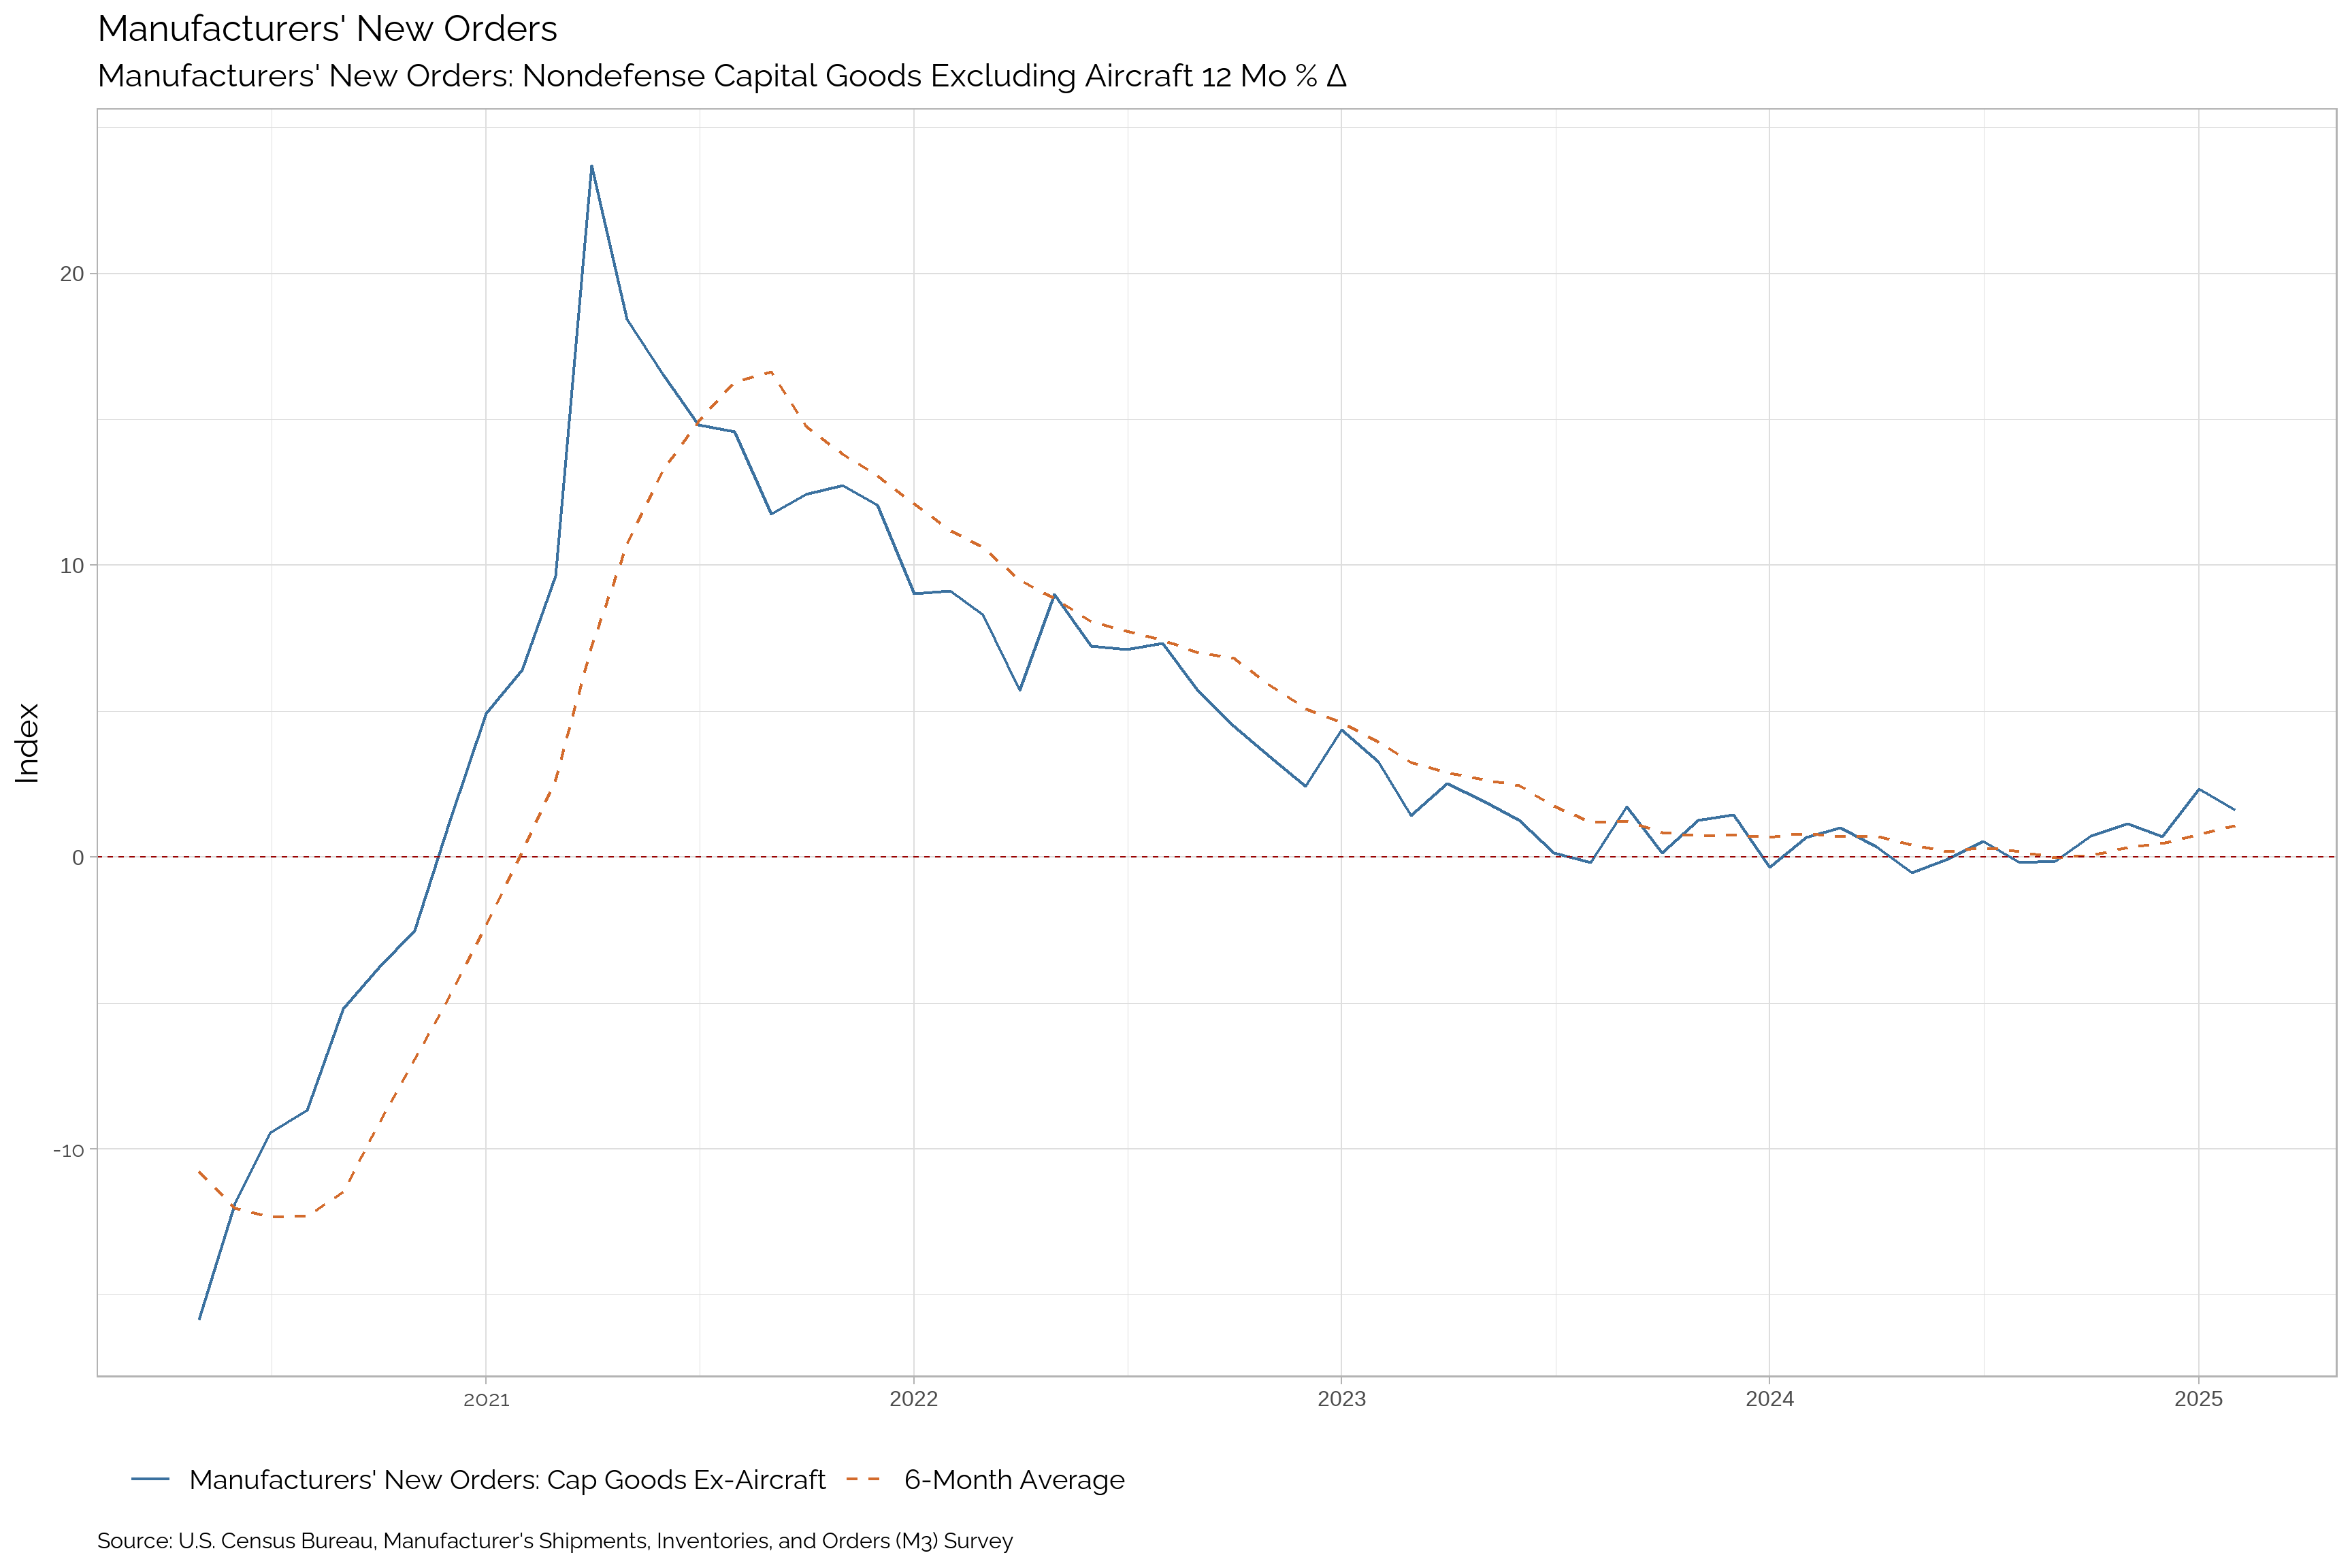
| Apr-25 | Mar-25 | Feb-25 | Jan-25 | Dec-24 | Nov-24 | Oct-24 | Sep-24 | Aug-24 | Jul-24 | Jun-24 | May-24 | |
|---|---|---|---|---|---|---|---|---|---|---|---|---|
| Manufacturers' New Orders: Cap Goods Ex-Aircraft | -- | -- | 75131 | 75250 | 74507 | 74365 | 73764 | 73855 | 73632 | 73482 | 73690 | 73284 |
| Δ Change | -- | -- | -119 | 743 | 142 | 601 | -91 | 223 | 150 | -208 | 406 | -656 |
| Percent Δ Change | -- | -- | -0.16 | 1 | 0.19 | 0.81 | -0.12 | 0.3 | 0.2 | -0.28 | 0.55 | -0.89 |
| Yr/Yr Change | -- | -- | 1.63 | 2.34 | 0.7 | 1.15 | 0.74 | -0.15 | -0.18 | 0.53 | -0.06 | -0.53 |
| Trend | -- | -- | Up | Up | Up | Up | Up | Up | Down | Down | Down | Down |
| Trend in Growth Rate | -- | -- | Up | Up | Up | Up | Up | Down | Down | Up | Down | Down |
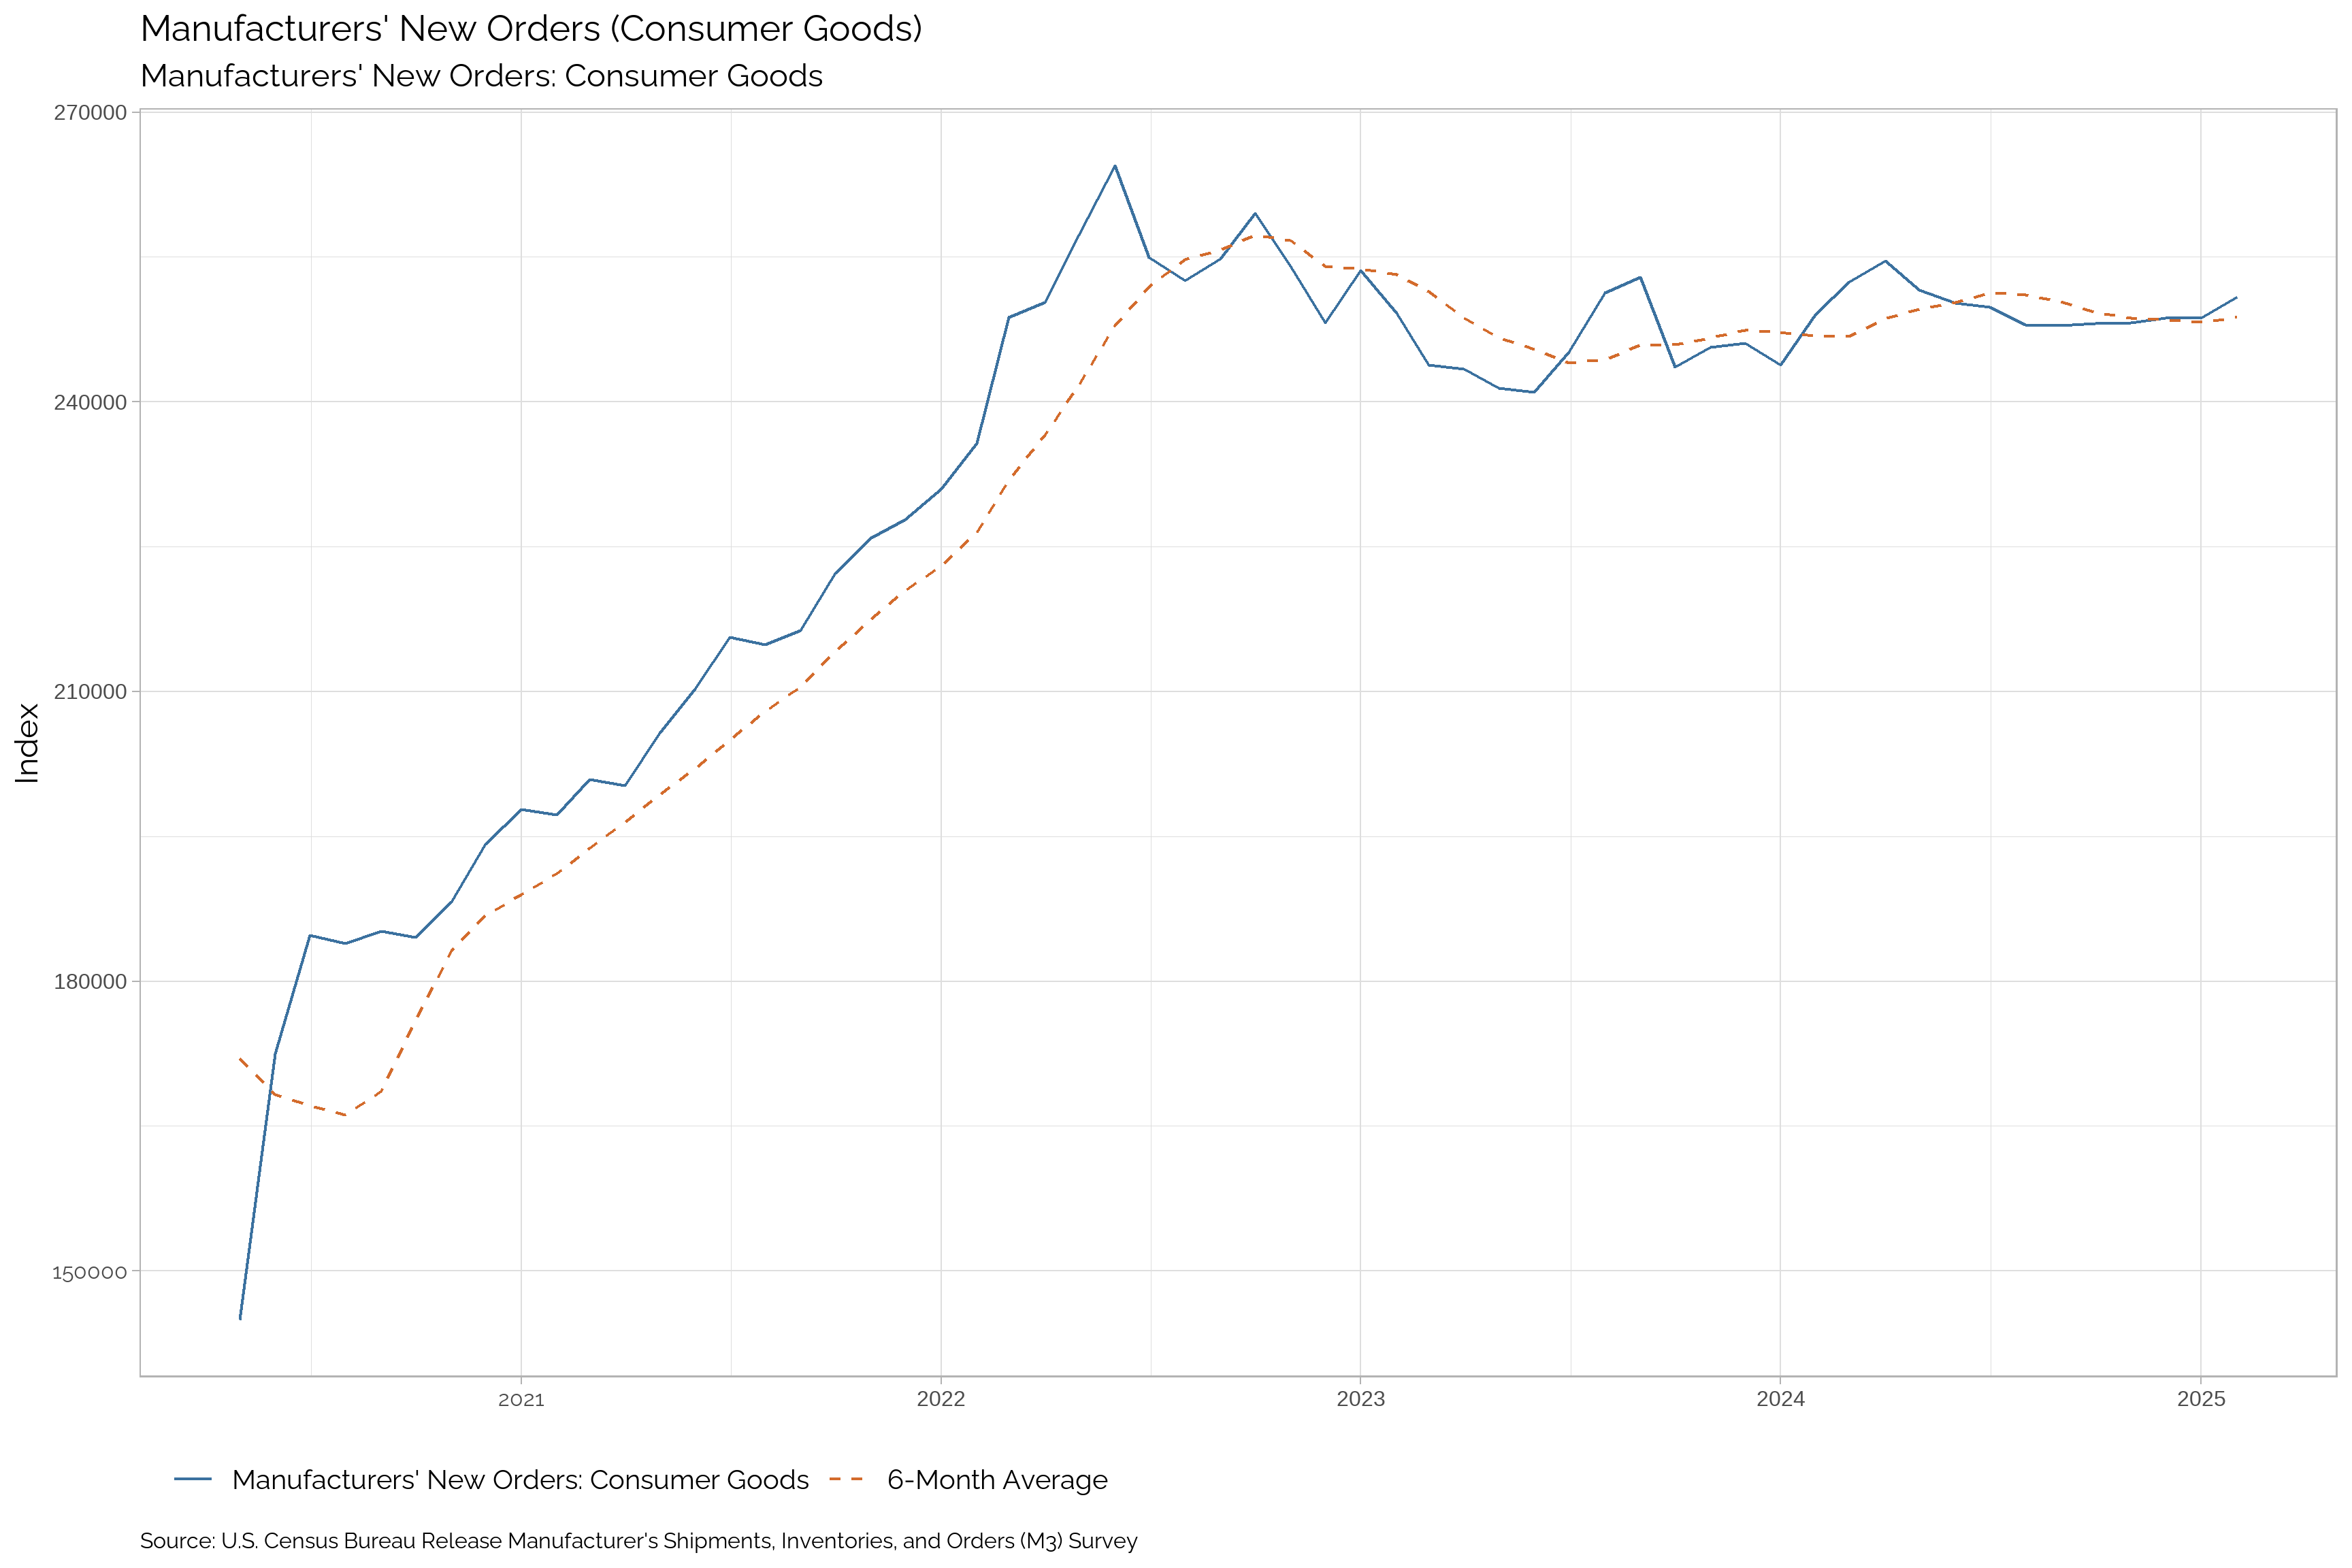
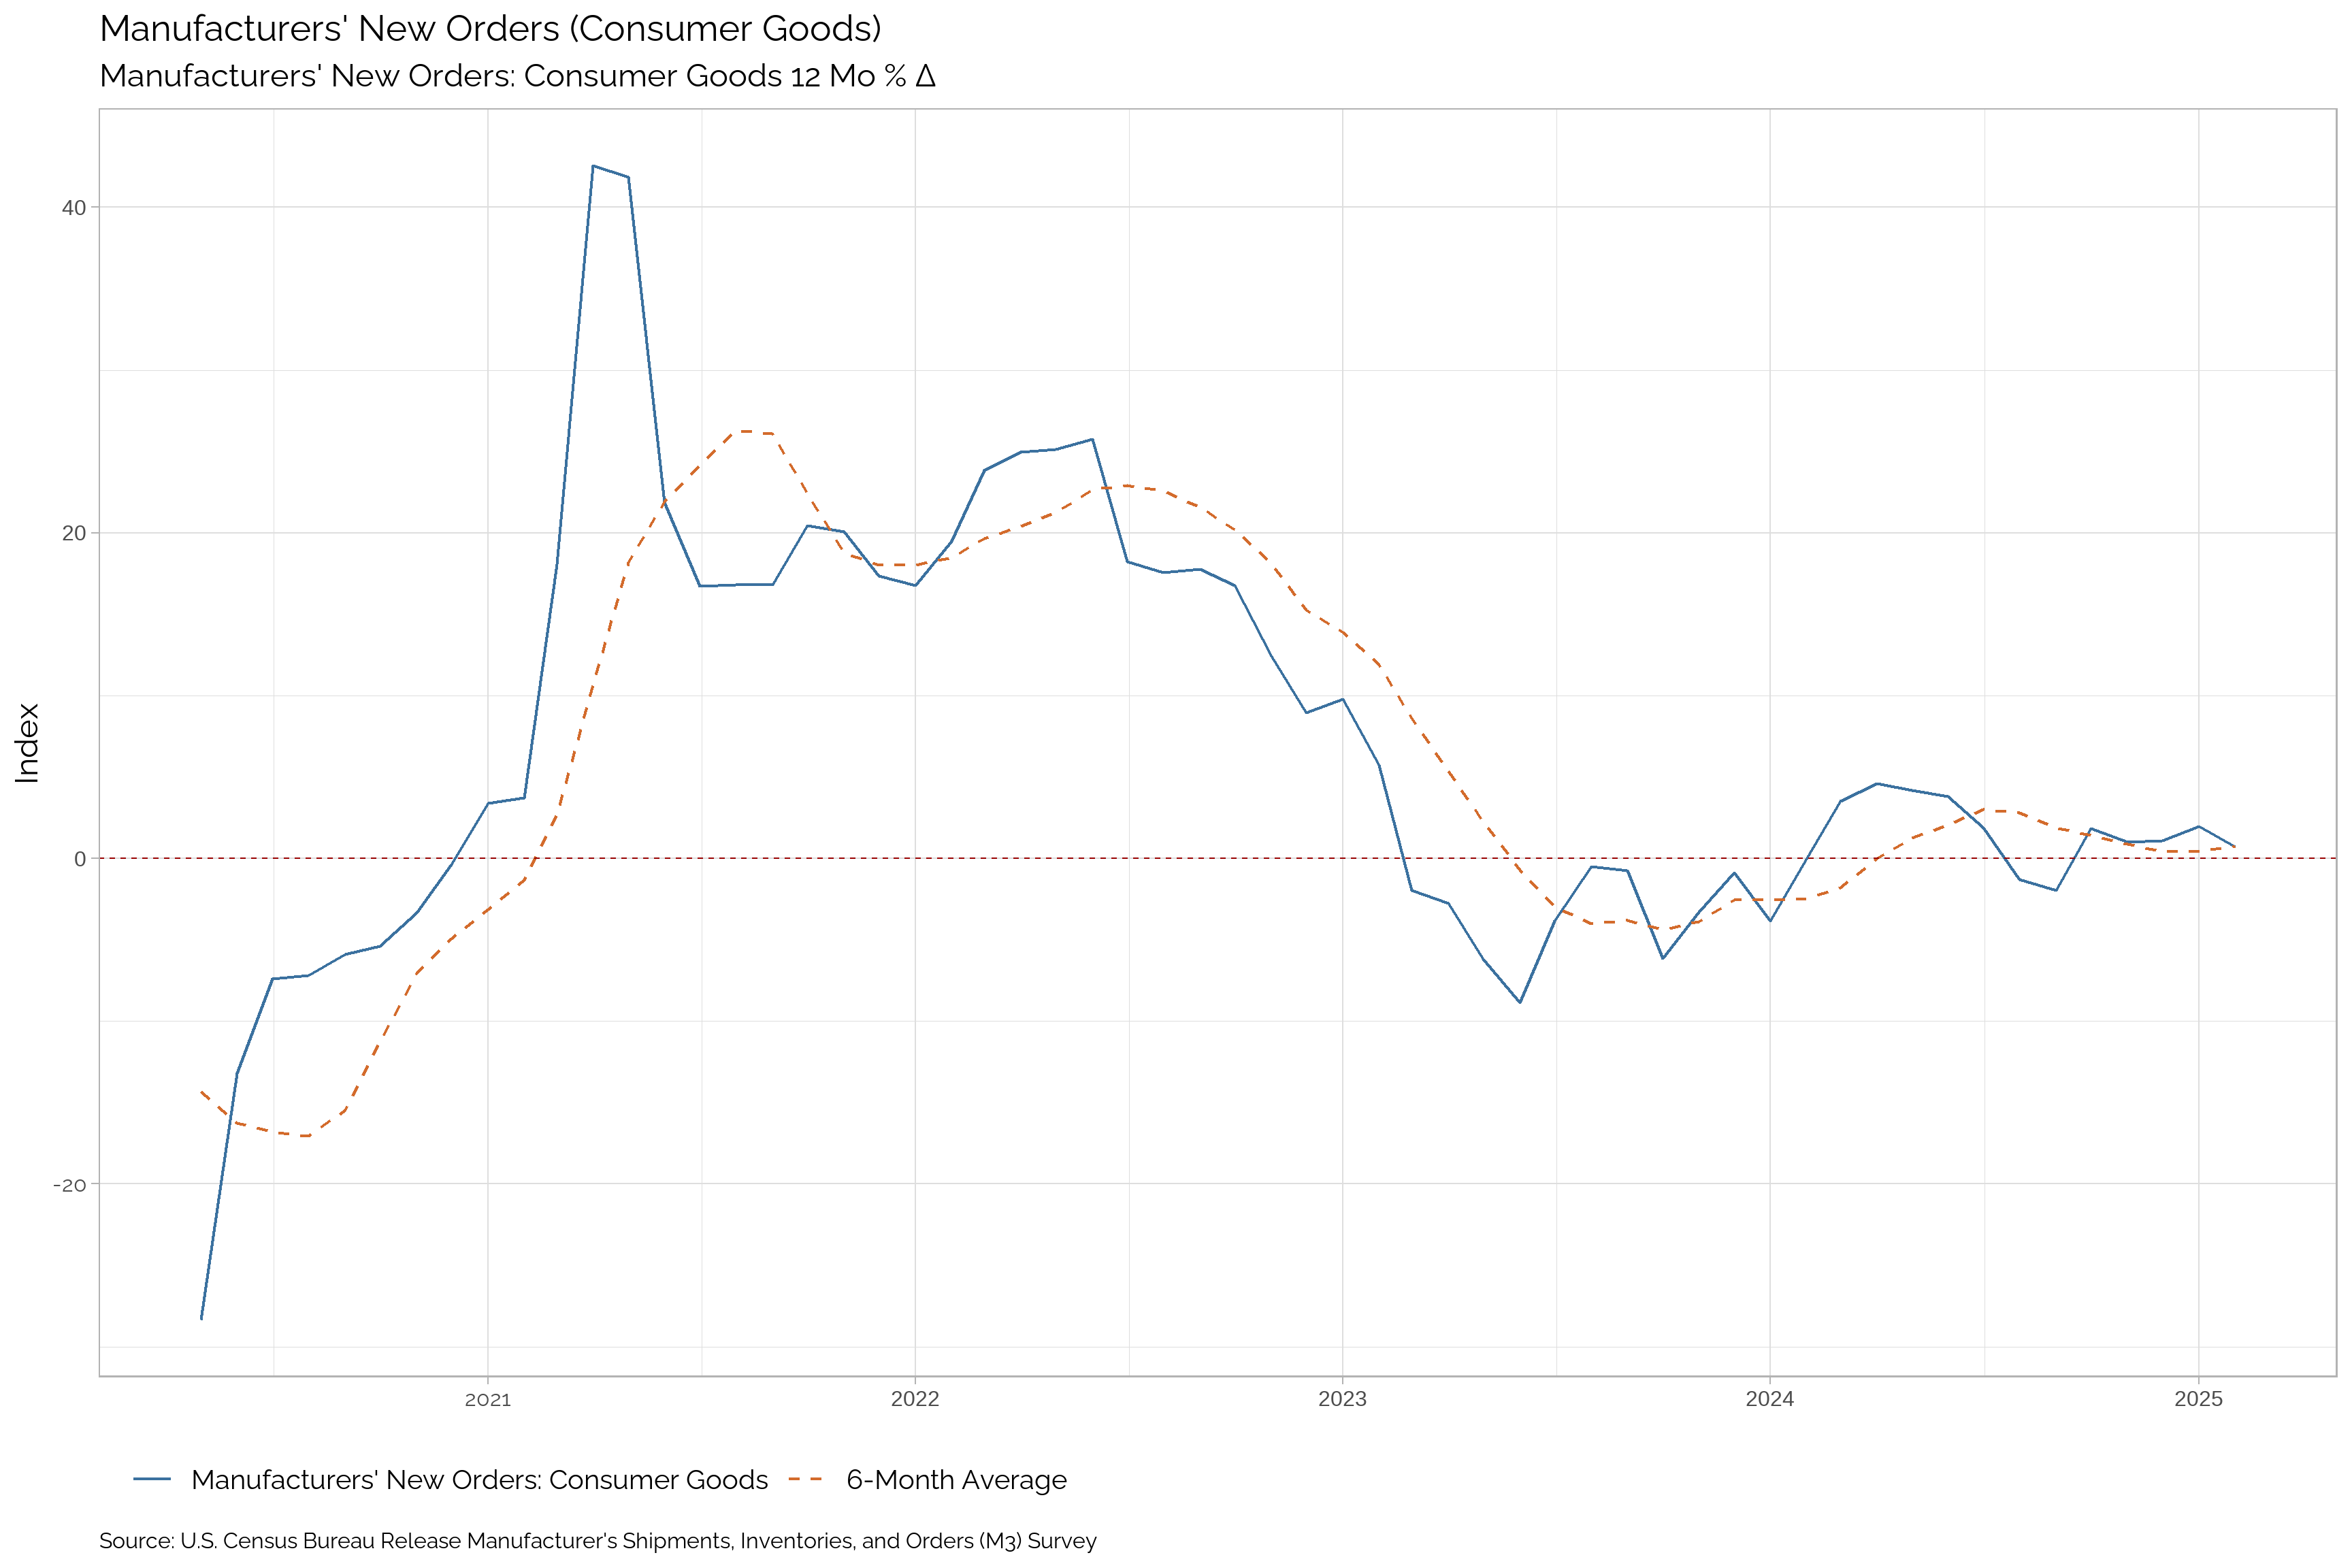
Manufacturers’ New Orders: Consumer Goods
| Apr-25 | Mar-25 | Feb-25 | Jan-25 | Dec-24 | Nov-24 | Oct-24 | Sep-24 | Aug-24 | Jul-24 | Jun-24 | May-24 | |
|---|---|---|---|---|---|---|---|---|---|---|---|---|
| Manufacturers' New Orders: Consumer Goods | -- | -- | 250897 | 248674 | 248684 | 248160 | 248120 | 247917 | 247991 | 249784 | 250233 | 251570 |
| Δ Change | -- | -- | 2223 | -10 | 524 | 40 | 203 | -74 | -1793 | -449 | -1337 | -3059 |
| Percent Δ Change | -- | -- | 0.89 | 0 | 0.21 | 0.02 | 0.08 | -0.03 | -0.72 | -0.18 | -0.53 | -1.2 |
| Yr/Yr Change | -- | -- | 0.71 | 1.98 | 1.07 | 1.01 | 1.84 | -1.97 | -1.3 | 1.88 | 3.83 | 4.19 |
| Trend | -- | -- | Up | Up | Up | Down | Down | Down | Down | Down | Down | Up |
| Trend in Growth Rate | -- | -- | Down | Up | Up | Up | Up | Down | Down | Down | Up | Up |
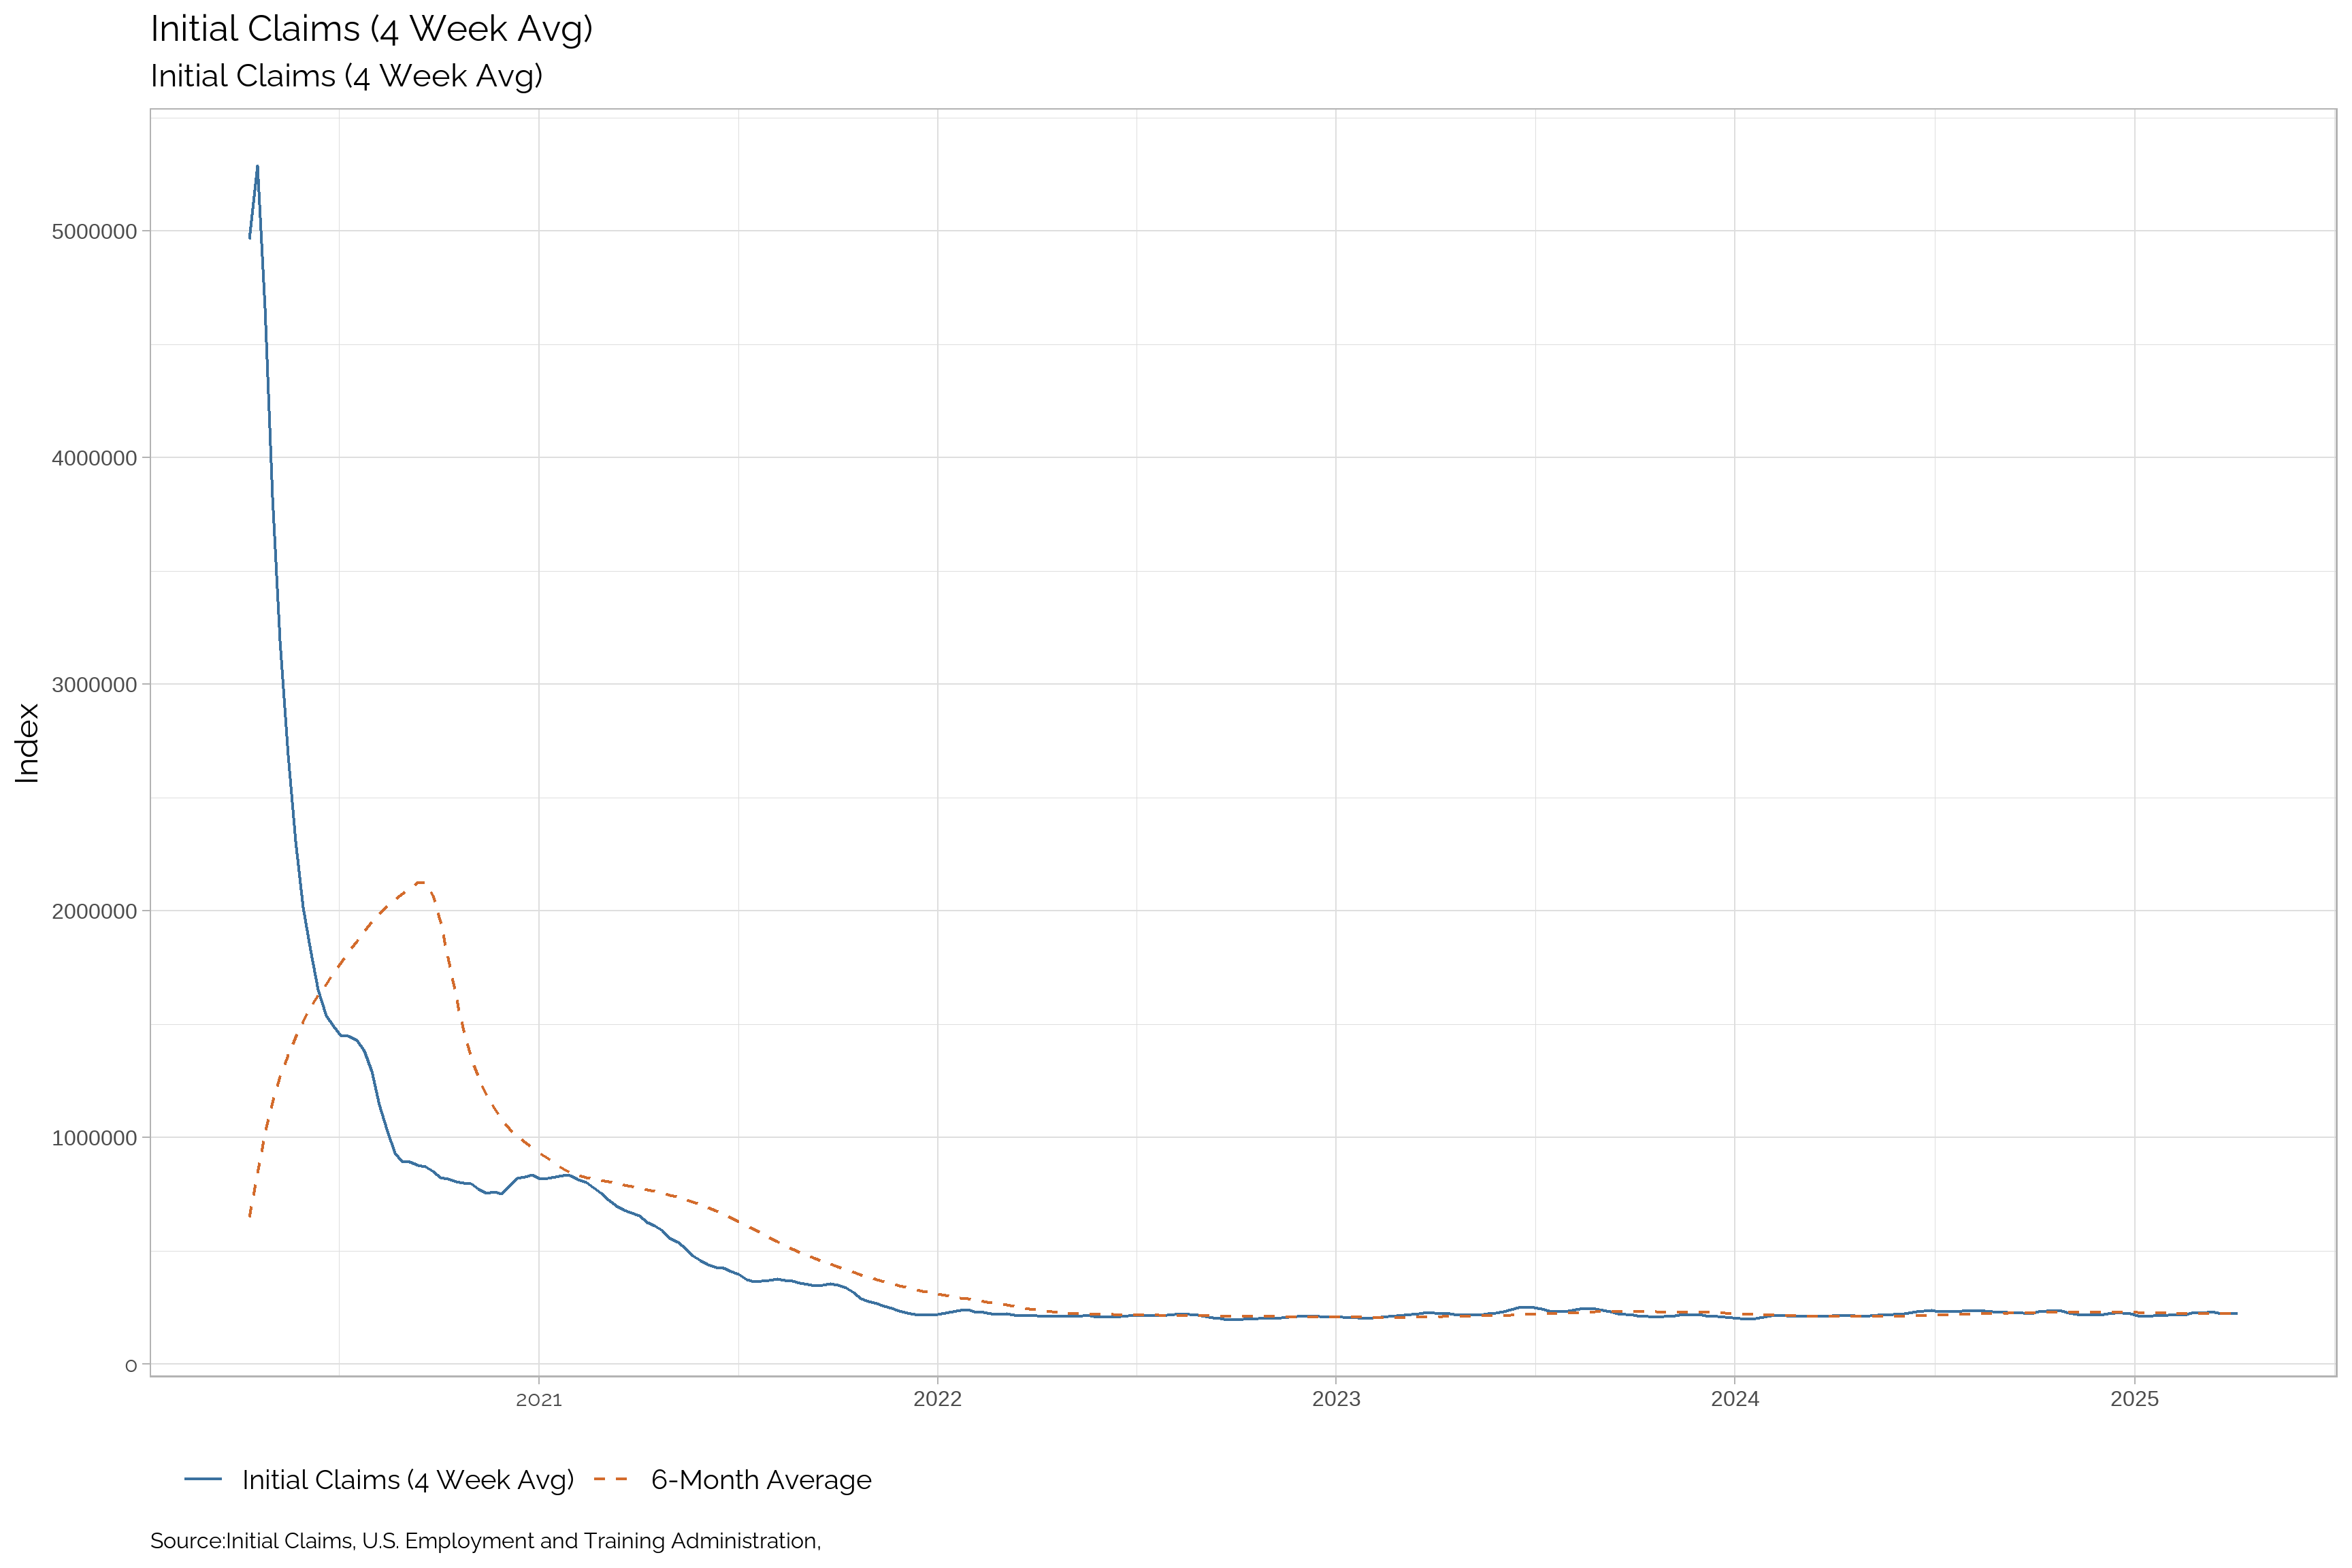
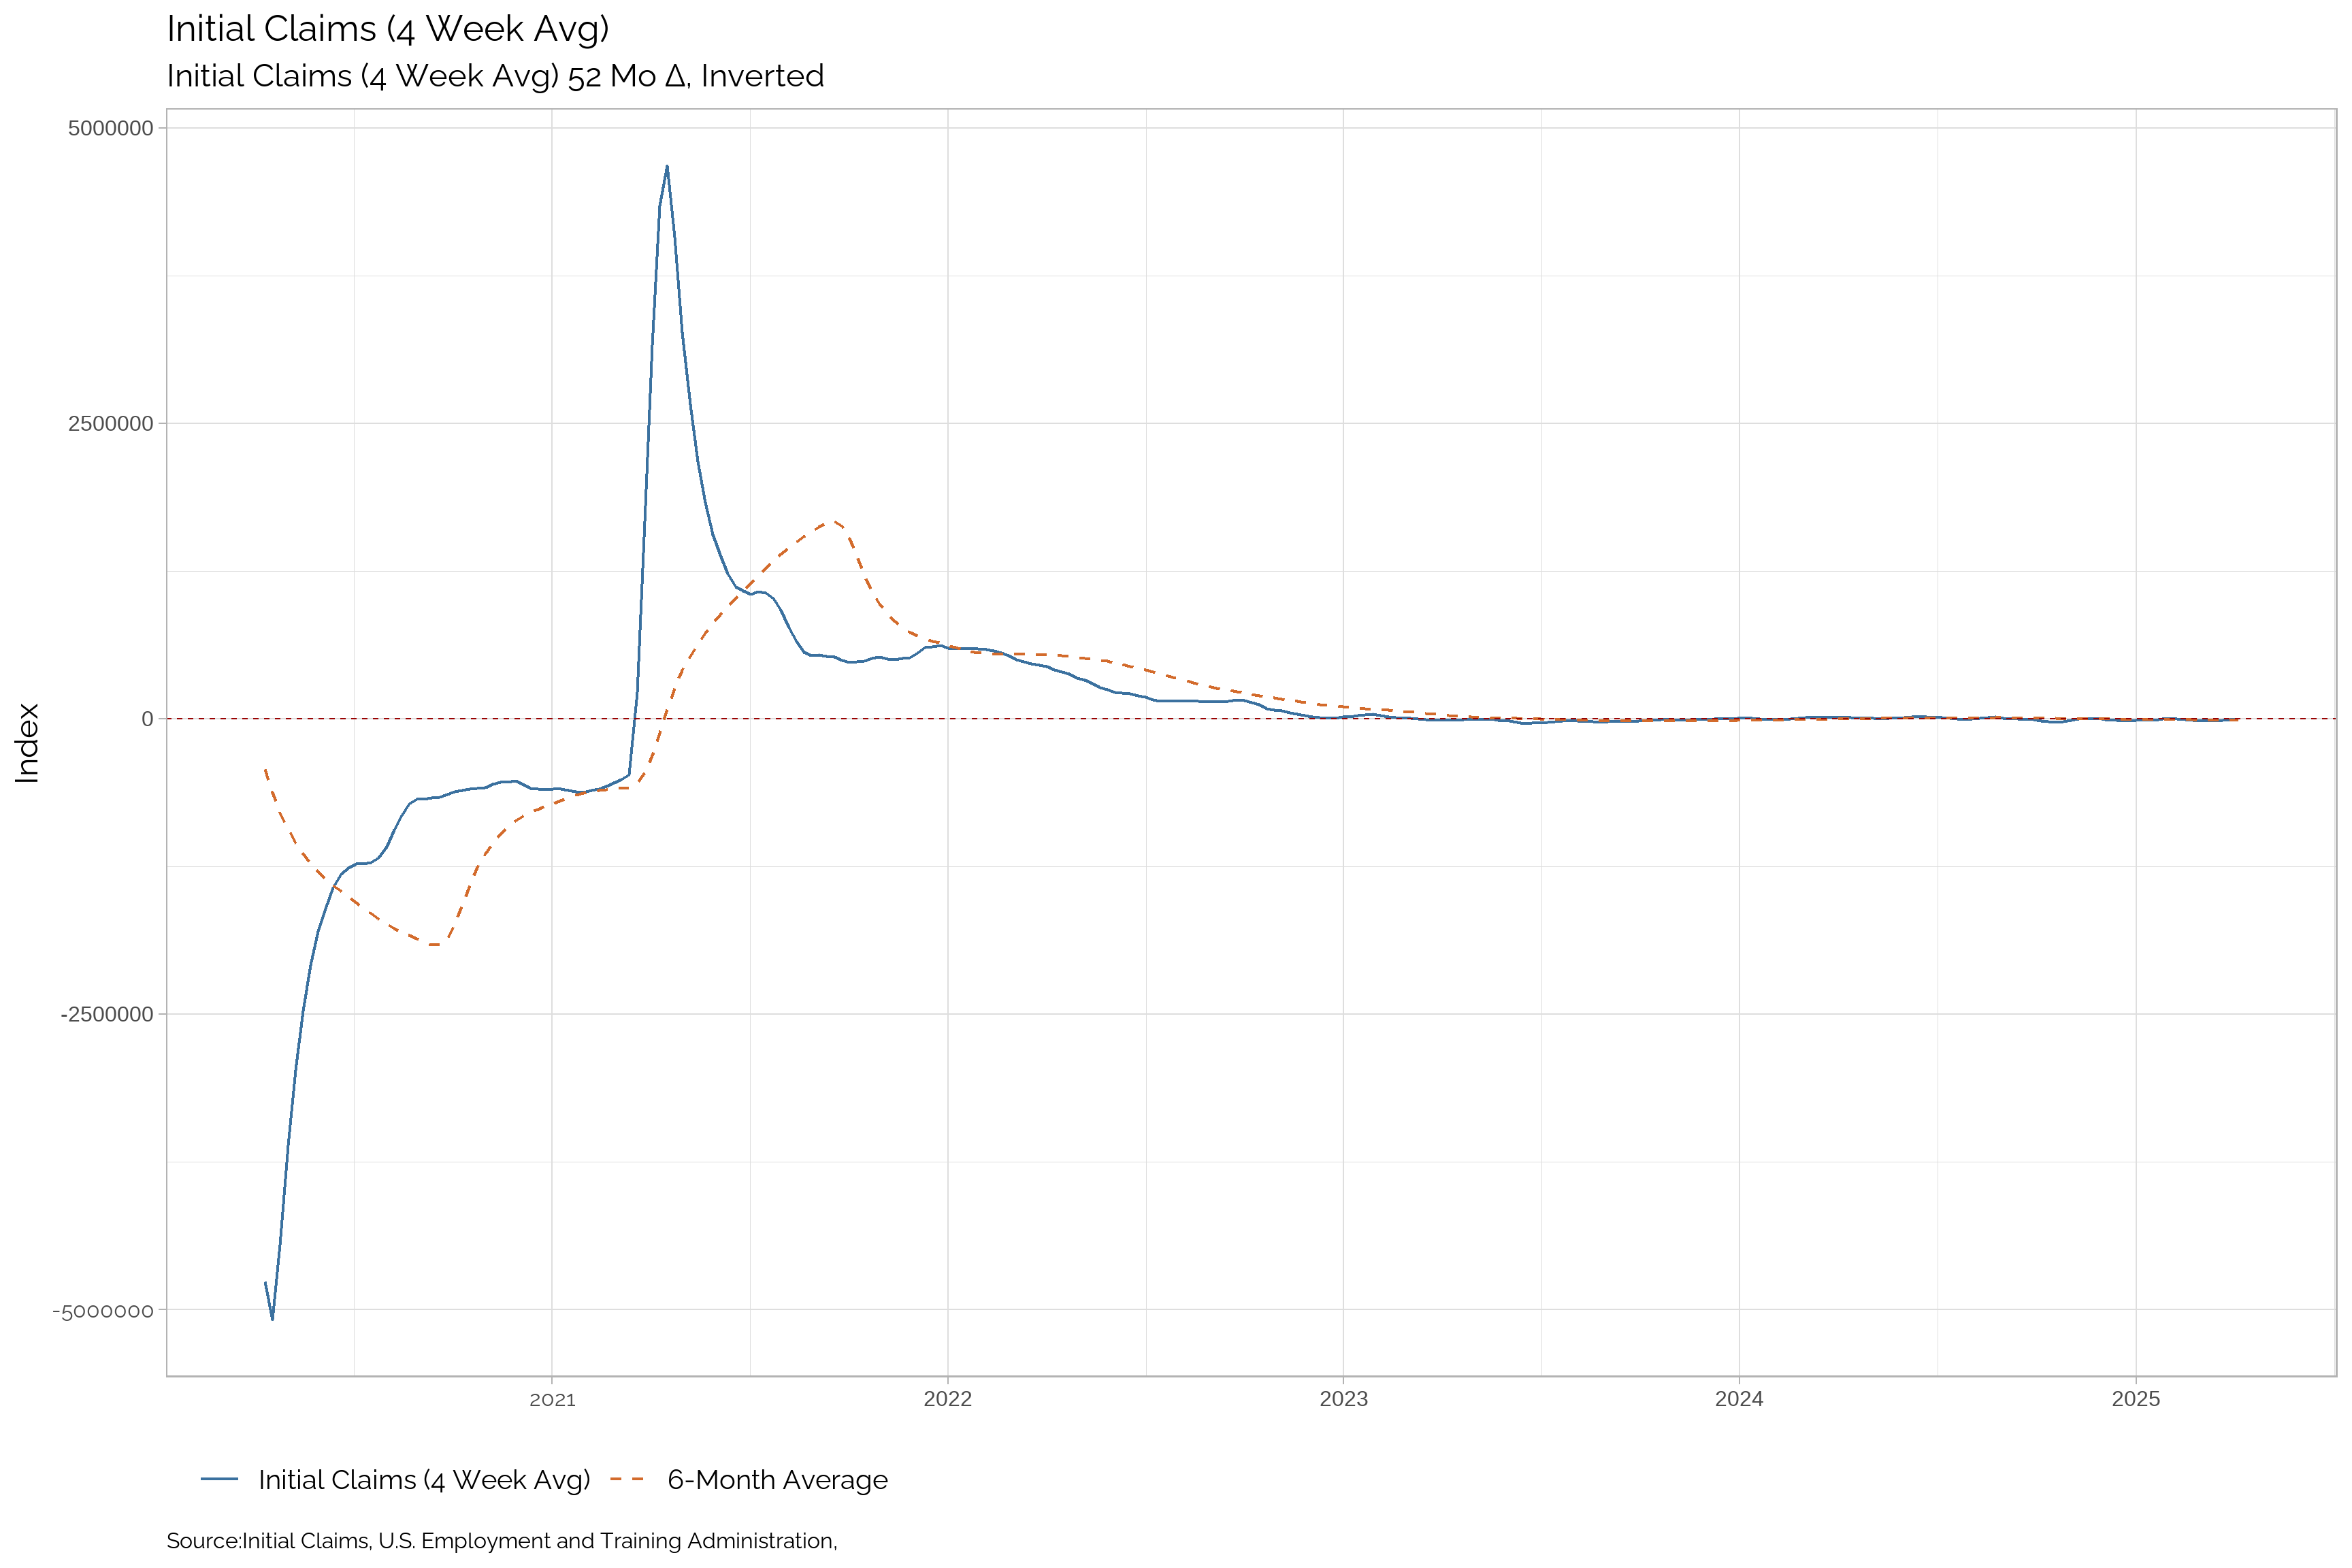
Initial Jobless Claims (4-week Average)
| Apr-25 | Mar-25 | Feb-25 | Jan-25 | Dec-24 | Nov-24 | Oct-24 | Sep-24 | Aug-24 | Jul-24 | Jun-24 | May-24 | |
|---|---|---|---|---|---|---|---|---|---|---|---|---|
| Initial Claims (4 Week Avg) | -- | 223000 | 226000 | 213500 | 222250 | 219000 | 236250 | 225000 | 230000 | 236500 | 237250 | 222000 |
| Δ Change | -- | -3000 | 12500 | -8750 | 3250 | -17250 | 11250 | -5000 | -6500 | -750 | 15250 | 11750 |
| Percent Δ Change | -- | -1.33 | 5.85 | -3.94 | 1.48 | -7.3 | 5 | -2.17 | -2.75 | -0.32 | 6.87 | 5.59 |
| Yr/Yr Change Inverted | -- | -7250 | -15250 | -3500 | -17000 | -1000 | -26000 | -8000 | 7250 | -5000 | 13250 | 4250 |
| Trend | -- | Down | Up | Down | Down | Down | Up | Down | Up | Up | Up | Up |
| Trend in Change Inverted | -- | Up | Down | Up | Down | Down | Down | Down | Down | Down | Up | Up |
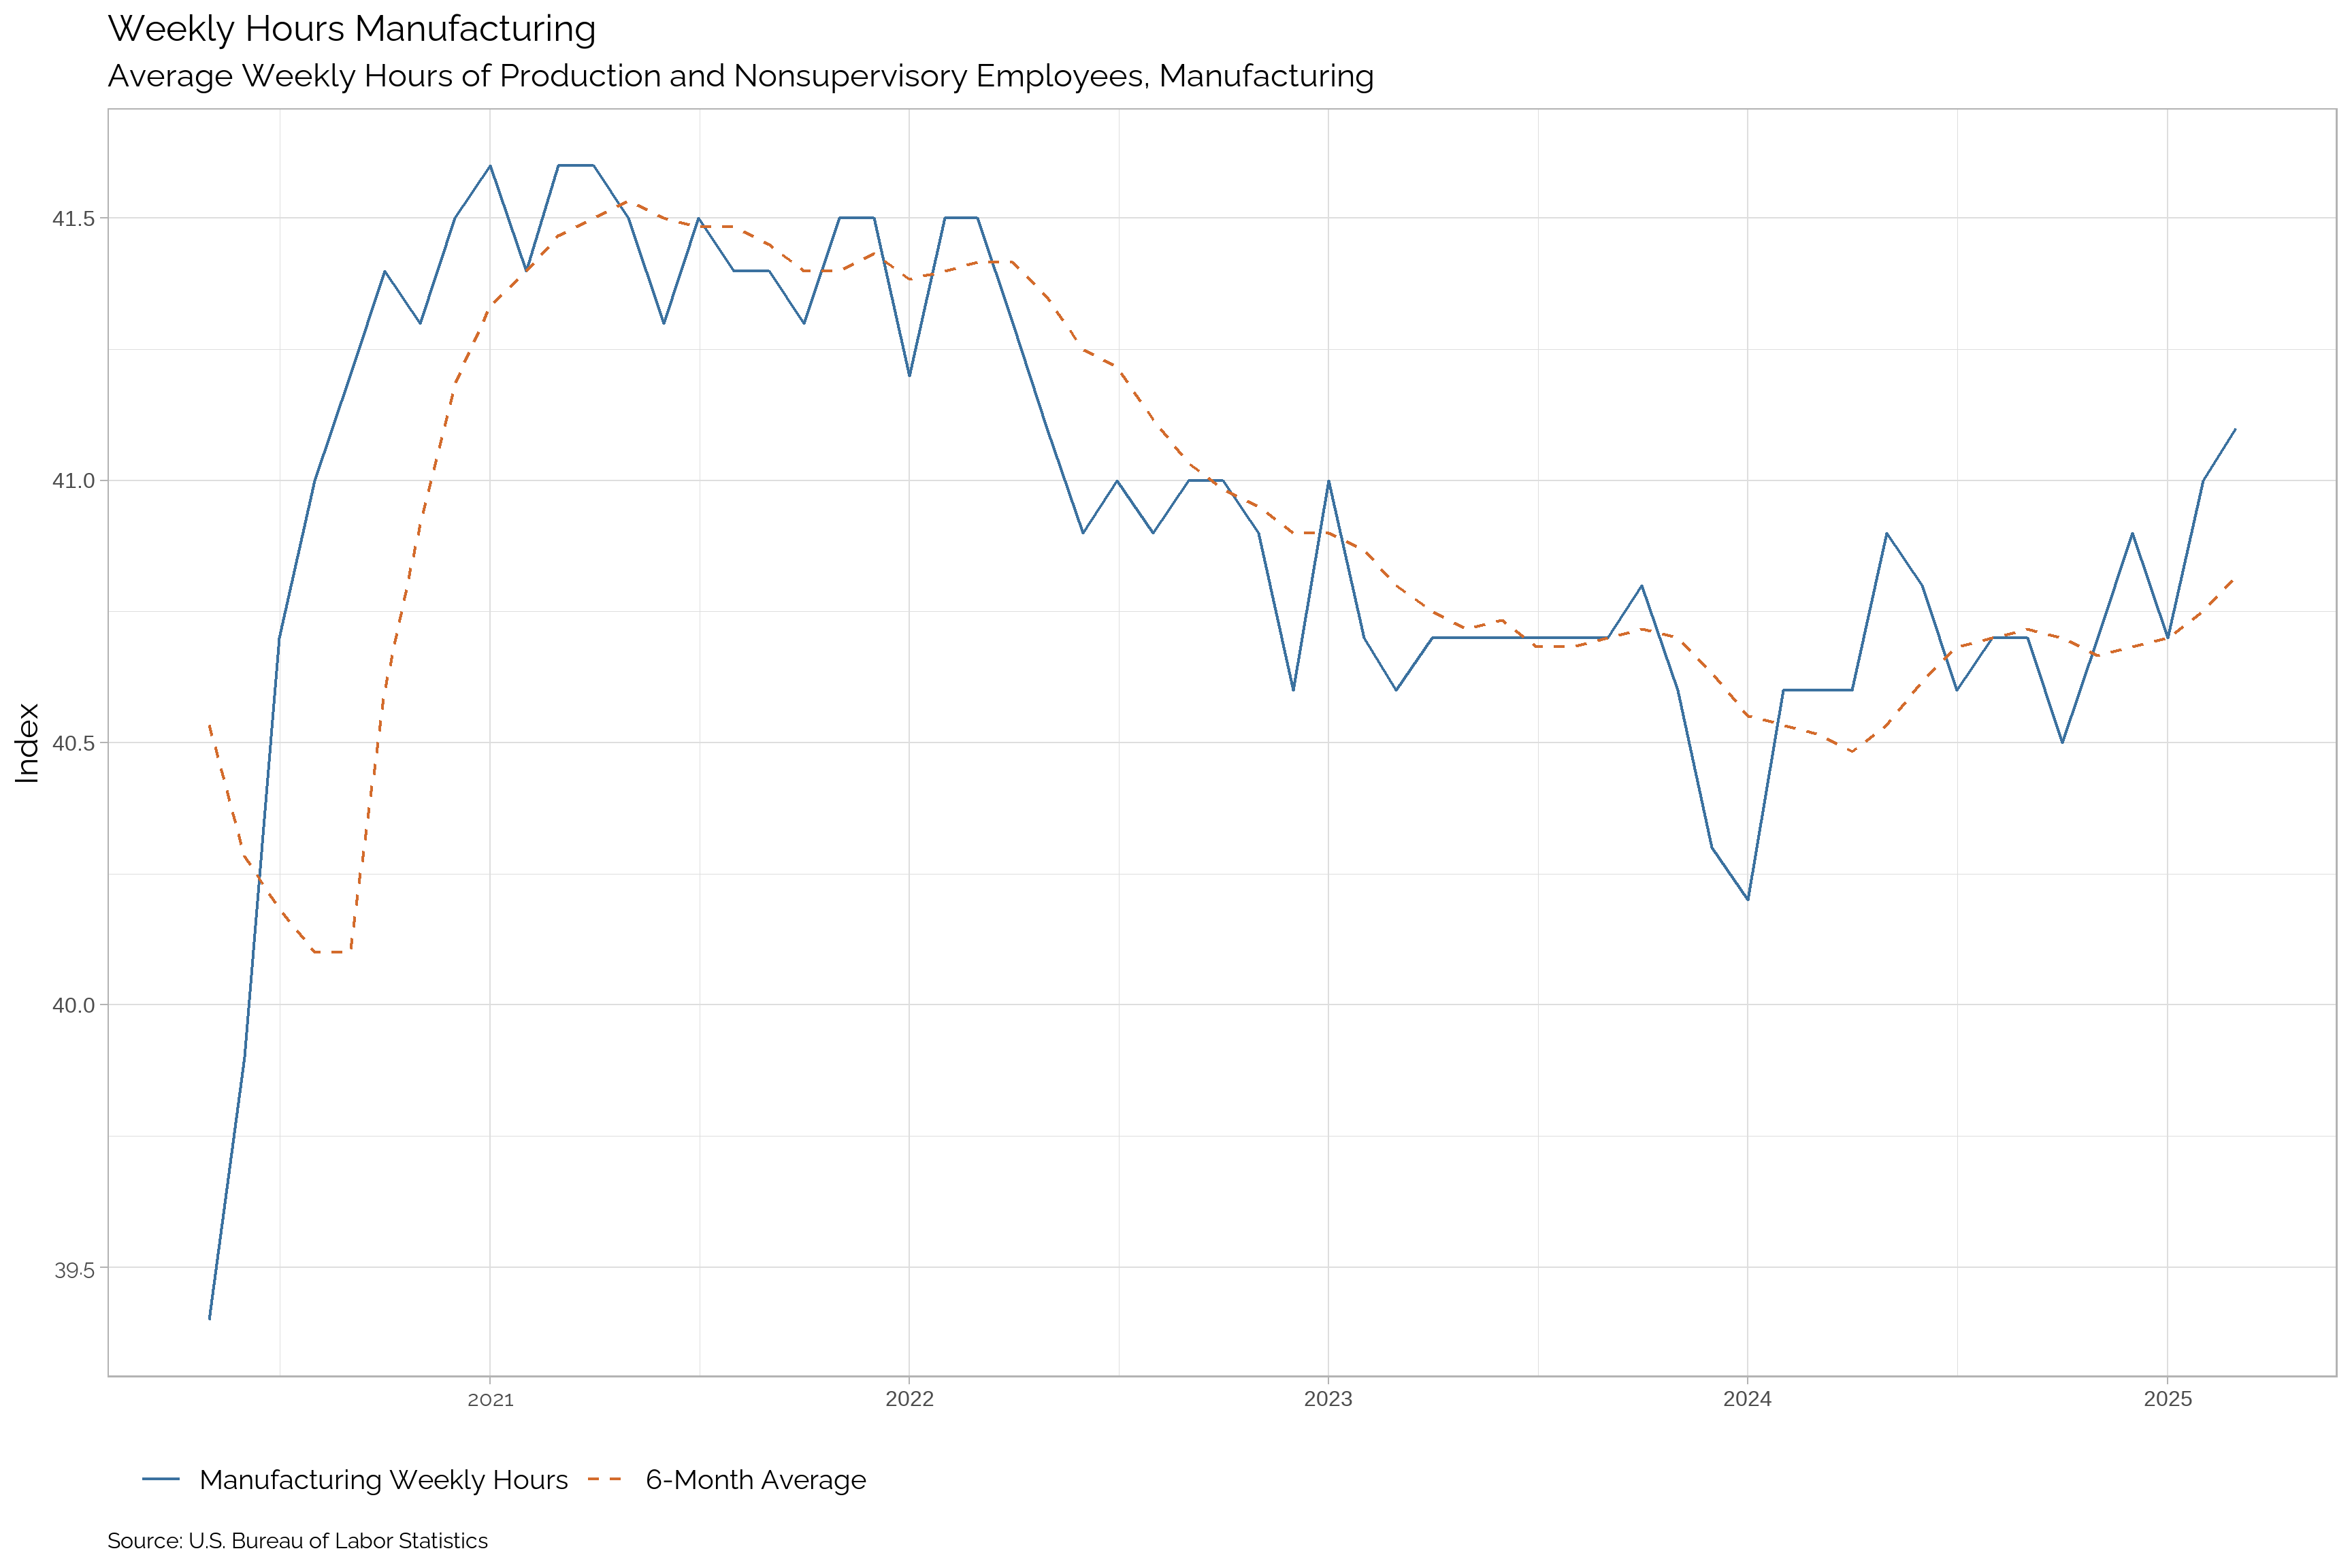
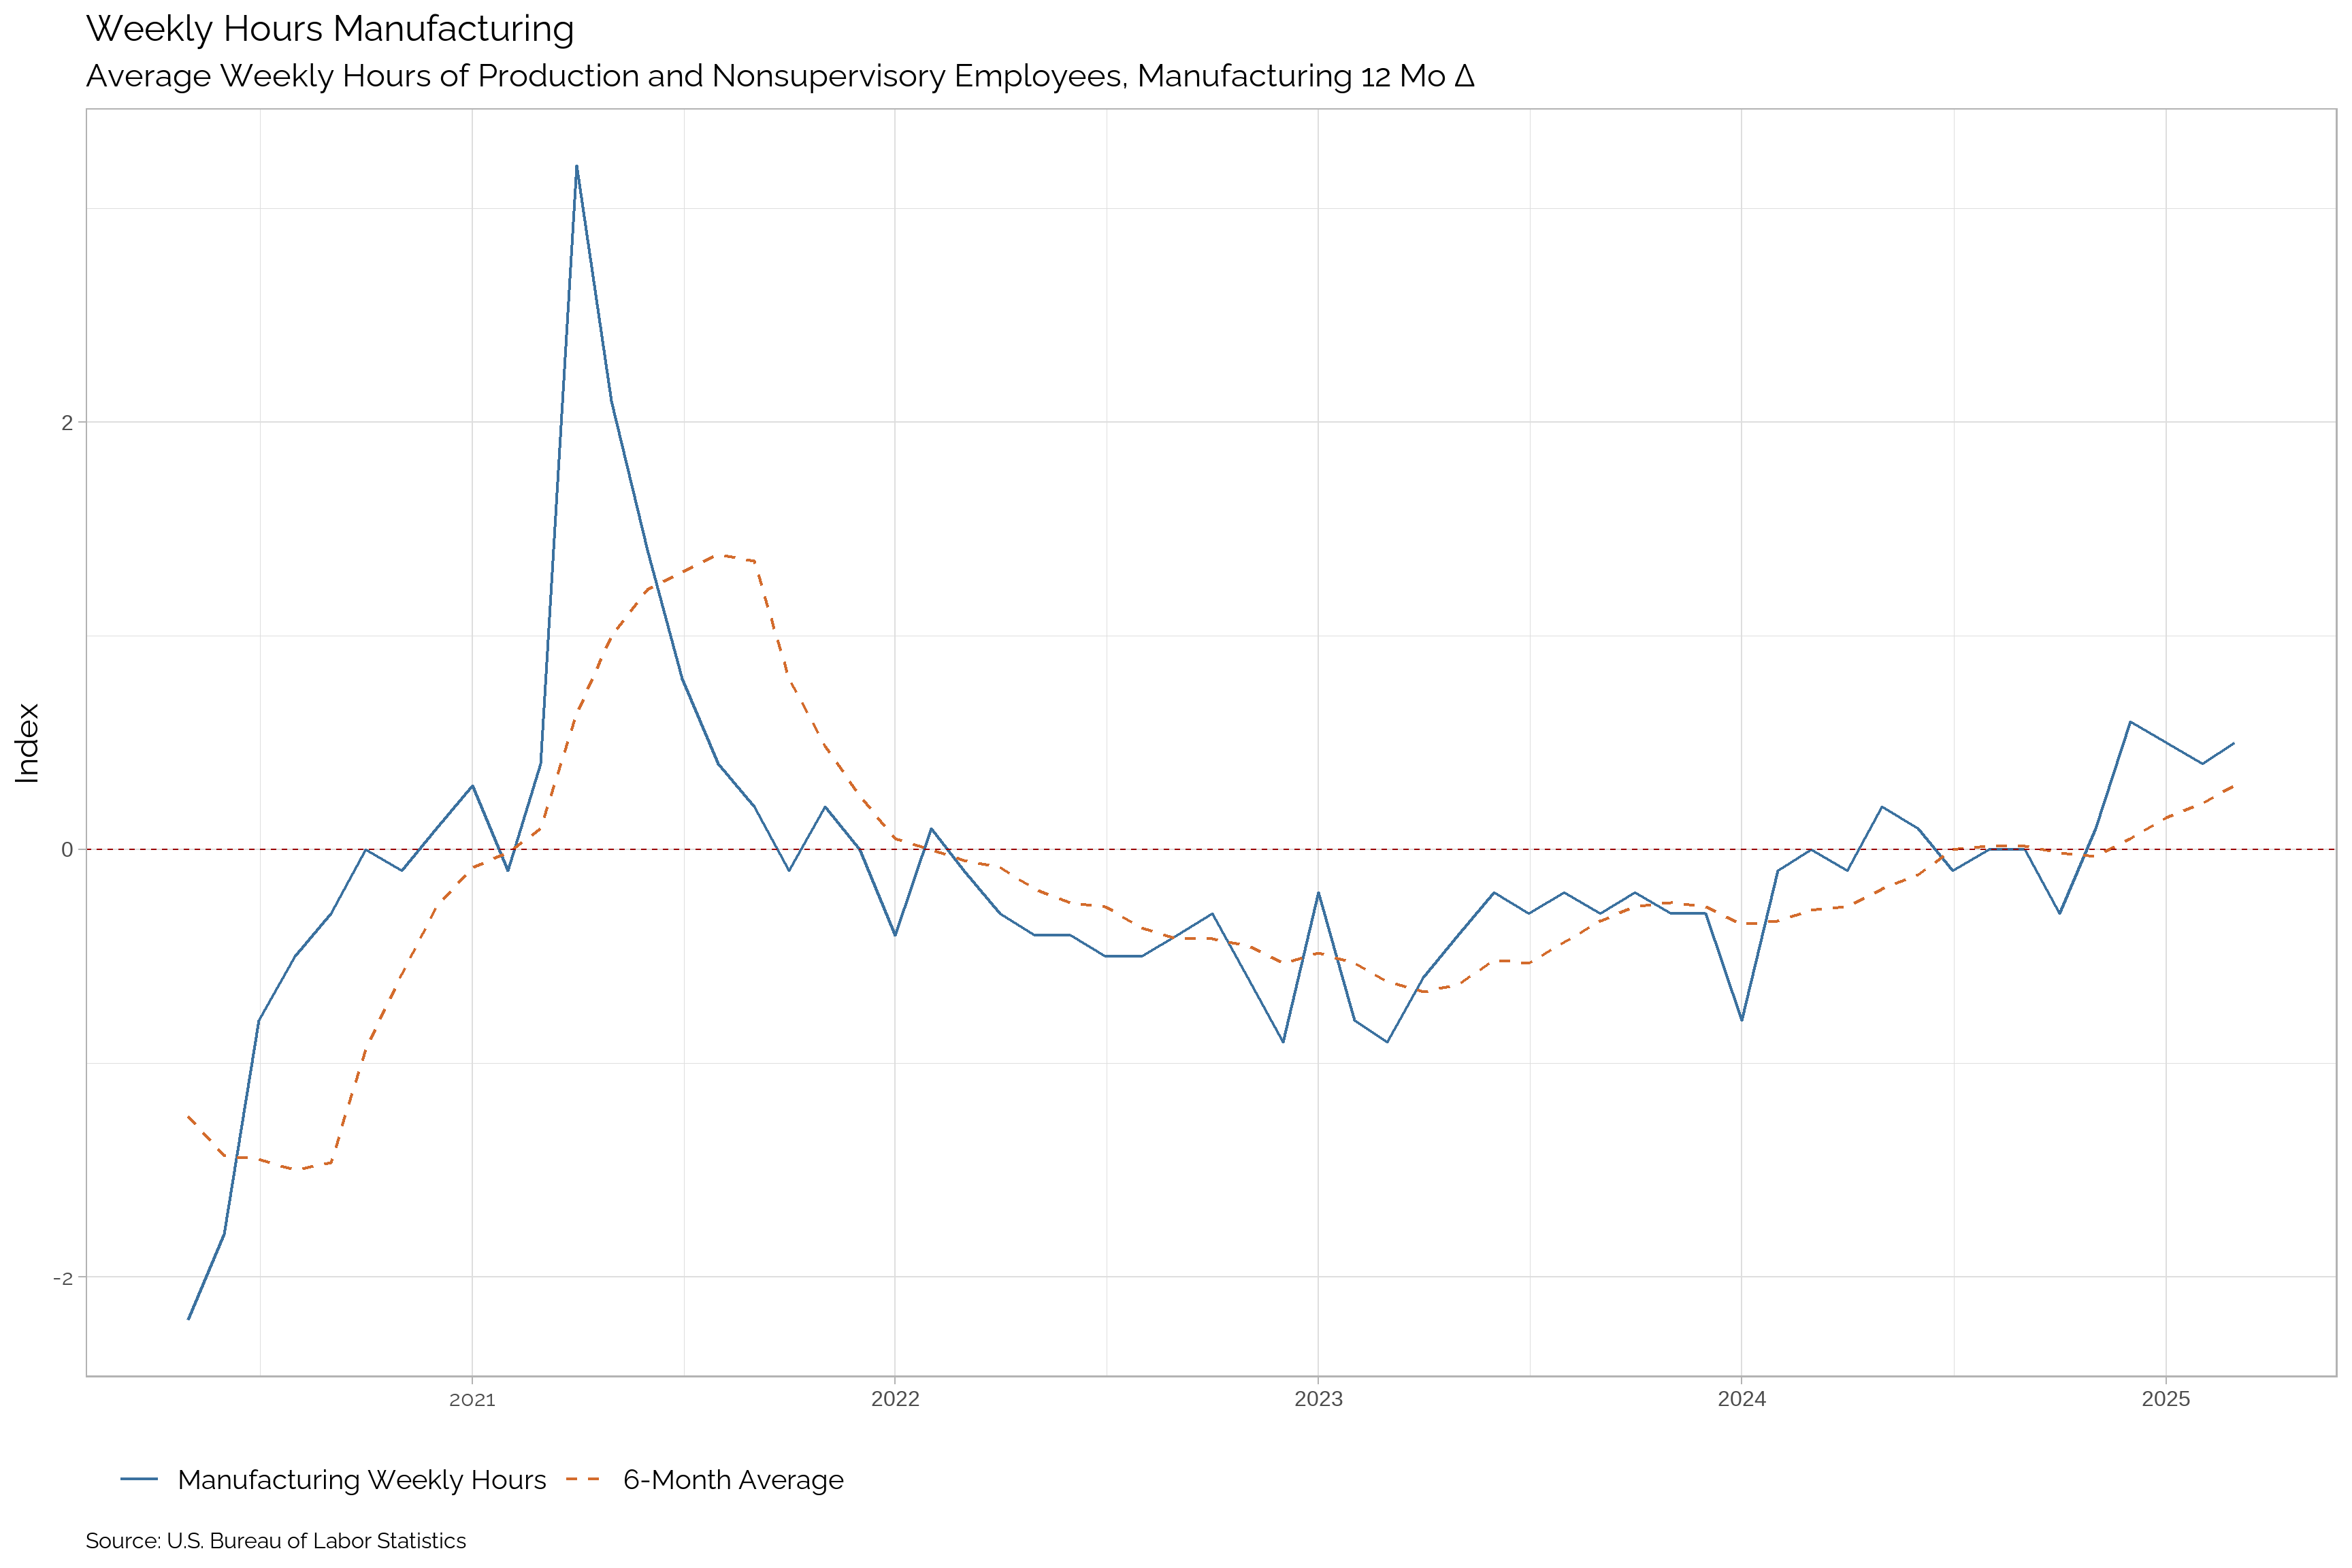
Manufacturing Weekly Hours
| Apr-25 | Mar-25 | Feb-25 | Jan-25 | Dec-24 | Nov-24 | Oct-24 | Sep-24 | Aug-24 | Jul-24 | Jun-24 | May-24 | |
|---|---|---|---|---|---|---|---|---|---|---|---|---|
| Manufacturing Weekly Hours | -- | 41.1 | 41 | 40.7 | 40.9 | 40.7 | 40.5 | 40.7 | 40.7 | 40.6 | 40.8 | 40.9 |
| Δ Change | -- | 0.1 | 0.3 | -0.2 | 0.2 | 0.2 | -0.2 | 0 | 0.1 | -0.2 | -0.1 | 0.3 |
| Percent Δ Change | -- | 0.24 | 0.74 | -0.49 | 0.49 | 0.49 | -0.49 | 0 | 0.25 | -0.49 | -0.24 | 0.74 |
| Yr/Yr Change | -- | 0.5 | 0.4 | 0.5 | 0.6 | 0.1 | -0.3 | 0 | 0 | -0.1 | 0.1 | 0.2 |
| Trend | -- | Up | Up | Up | Up | Up | Down | Down | Up | Down | Up | Up |
| Trend in Growth Rate | -- | Up | Up | Up | Up | Up | Down | Down | Down | Down | Up | Up |
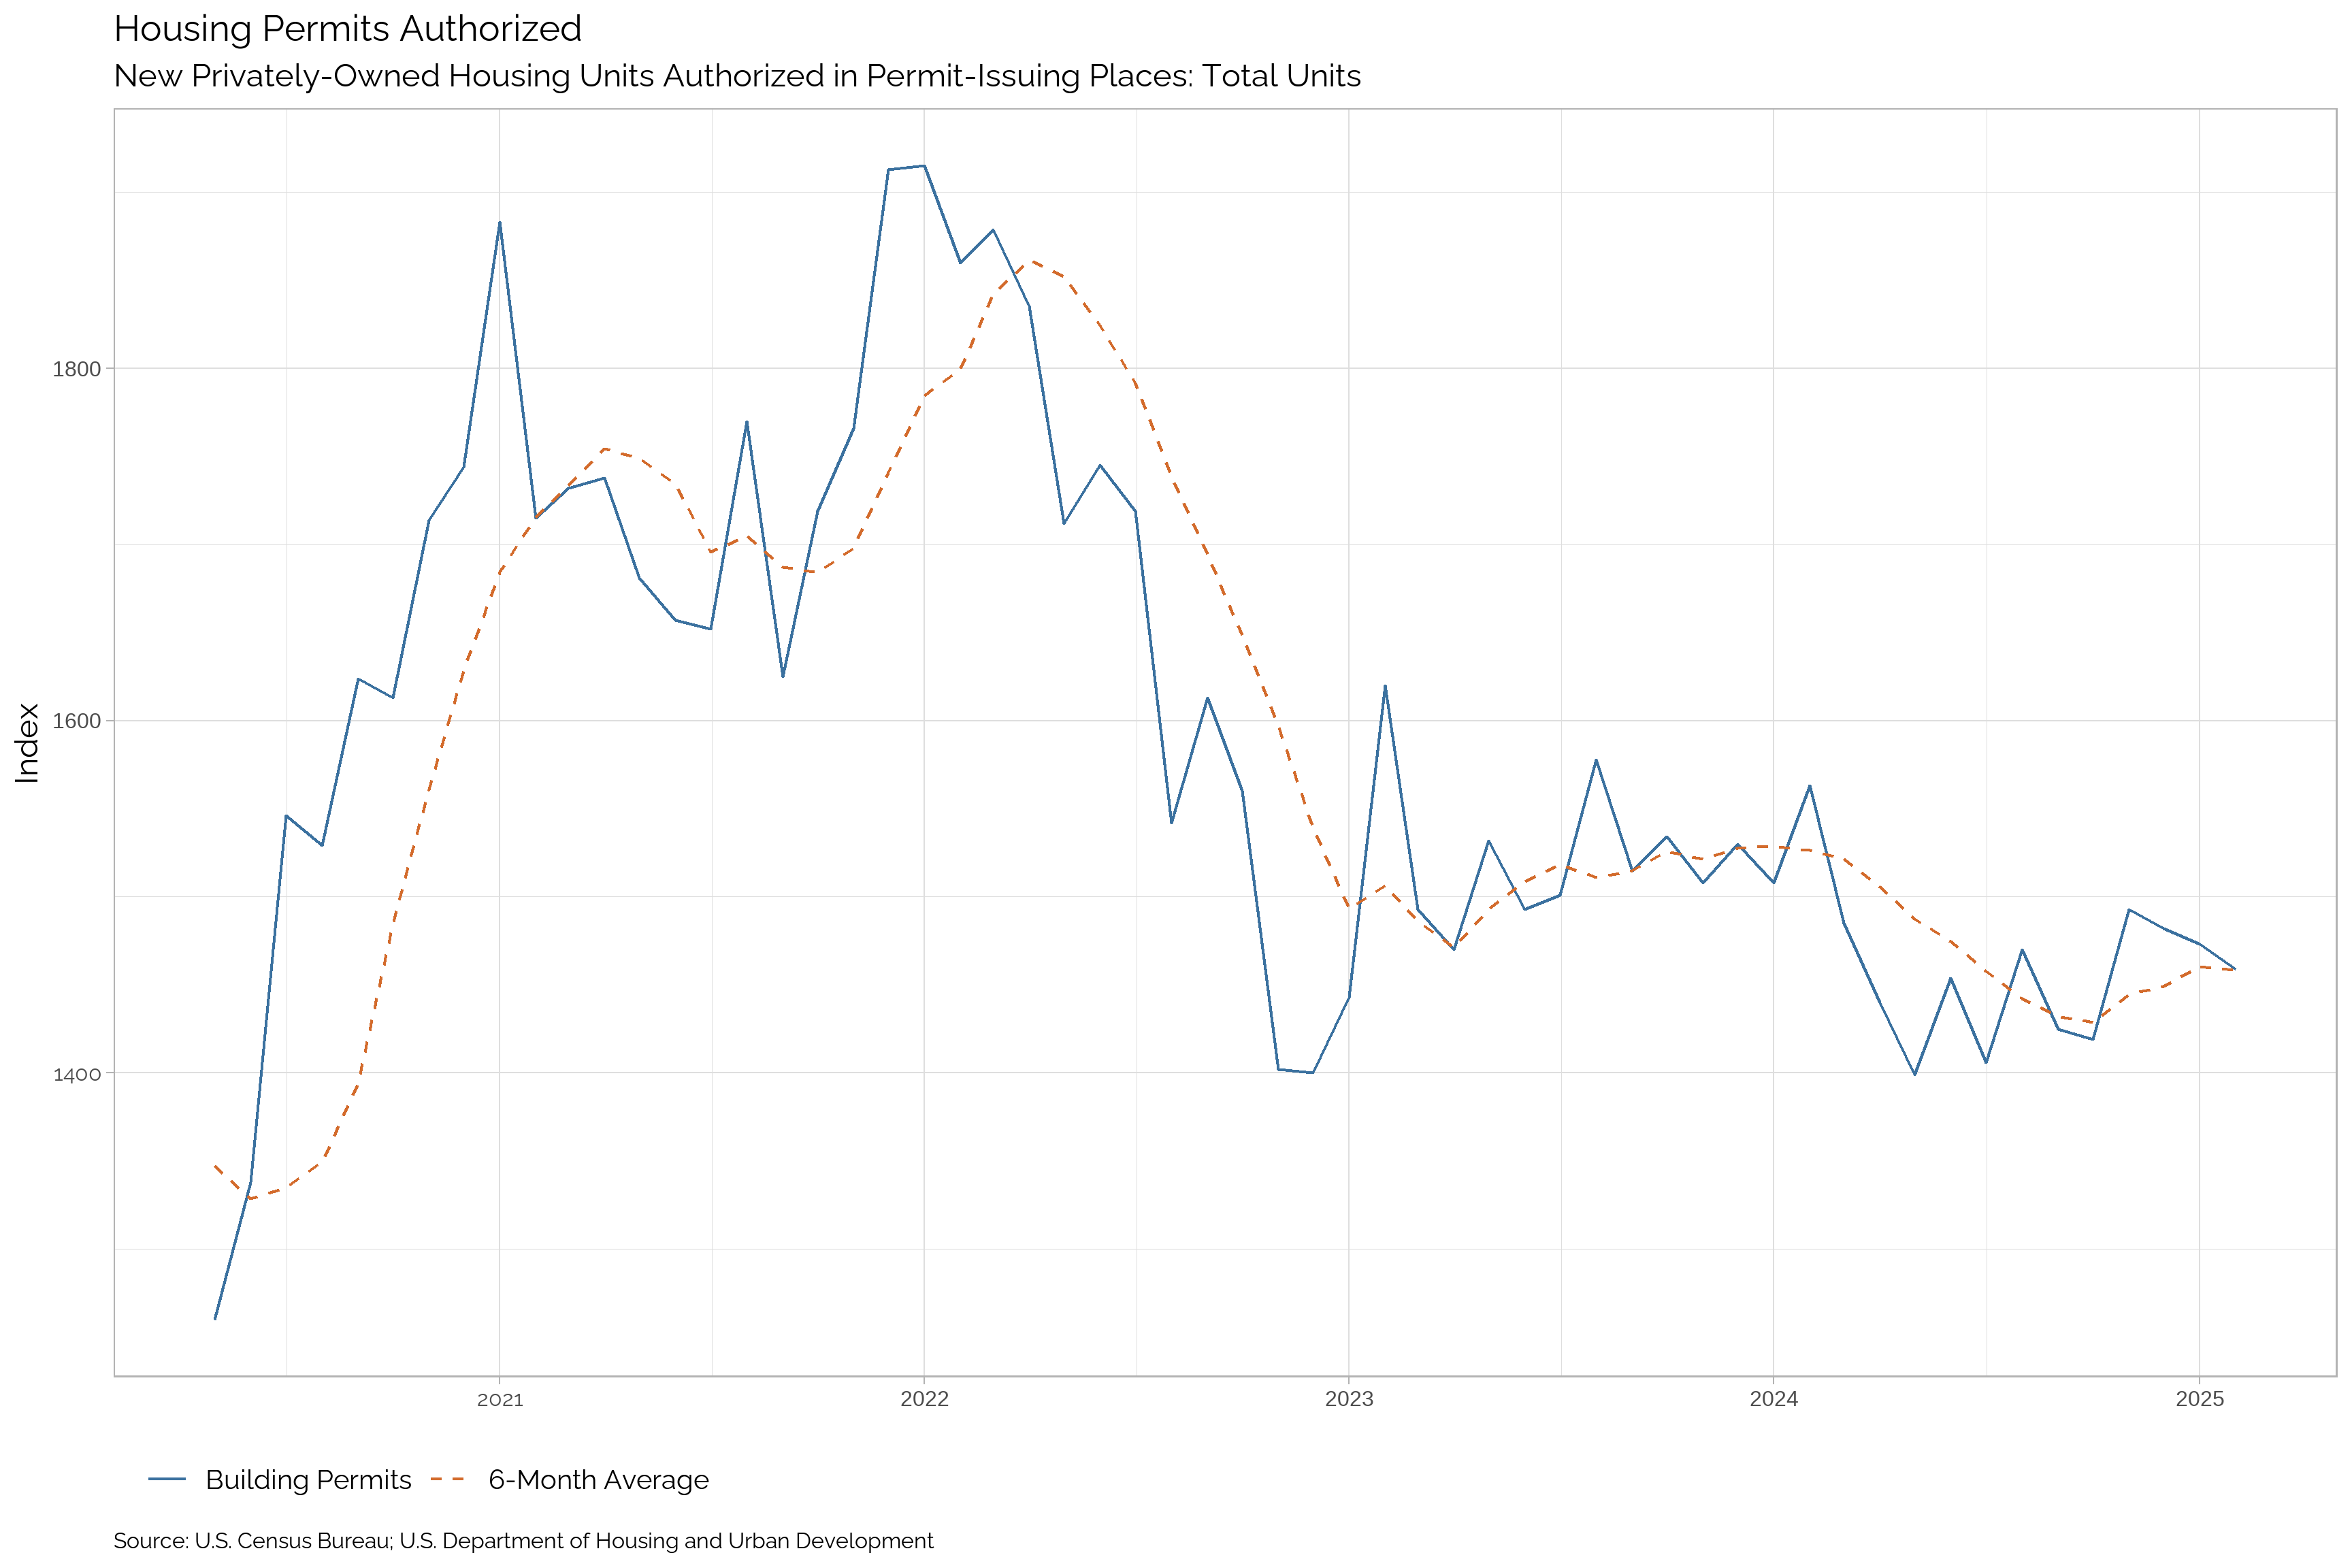
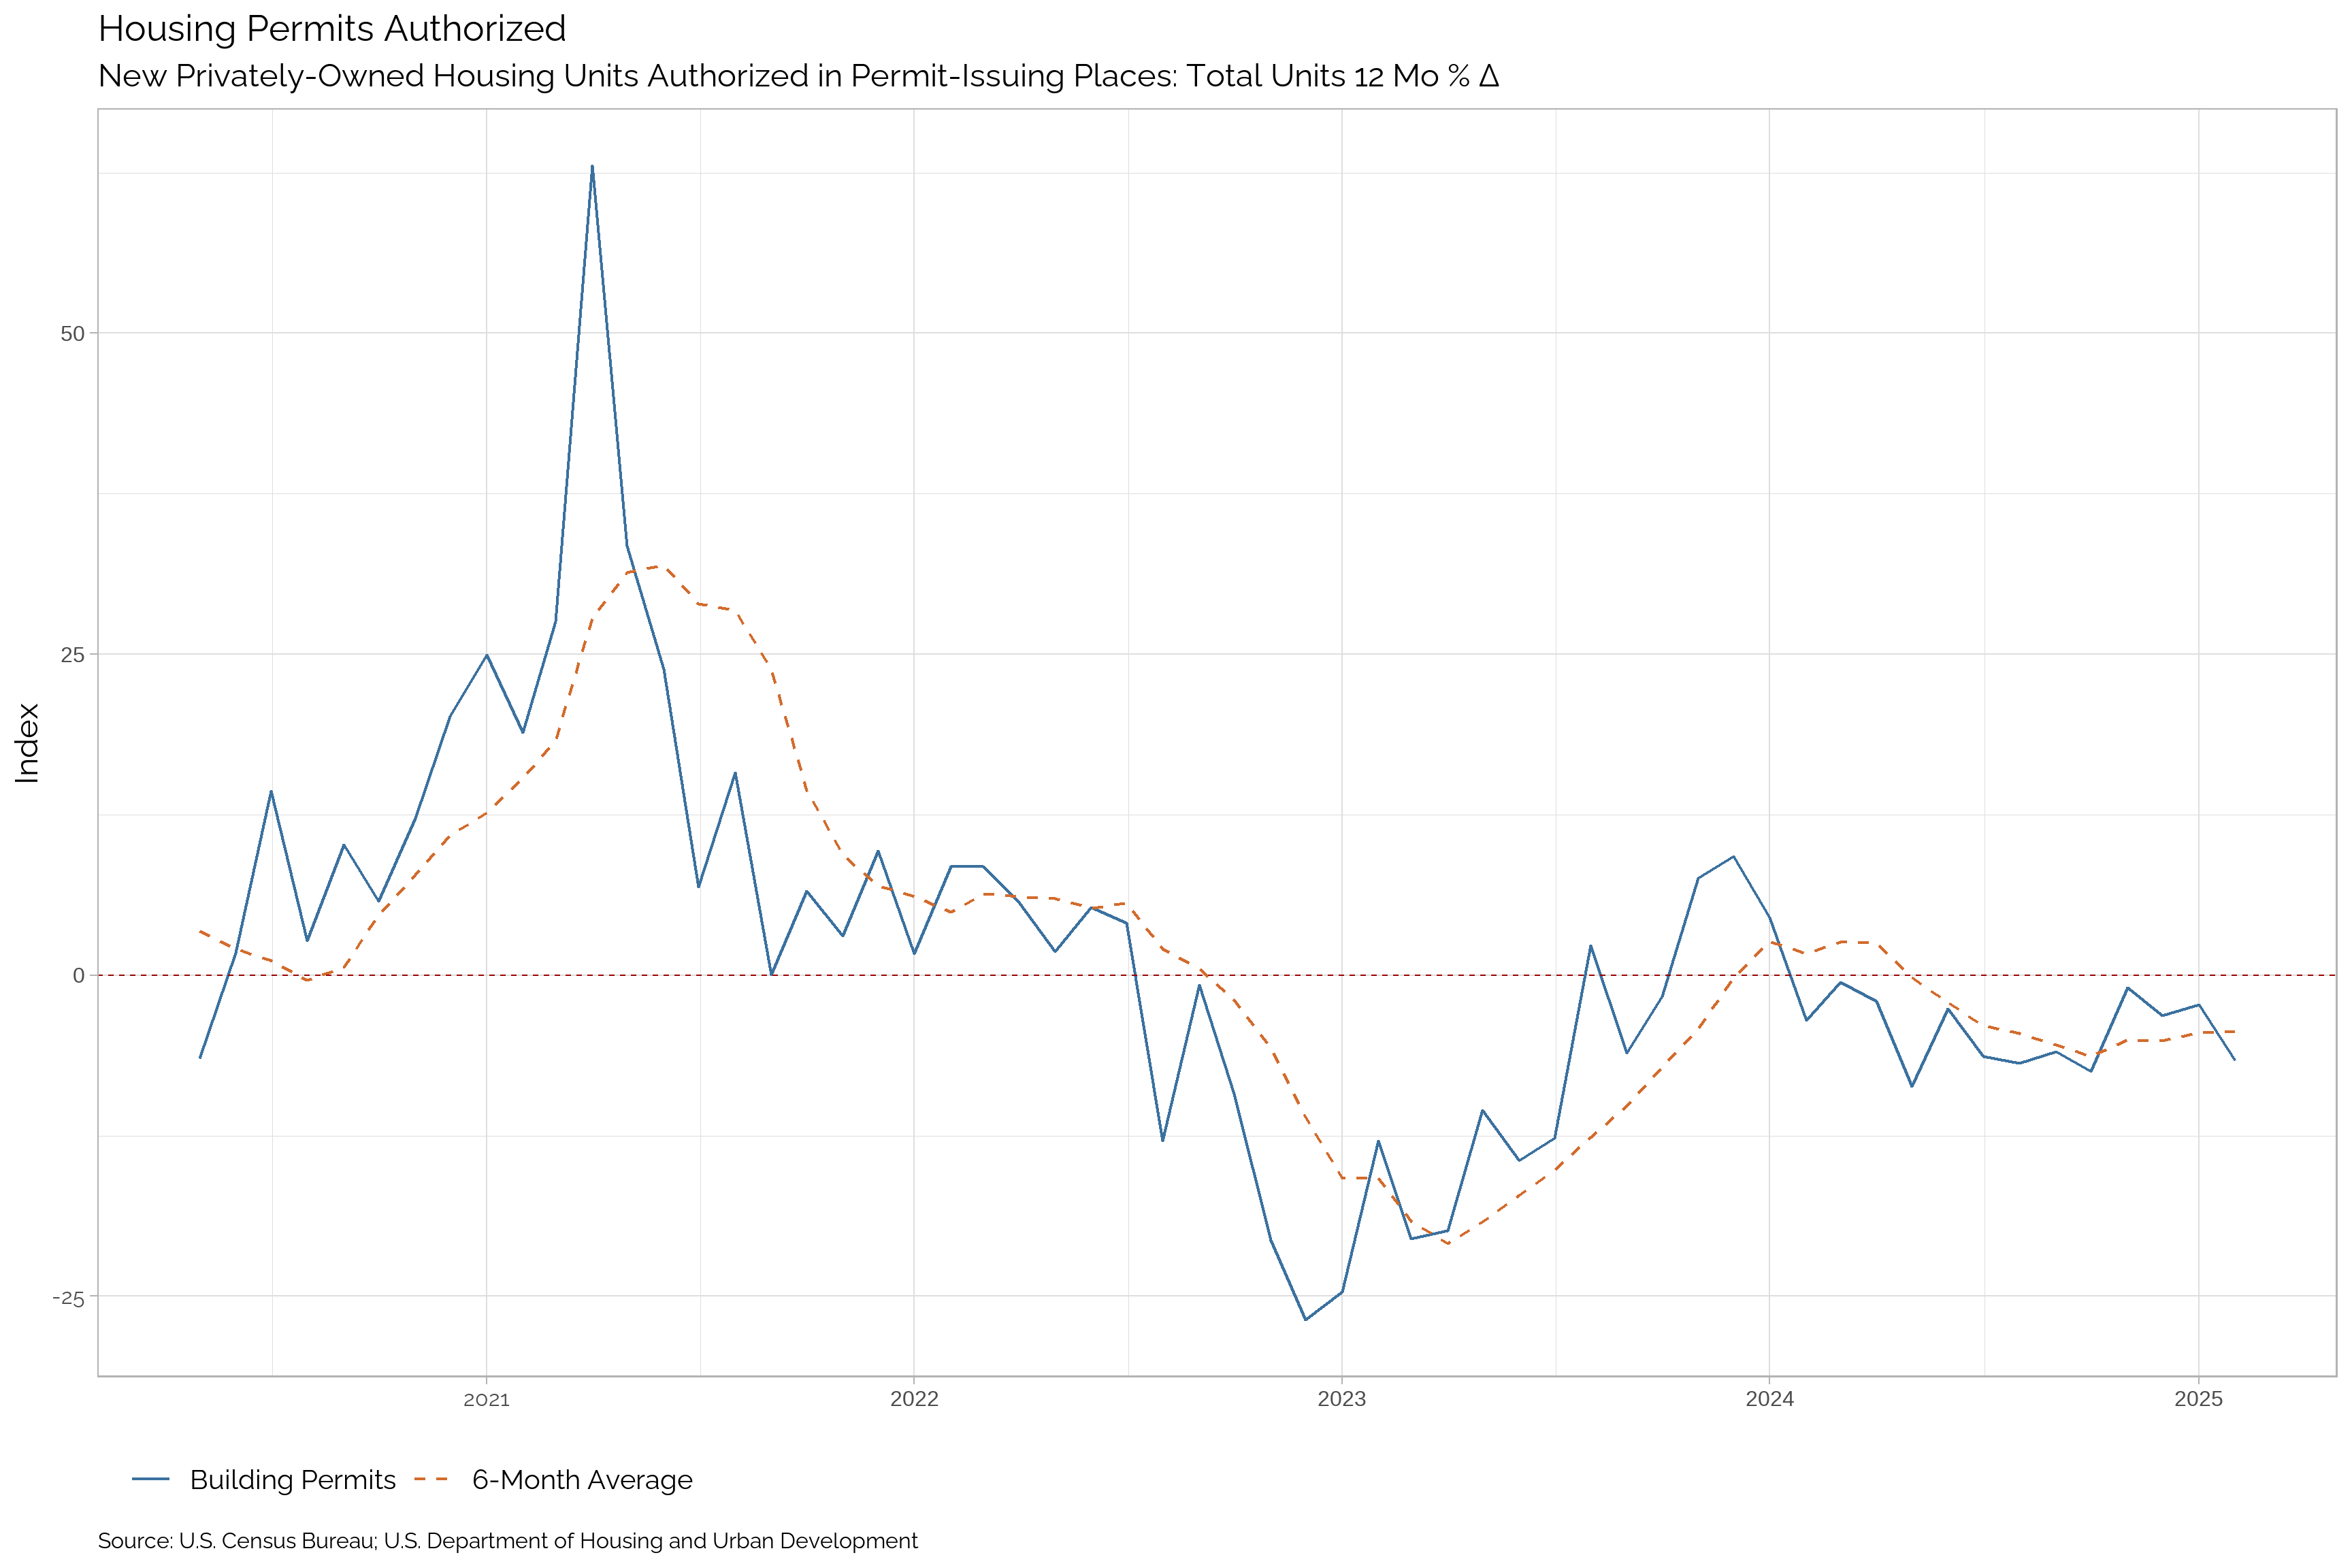
Building Permits
| Apr-25 | Mar-25 | Feb-25 | Jan-25 | Dec-24 | Nov-24 | Oct-24 | Sep-24 | Aug-24 | Jul-24 | Jun-24 | May-24 | |
|---|---|---|---|---|---|---|---|---|---|---|---|---|
| Building Permits | -- | -- | 1459 | 1473 | 1482 | 1493 | 1419 | 1425 | 1470 | 1406 | 1454 | 1399 |
| Δ Change | -- | -- | -14 | -9 | -11 | 74 | -6 | -45 | 64 | -48 | 55 | -41 |
| Percent Δ Change | -- | -- | -0.95 | -0.61 | -0.74 | 5.21 | -0.42 | -3.06 | 4.55 | -3.3 | 3.93 | -2.85 |
| Yr/Yr Change | -- | -- | -6.65 | -2.32 | -3.14 | -0.99 | -7.5 | -5.94 | -6.84 | -6.33 | -2.61 | -8.68 |
| Trend | -- | -- | Up | Up | Up | Up | Down | Down | Up | Down | Down | Down |
| Trend in Growth Rate | -- | -- | Down | Up | Up | Up | Down | Down | Down | Down | Down | Down |
Apendix
Note
Last Updated: April 07, 2025
Footnotes
The Leading Economic Indicator (LEI): Developed and published by The Conference Board, the LEI is a composite index of ten economic indicators. We have obtained the data from public data sets and the exact data my not match the official data. The Growth rate has been calculated as the percent change in the index value over the last 12 months. The preferred method for monitoring the LEI is to look at the Yr/Yr growth rate and the 6-month moving average of the growth rate. This provides a smoothed view of the data and helps to identify trends and shifts in the economy.↩︎
The S&P 500 Index: The S&P 500 Index is a product of S&P Dow Jones Indices LLC, a division of S&P Global, or its affiliates (“SPDJI”). Standard & Poor’s® and S&P® are registered trademarks of Standard & Poor’s Financial Services LLC, a division of S&P Global (“S&P”); Dow Jones® is a registered trademark of Dow Jones Trademark Holdings LLC (“Dow Jones”). The S&P 500 Index is a product of S&P Dow Jones Indices LLC and/or its affiliates. The S&P 500 Index is a product of S&P Dow Jones Indices LLC, a division of S&P Global, or its affiliates (“SPDJI”). Standard & Poor’s® and S&P® are registered trademarks of Standard & Poor’s Financial Services LLC, a division of S&P Global (“S&P”); Dow Jones® is a registered trademark of Dow Jones Trademark Holdings LLC (“Dow Jones”).↩︎
ISM New Orders: The ISM New Orders Index is a product of the Institute for Supply Management (ISM). The ISM New Orders Index is a key leading indicator of economic activity in the U.S. economy. It is a component of the ISM Manufacturing Report on Business, which is based on a survey of purchasing managers at more than 300 manufacturing firms. The New Orders Index is a forward-looking indicator that provides insight into future production levels and overall economic activity.↩︎
ISM Manufacturing PMI: The ISM Manufacturing PMI is a product of the Institute for Supply Management (ISM). The ISM Manufacturing PMI is a key leading indicator of economic activity in the U.S. economy. It is a component of the ISM Manufacturing Report on Business, which is based on a survey of purchasing managers at more than 300 manufacturing firms. The PMI is a forward-looking indicator that provides insight into future production levels and overall economic activity.↩︎