The Labor Cycle
To better understand how the labor cycle moves, it helps to understand the macroeconomic factors that influence the labor market. Mainly the factors that shape the labor supply and demand.
click to learn more
There is a cycle in the labor market that is influenced by monetary policy and the dual mandate.
This Labor Cycle is critical to understand the business cycle.
The Rythm of the Business Cycle and the Labor Market
No mater where the weakness is in the economy, if it is bad enough to move the economy into a recession, then the weakness is bad enough to move the labor market.
There is a clear link between economic growth and the labor market. Okun’s Law states that for every 1% increase in unemployment, GDP will be roughly an additional 2% lower than its potential Figure 1. This relationship is a key driver of the business cycle, with the Fed’s monetary policy decisions playing a critical role in shaping economic activity and market dynamics.
Actually, you can reasonably argue that a recession can not happen without a reasonable rise in unemployment.
This relationship links the labor market with the business cycle, while unemployment is considered to be a lagging indicator, it is the most important lagging indicator that confirms a recession.
Unemployment is the most important lagging indicator of the business cycle. It is a confirming indicator, that confirms without a doubt that a recession is occuring.
A rise in unemployment catches all meaningful weakness in the economy, no mater where it is.
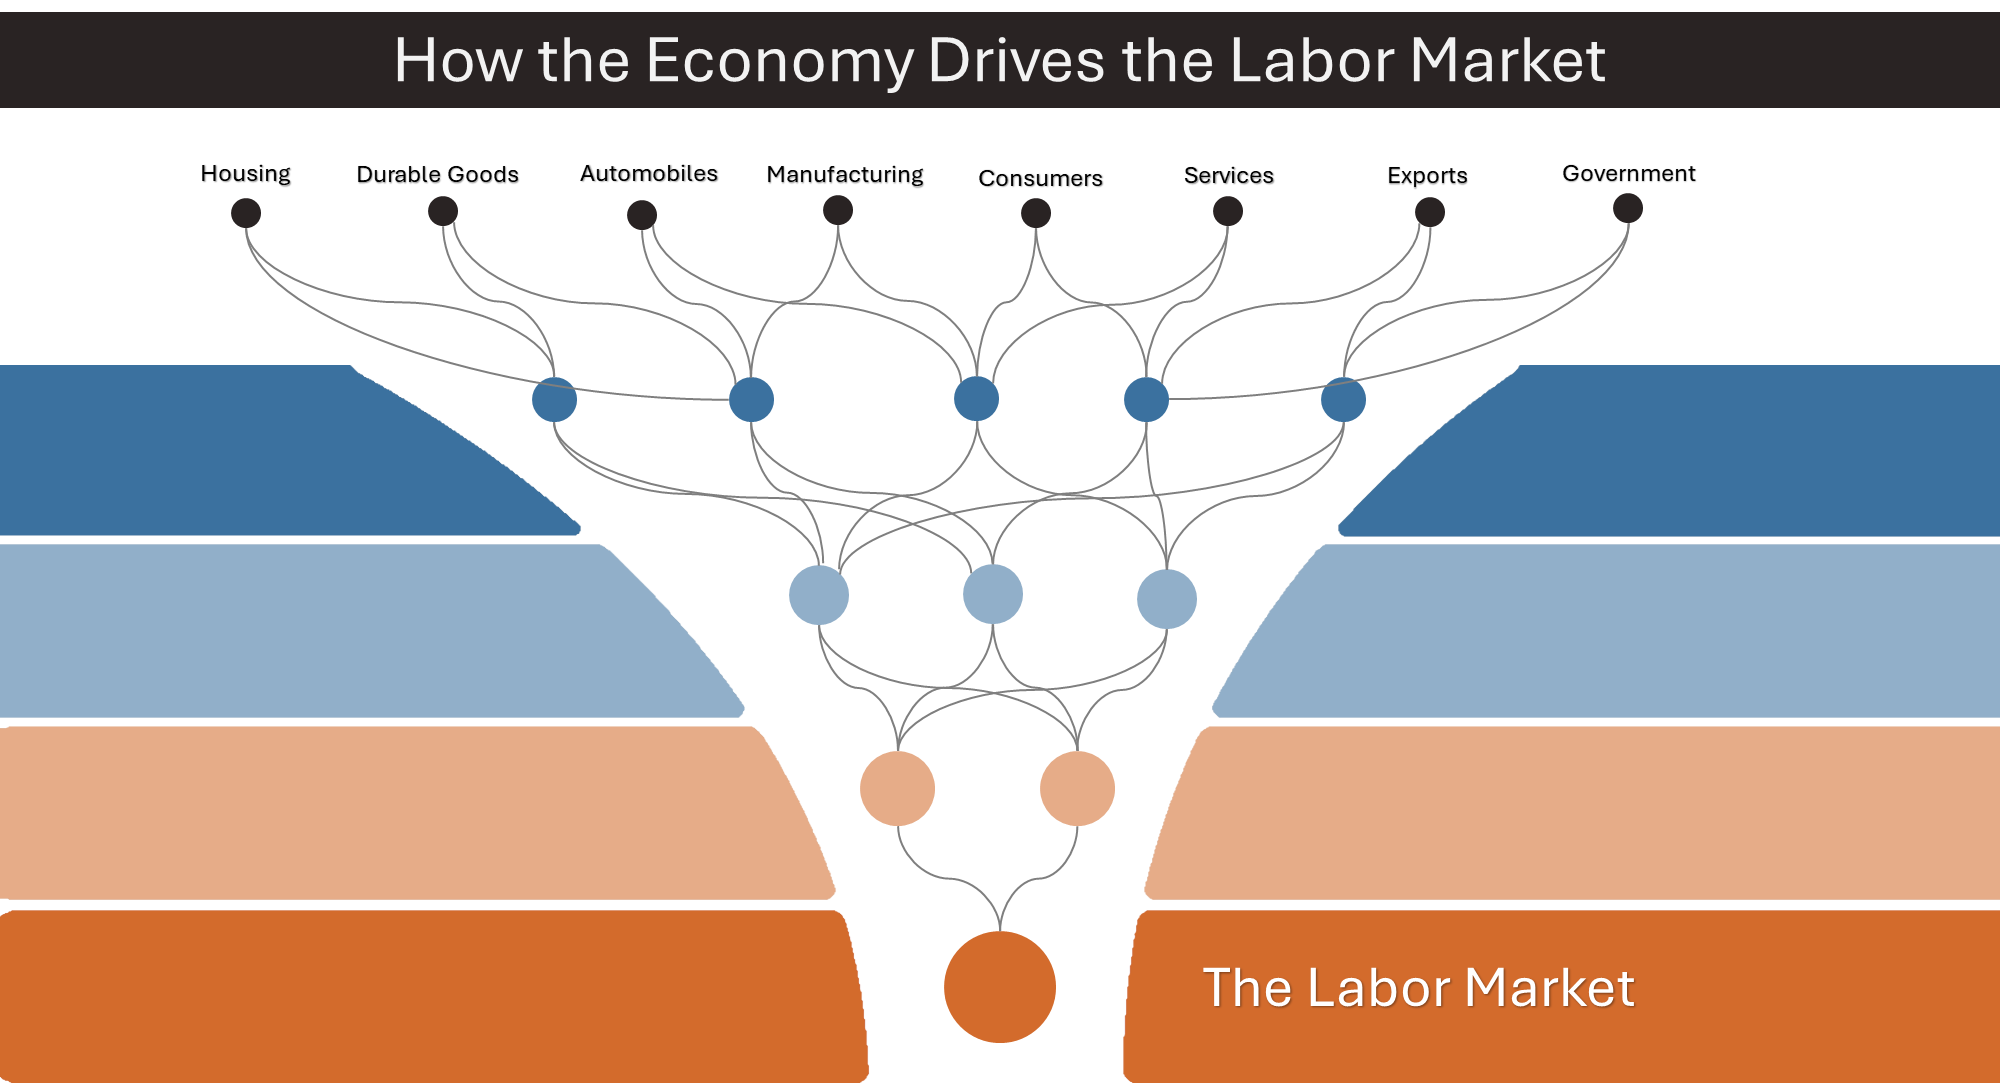
Okun’s laws exists because how the labor market catches any meaningful weakness in economic growth. Specifically, unemployment acts as a catch-all indicator, illustrated in the image below (Figure 2). Absorbing and revealing the cumulative impact of various economic forces. This cyclical nature, combined with its comprehensive sensitivity to economic shifts, makes the labor market a crucial barometer for understanding and forecasting the overall health of the economy.
Unemployment (U-3)
This important relationship between economic growth and unemployment creates a clear visable pattern between recessions and a rise in unemployment.
| Apr-25 | Mar-25 | Feb-25 | Jan-25 | Dec-24 | Nov-24 | Oct-24 | Sep-24 | Aug-24 | Jul-24 | Jun-24 | May-24 | |
|---|---|---|---|---|---|---|---|---|---|---|---|---|
| Δ in Unemployment | -- | 0.1 | 0.1 | -0.1 | -0.1 | 0.1 | 0 | -0.1 | 0 | 0.1 | 0.1 | 0.1 |
| Trend in Unemployment | -- | Up | Up | Dwn | Up | Up | Up | Up | Up | Up | Up | Up |
| 12-Month Change in Unemployment | -- | 0.3 | 0.2 | 0.3 | 0.3 | 0.5 | 0.2 | 0.3 | 0.5 | 0.7 | 0.5 | 0.4 |
| Apr-25 | Mar-25 | Feb-25 | Jan-25 | Dec-24 | Nov-24 | Oct-24 | Sep-24 | Aug-24 | Jul-24 | Jun-24 | May-24 | |
|---|---|---|---|---|---|---|---|---|---|---|---|---|
| Unemployment Rate | -- | 4.2 | 4.1 | 4 | 4.1 | 4.2 | 4.1 | 4.1 | 4.2 | 4.2 | 4.1 | 4 |
The labor market serves as a canary in the coal mine, often signaling economic weakness even when the specific source remains hidden. Whether a single sector falters or a broader slowdown takes hold, the labor market will ultimately capture these tremors through shifts in employment, wages, and labor force participation.
The Cyclical Nature of the Labor Gap: Identifying Tightness and Slack Through the Business Cycle
The labor market plays a central role in macroeconomic dynamics, influencing inflation, potential output, and overall economic health. A key indicator of labor market conditions is the labor gap, which measures the difference between the actual unemployment rate (U3) and the NROU. The NROU represents the equilibrium unemployment rate consistent with stable inflation, essentially the lowest sustainable level of unemployment in a healthy economy.
See Hayes (2022) for a comprehensive overview of labor market indicators.
A tight labor market, characterized by low unemployment and strong labor demand, often signals potential inflationary pressures. Conversely, a loose labor market, with higher unemployment and weaker labor demand, suggests economic slack and potential disinflationary or deflationary forces.
The NROU serves as a key benchmark for the Fed in evaluating labor market conditions. When the actual unemployment rate falls below the NROU, it indicates a tight labor market, potentially prompting the Fed to consider tightening monetary policy to prevent the economy from overheating. Conversely, an unemployment rate above the NROU suggests slack in the labor market, which may call for a more accommodative monetary policy to stimulate economic activity.
The labor Gap
This labor gap (Figure 7) exhibits cyclical behavior. During recessions, the gap widens as the unemployment rate rises, reflecting a weakening economy. In recoveries, the trend reverses, with the gap narrowing as the economy strengthens and unemployment declines. Late in the business cycle, the labor market typically tightens, potentially leading to inflationary pressures. As a recession approaches, the labor gap may begin to widen again, even if the unemployment rate remains below the NROU, signaling a loosening of labor market conditions.
By closely monitoring the labor gap and its cyclical dynamics, the Federal Reserve can make more informed decisions about monetary policy to achieve its dual mandate of price stability and maximum employment. Understanding the interplay between the labor gap and the business cycle provides valuable insights for policymakers, investors, and businesses navigating the complexities of the economic landscape.
| Apr-25 | Mar-25 | Feb-25 | Jan-25 | Dec-24 | Nov-24 | Oct-24 | Sep-24 | Aug-24 | Jul-24 | Jun-24 | May-24 | |
|---|---|---|---|---|---|---|---|---|---|---|---|---|
| The Labor Gap | -- | -0.12 | -0.22 | -0.32 | -0.22 | -0.12 | -0.22 | -0.22 | -0.12 | -0.12 | -0.22 | -0.32 |
| Apr-25 | Mar-25 | Feb-25 | Jan-25 | Dec-24 | Nov-24 | Oct-24 | Sep-24 | Aug-24 | Jul-24 | Jun-24 | May-24 | |
|---|---|---|---|---|---|---|---|---|---|---|---|---|
| Δ in Labor Gap | -- | 0.1 | 0.1 | -0.1 | -0.1 | 0.1 | 0 | -0.1 | 0 | 0.1 | 0.1 | 0.1 |
| Trend in Labor Gap | -- | Up | Up | Dwn | Up | Up | Up | Up | Up | Up | Up | Up |
| Tightness in Labor Gap | -- | Tight | Tight | Tight | Tight | Tight | Tight | Tight | Tight | Tight | Tight | Tight |
| 12-Month Change in Labor Gap | -- | 0.31 | 0.21 | 0.31 | 0.31 | 0.51 | 0.21 | 0.32 | 0.52 | 0.72 | 0.52 | 0.42 |
Momentum of Unemployment and the Sahm Rule
Understanding Unemployment Momentum
Unemployment momentum is a critical factor in economic analysis. A rapid rise in unemployment indicates a weakening economy, while a gradual decline suggests strength. The Sahm Rule helps assess this momentum by signaling a recession when the three-month moving average of the unemployment rate rises by 0.50 percentage points or more relative to its low 1 over the past year. This rule acts as an early warning system, often preceding other recession indicators.
While not foolproof, the Sahm Rule has a strong historical track record. However, it’s important to remember that it’s a lagging indicator and can sometimes generate false signals. Nonetheless, investors can use it to inform their decision-making. When the Sahm Rule triggers, it may be prudent to reduce exposure to cyclical assets, increase allocation to defensive assets like bonds and utilities, and bolster cash holdings to navigate the potential downturn.
The Sahm Rule
| Apr-25 | Mar-25 | Feb-25 | Jan-25 | Dec-24 | Nov-24 | Oct-24 | Sep-24 | Aug-24 | Jul-24 | Jun-24 | May-24 | |
|---|---|---|---|---|---|---|---|---|---|---|---|---|
| Sahm Rule, Level | -- | 0.27 | 0.27 | 0.37 | 0.4 | 0.4 | 0.4 | 0.5 | 0.57 | 0.53 | 0.47 | 0.43 |
| Apr-25 | Mar-25 | Feb-25 | Jan-25 | Dec-24 | Nov-24 | Oct-24 | Sep-24 | Aug-24 | Jul-24 | Jun-24 | May-24 | |
|---|---|---|---|---|---|---|---|---|---|---|---|---|
| Δ Sahm Rule | -- | 0 | -0.1 | -0.03 | 0 | 0 | -0.1 | -0.07 | 0.04 | 0.06 | 0.04 | 0.03 |
| Recession Warning | -- | -- | -- | -- | -- | -- | -- | Recession | Recession | Recession | -- | -- |
Summary
The labor market is intricately linked to the business cycle, acting as a coincident indicator that reflects the overall health of the economy. Unemployment serves as a crucial measure, consistently rising during recessions and capturing weaknesses across various sectors. Okun’s Law highlights the inverse relationship between unemployment and GDP growth, further emphasizing the labor market’s role in economic fluctuations. The labor gap, which measures the difference between actual unemployment and the natural rate of unemployment, provides insights into labor market tightness and potential inflationary pressures. Additionally, the Sahm Rule, based on unemployment momentum, serves as an early warning signal for potential recessions. Understanding these cyclical dynamics and indicators within the labor market is essential for policymakers, investors, and businesses to navigate the economic landscape effectively.
There are leading indicators that can provide insights into the labor market’s future direction.
click to learn more
References
Hayes, Adam. 2022. “Labor Market.” https://www.investopedia.com/terms/l/labor-market.asp.