The Supply and Demand Dynamics of the Labor Market
Summary
The labor market is a dynamic system influenced by a myriad of factors, including population growth, demographics, and technological advancements. Understanding the interplay between labor supply and demand is crucial for assessing the overall health of the labor market and the broader economy.
This article has explored the key dynamics of the labor market, focusing on the drivers of labor supply and demand, following the classic Supply and Demand model.
Key takeaways include:
- Labor Supply
- The working-age population is a critical driver of labor supply, with demographic trends shaping the overall labor pool.
- The labor force participation rate measures the proportion of the working-age population that is either employed or actively seeking work.
- Labor Demand
- Leading indicators like temporary help services, overtime hours, and business confidence surveys provide valuable insights into labor demand trends.
- Rising wages can signal a tightening labor market, with businesses competing for talent and driving up labor costs.
- P - Wages & Wage Growth
- Higher wages can result from a limited labor supply, with businesses competing for workers and driving up labor costs.
- Rising wages can fuel inflationary pressures if productivity growth fails to keep pace, prompting central banks to raise interest rates.
- Q - Quantity or Labor
- The quantity of labor employed reflects the number of workers hired by businesses, with shifts in labor supply and demand impacting employment levels.
- Understanding the dynamics of labor supply and demand is crucial for assessing the overall health of the labor market and the broader economy.
Introduction
The labor market is a fascinating and critical aspect of the broader economic landscape. The changes in the labor market influences Central Bank Policy around the world. In the United States the labor cycle is one of the two mandates that the Federal Reserve is responsible for. The other mandate is inflation. This makes the labor market extremely important to understand and monitor.
The labor market is a complex system that is influenced by many factors. The labor market is influenced by the business cycle, demographics, technology, and government policy. The labor market is also influenced by the global economy. from an asset management stand point, we want to know what the Federal Reserve thinks about the labor market, and make some future assumptions about the direction of the labor market in order to understand future Monetary Policy, and give us a warning of a recession occurring.
While complex, the labor market is also easy to comprehend when broken down into its core components. This article will explore the dynamics of the labor market, focusing on the interplay between labor supply and demand. We will also examine the key indicators that provide insights into labor market trends, such as the working-age population, labor force participation rate, and leading indicators of labor demand. Understanding these dynamics is crucial for assessing the overall health of the labor market and the broader economy.
The Labor Market Supply & Demand Dynamics
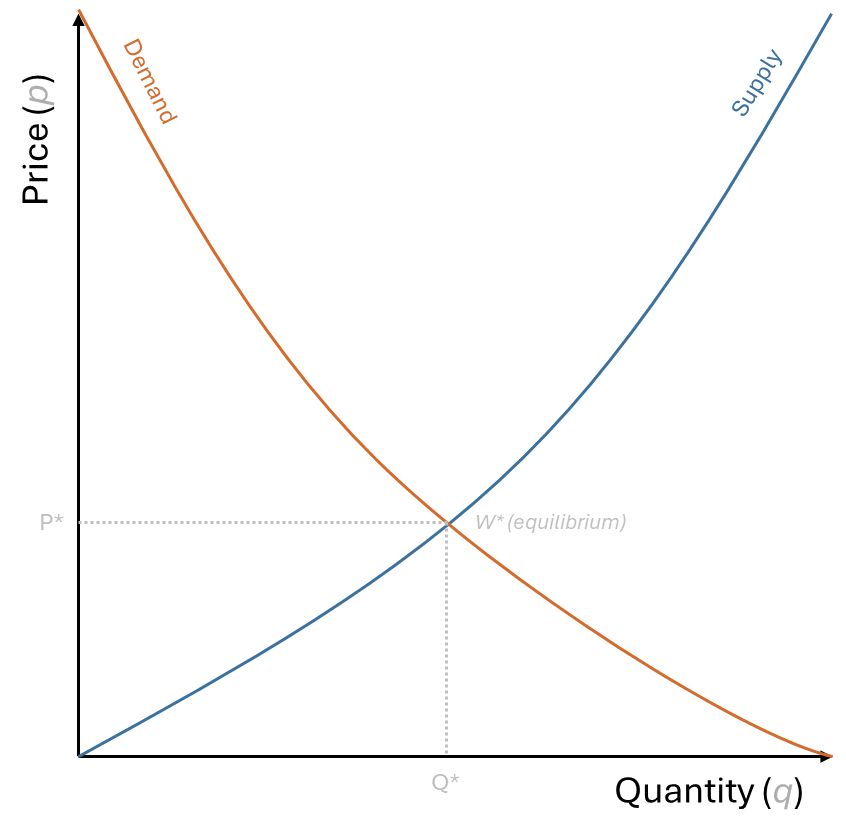
The labor market is a dynamic system where workers supply their services to employers who demand labor. The interaction between labor supply and demand determines the equilibrium wage rate and employment level. Key factors influencing labor supply and demand include:
- Labor Supply: The number of workers available for employment, influenced by population size, demographics, and labor force participation rates.
- Labor Demand: The number of workers businesses are willing to hire, driven by economic conditions, technological advancements, and industry growth.
- P - Wage Growth: The price of labor, determined by the intersection of labor supply and demand curves.
- Q - Employment: The quantity of labor employed, reflecting the number of workers hired by businesses.
Labor Supply
Labor supply considers demographic factors such as population growth, aging, and migration patterns. These factors can have a significant impact on the labor supply, as well as on long-term trends in the labor market.
The supply side of the labor market can be simplified to:
\[population \times labor \, force \, participation \, rate = labor \, supply\] where population is the total number of individuals in the working-age population, and labor force participation rate is the proportion of the working-age population that is either employed or actively seeking work.
Working Age Population
Age is the most dominant factor in driving consumption patterns.
The working-age population comprises individuals aged 16 to 64 who are available for employment.
Our model focuses on the age range between 25-64 based on there average spending by age cohort. Growth in this cohort is considered to be organic growth. This demographic group forms the foundation of the labor supply, with changes in population size and age distribution impacting the overall labor pool.
We focus on 25-64 Age Population,
- The smallest cohorts of housing and goods consumption is the youngest bracket and the oldest bracket.
- Most consumption comes from the ages between 25 & 64 which is the ultimate driver of an economy.
- When evaluating demographics, it is important to focus on the 25 to 64 population.
Working Age Population Growth
The growth rate of the working-age population is a key indicator of labor supply dynamics. A declining growth rate can signal challenges for economic growth and labor market stability. Long-term trends in population growth can have significant implications for economic growth.
Source: Organization for Economic Co-operation and Development
Imigration
OECD workforce population data incorporates net migration. No need to adjust figures further.
Labor Force Participation Rate
Knowing the growth rate of the working age population is important, but it is also important to know how many of those individuals are actually participating in the labor force. The labor force participation rate measures the proportion of the working-age population that is either employed or actively seeking work. A higher participation rate indicates a larger labor supply, while a lower rate suggests a smaller pool of available workers.
Labor Supply is a Secular Trend
Labor does not change quickly. It is a secular trend. It is important to understand the long-term trends in labor supply, as they can have significant implications for economic growth and labor market dynamics. However, shocks in labor supply can have significant inpacts to the cyclical nature of the labor market, examples of this includes the drop in labor force participation during the pandemic.
The more cyclical trends in the labor market is labor demand.
Labor Demand
Labor demand is driven by economic growth, technological advancements, and industry trends. Understanding the factors that influence labor demand is crucial for assessing the overall health of the labor market. The main indicators of labor demand include job openings, hiring trends.
Leading Indicators to Labor Demand
Leading indicators are essential for getting ahead of economic shifts!
Temporary Help Services: This indicator tracks the number of temporary workers employed by staffing agencies. An increase in temporary help services can signal growing labor demand, as businesses often hire temporary workers before committing to permanent hires. Conversely, a decline in temporary help services may indicate a weakening labor market.
This often serves as a leading indicator. Companies frequently use temporary workers to meet short-term demand before committing to permanent hires. Growth in this sector can suggest that businesses anticipate increased future demand for labor.
Overtime Hours, specifically in manufacturing: This indicator tracks the number of hours worked by employees beyond their standard workweek. An increase in overtime hours can signal growing labor demand, as businesses require additional work from existing employees to meet demand. Conversely, a decline in overtime hours may indicate a weakening labor market.
Surveys like the ISM Manufacturing and Non-Manufacturing Indices include components that specifically ask businesses about their expectations for future employment.
These forward-looking assessments can provide valuable insights into labor demand trends.
Omega’s Leading Employment Index (OLEI) is a proprietary indicator that combines multiple labor market indicators to provide a comprehensive view of labor demand. The OLEI is designed to capture the underlying trends in the labor market and provide early signals of shifts in employment conditions.
Coinicident Indicators to Labor Demand
Coincident indicators provide a real-time snapshot of labor market conditions. These indicators can help investors gauge the current state of labor demand and employment trends.
Job Openings: This is a direct measure of how many positions employers are actively trying to fill. The Bureau of Labor Statistics (BLS) provides monthly data on job openings through its Job Openings and Labor Turnover Survey (JOLTS). A high number of job openings generally signals strong labor demand. It’s a key indicator of labor demand. A high number of job openings can signal a strong labor market, with businesses actively seeking workers. Conversely, a low number of job openings may indicate a weaker labor market, with fewer opportunities available for job seekers.
Nonfarm Payrolls: This monthly report from the BLS tracks the net change in employment across various sectors (excluding agriculture). A robust increase in nonfarm payrolls indicates businesses are hiring, pointing to healthy labor demand. Conversely, a decline in payrolls may signal a weakening labor market.
Price - Wages
Wage growth is a key indicator of labor market health. Rising wages can signal a tightening labor market, as businesses compete for workers. Conversely, stagnant or declining wages may indicate a loosening labor market, with more workers than jobs available.
Quantity of Labor
The final piece in the labor market puzzle is the quantity of labor employed. This metric provides a real-time snapshot of how many workers are currently employed. A robust increase in employment can signal strong labor demand, while a decline may indicate weakening demand.
In the labor market’s supply and demand model, “Labor Quantity” represents the number of workers employed at a given wage rate. It’s the point where the labor supply curve (how many people are willing to work at a specific wage) intersects with the labor demand curve (how many workers businesses want to hire at that wage). This intersection determines the equilibrium quantity of labor in the market.
Total Employment
Total Employment: This is a broad measure of how many people are currently employed in the economy. The BLS provides monthly data on total employment through its Current Employment Statistics (CES) survey. A robust increase in total employment can signal strong labor demand, while a decline may indicate weakening demand.
Unemployment Rate
The unemployment rate is a key metric that provides insights into labor market conditions. It measures the percentage of the labor force that is unemployed and actively seeking work. A declining unemployment rate generally indicates a tightening labor market, with more job opportunities available. Conversely, a rising unemployment rate may signal a weakening labor market, with fewer job prospects for workers.
Shifts in Supply and Demand
Shifts in labor supply and demand are crucial to monitor because they directly impact wages, employment levels, and overall economic health. These shifts can be triggered by various factors, including technological advancements, demographic changes, government policies, and economic cycles.
A Decrease in Labor Supply
Labor supply, typically a secular trend, doesn’t change rapidly. However, shocks to the labor pool can occur, leading to significant economic consequences. The COVID-19 pandemic serves as a prime example. It triggered a sharp decline in labor force participation as lockdowns and health concerns forced many individuals out of the workforce. This sudden contraction in labor supply, coupled with a slow recovery in participation rates, has created a persistent worker shortage.
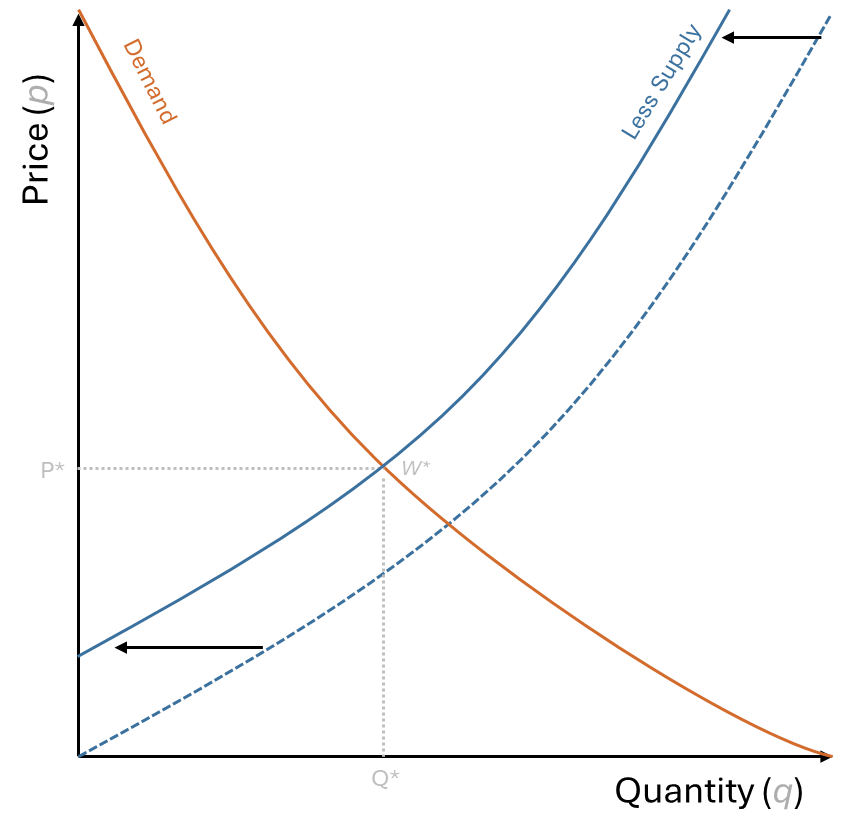
As depicted in the graph Figure 15, this decrease in labor supply is represented by a leftward shift of the supply curve. This shift results in a higher equilibrium wage (W’) and a lower equilibrium quantity of labor employed (Q’). Essentially, businesses are now competing for a smaller pool of workers, driving up wages. Which can be seen in Figure 10. We can expect to see continued upward pressure on wages as employers strive to attract and retain talent. This may manifest in higher salaries, enhanced benefits, and increased workplace flexibility.
However, this situation raises concerns about potential inflationary pressures. If wage growth outpaces productivity growth, businesses may pass on those increased labor costs to consumers in the form of higher prices. This dynamic can create a wage-price spiral, contributing to broader inflation.
Therefore, it’s essential to monitor productivity trends closely. If productivity growth fails to keep up with wages, we could see a resurgence of inflation. This could force central banks to raise interest rates, impacting borrowing costs, corporate profits, and asset valuations. Such a scenario would have significant implications for investment strategy, requiring adjustments to asset allocation and risk management approaches.
The Pandemic’s shock to labor supply
The COVID-19 pandemic significantly disrupted labor supply. Lockdowns and health concerns drove down labor force participation, while the “Great Resignation” saw workers seeking better opportunities. Long-term effects include potential permanent exits from the workforce and shifts in sectoral demand. This “missing worker” phenomenon continues to tighten the labor market and pressure wages upwards.
The Outcome of a Labor Supply Shock: Higher Wages, Lower Employment
A sudden decrease in labor supply, such as that experienced during the pandemic, creates a ripple effect throughout the labor market. Two primary outcomes emerge:
Higher Wages: With fewer workers available, businesses are forced to compete more intensely for talent. This drives up wages as employers offer higher salaries, better benefits, and more flexible arrangements to attract and retain employees. This can be particularly pronounced in sectors experiencing rapid growth or facing skill shortages.
Lower Employment: While higher wages might seem positive, a shrinking labor supply can also lead to lower overall employment levels. Businesses may struggle to fill open positions, leading to reduced production, slower economic growth, and potentially even job losses in some sectors. This can create a challenging environment for job seekers, particularly those with less experience or in-demand skills.
A Decrease in the Demand for Labor
A decrease in labor demand typically occurs during periods of economic weakness, when businesses reduce their workforce due to declining sales or uncertainty about the future. This can also be driven by technological advancements that automate tasks previously performed by humans, or by shifts in consumer preferences that reduce demand for certain goods and services.
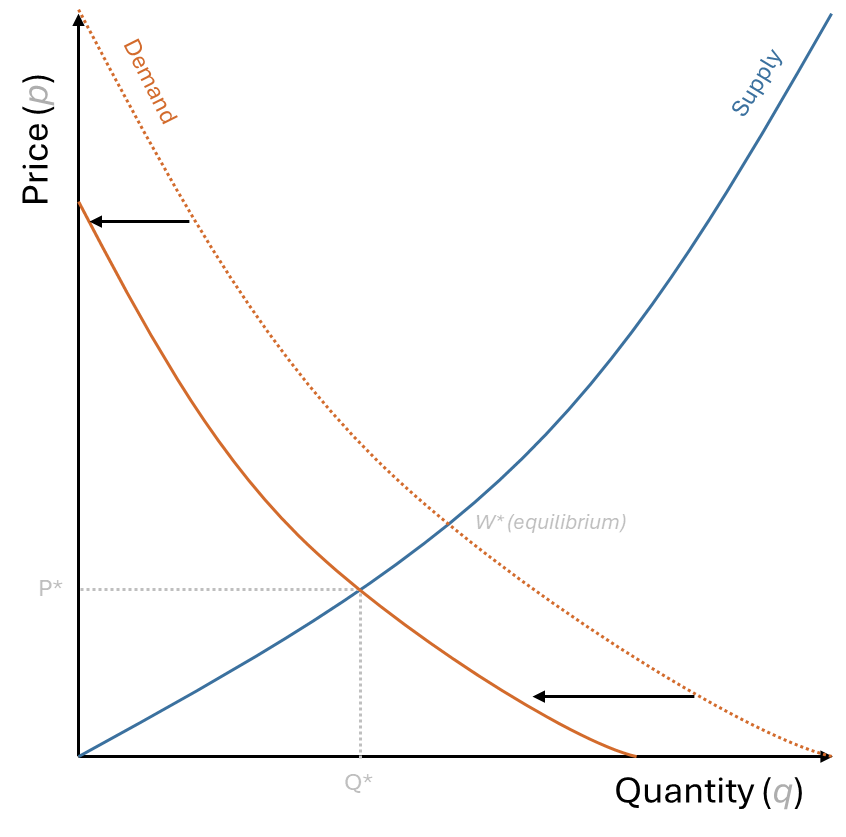
As illustrated in the graph Figure 16, a decrease in labor demand shifts the demand curve to the left. This results in a lower equilibrium wage (W’) and a lower equilibrium quantity of labor employed (Q’). Essentially, with fewer jobs available, workers may be willing to accept lower wages, and some may become unemployed.
This situation can have a cascading effect on the economy. Lower wages can reduce consumer spending, further dampening demand for goods and services. Higher unemployment can lead to social challenges and strain government resources. Moreover, a decrease in labor demand can signal an impending economic slowdown or even a recession.
Monitoring indicators of labor demand, such as job openings, nonfarm payrolls, and business confidence surveys, is crucial for anticipating these shifts. Recognizing a decline in labor demand can help businesses adjust their hiring plans, policymakers implement appropriate economic support measures, and investors position their portfolios defensively.
Resulting in a Loose Labor Market
A loose labor market occurs when labor supply exceeds demand. Key factors include:
Economic Slowdown: A recession or economic downturn forces businesses to cut jobs, increasing unemployment. Automation: Technological advancements can displace workers, leading to job losses in certain sectors. Globalization: Increased competition from overseas can result in job losses in domestic industries. Impacts of a Loose Labor Market
Lower Wages: With fewer job opportunities, workers may have to accept lower pay. Reduced Bargaining Power for Workers: Workers have less leverage in negotiating terms of employment. Deflationary Pressures: Decreased consumer spending due to job losses and wage stagnation can put downward pressure on prices. Connecting to Investment Strategies
A Increase in the Demand for Labor
An increase in labor demand typically occurs during periods of economic expansion, when businesses are confident about the future and actively seek to expand their workforce. This surge in demand for labor can be driven by several factors:
- Robust Economic Growth: A booming economy fuels business expansion, leading to increased production, new investments, and a surge in job openings.
- Technological Advancements: While some technologies can displace workers, others create new opportunities and increase demand for skilled labor in areas like software development, data analysis, and artificial intelligence. Increased Consumer Spending: Rising consumer confidence and spending create a need for more workers to produce and deliver goods and services.
- Government Policies: Fiscal policies, such as infrastructure spending or tax cuts, can stimulate business investment and create new jobs.
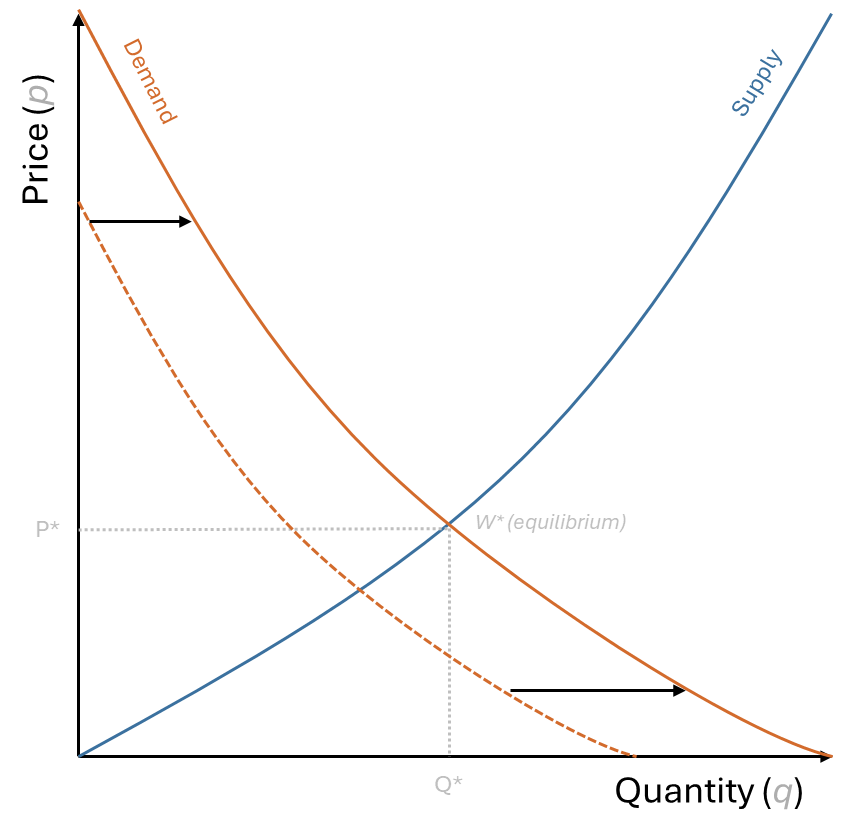
As labor demand increases, the demand curve shifts to the right. This results in a higher equilibrium wage and a higher equilibrium quantity of labor employed. In essence, businesses compete for a limited pool of workers, driving up wages and potentially leading to a tight labor market.
This scenario can have positive implications for the economy. Higher wages boost consumer spending and contribute to economic growth. Increased employment levels reduce unemployment and improve living standards. However, it’s important to monitor potential inflationary pressures. If wage growth outpaces productivity gains, it could lead to higher prices for goods and services.
Resulting in a tight labor market
A tight labor market emerges when demand for labor surpasses the available supply. Several factors contribute to this:
Economic Growth: A booming economy fuels businesses to expand, creating a surge in job openings. Technological Advancements: New technologies can boost productivity, driving demand for skilled workers. Demographic Shifts: Changes in population size or age distribution can impact the labor pool. Impacts of a Tight Labor Market
Higher Wages: With more jobs than workers, employers compete for talent by offering higher salaries and benefits. Increased Bargaining Power for Workers: Workers gain leverage to negotiate better working conditions and benefits. Inflationary Pressures: Rising wages can contribute to increased consumer spending, potentially leading to inflation. How the Labor Market Loosens