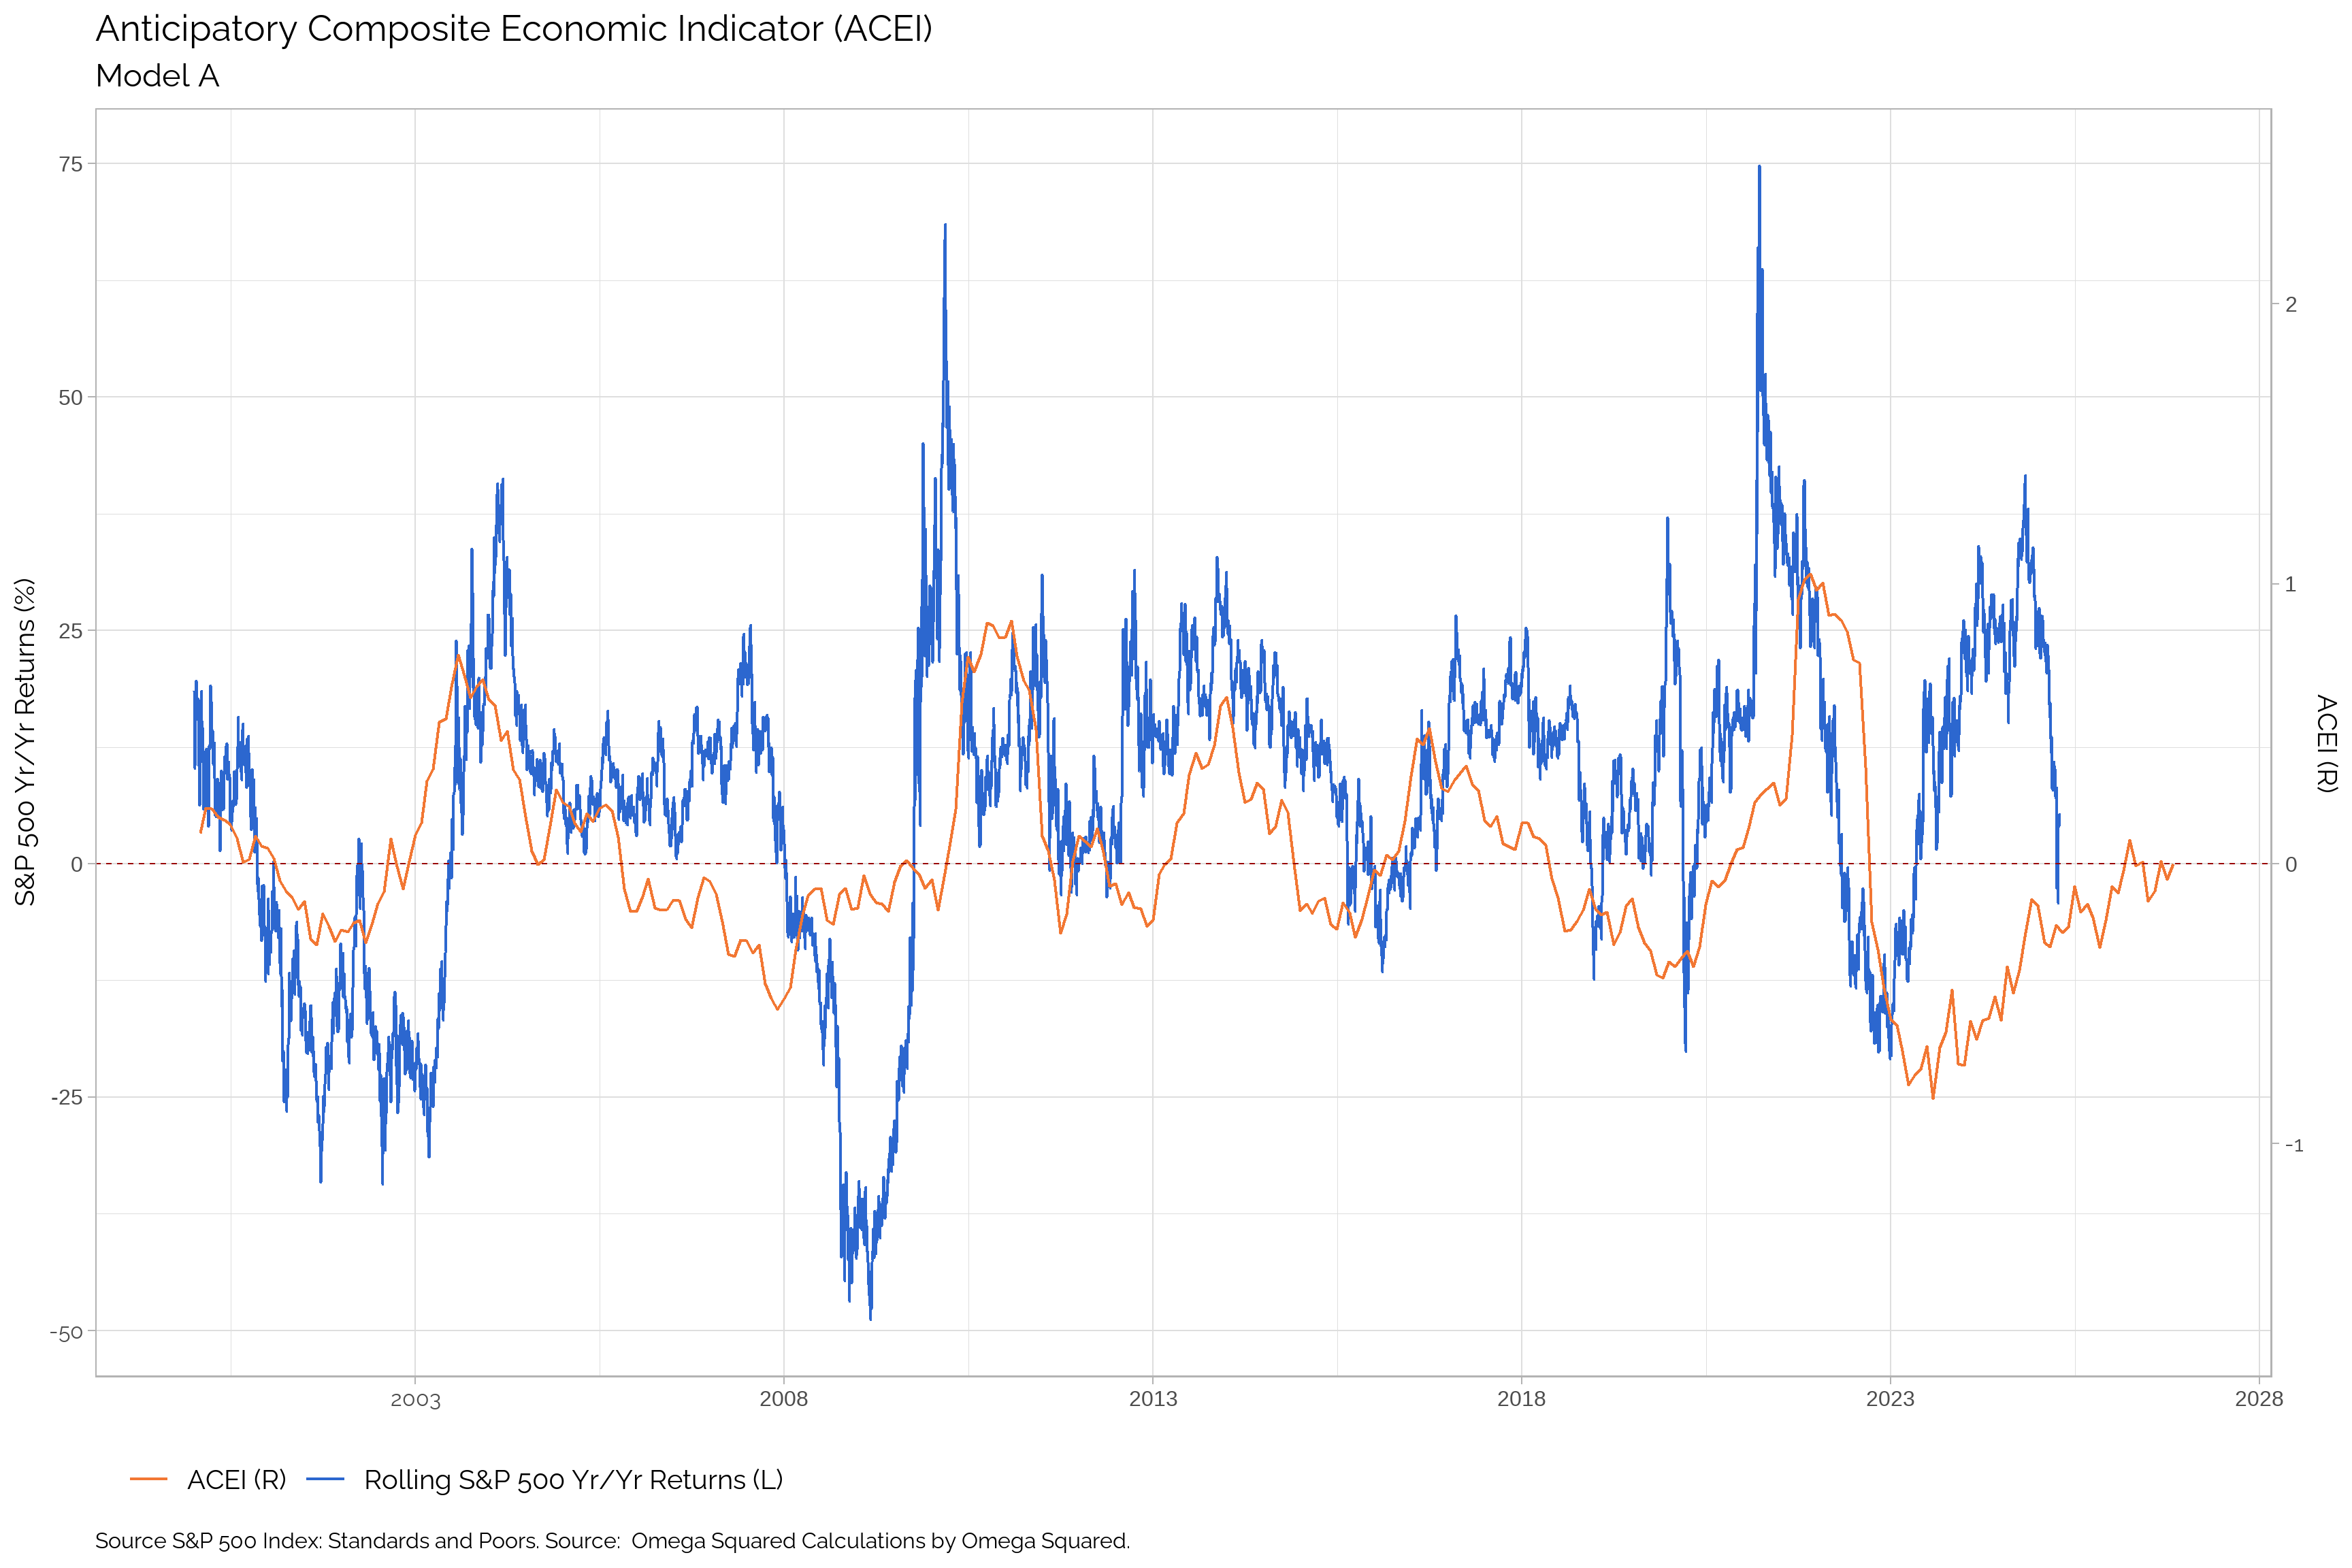
Model A
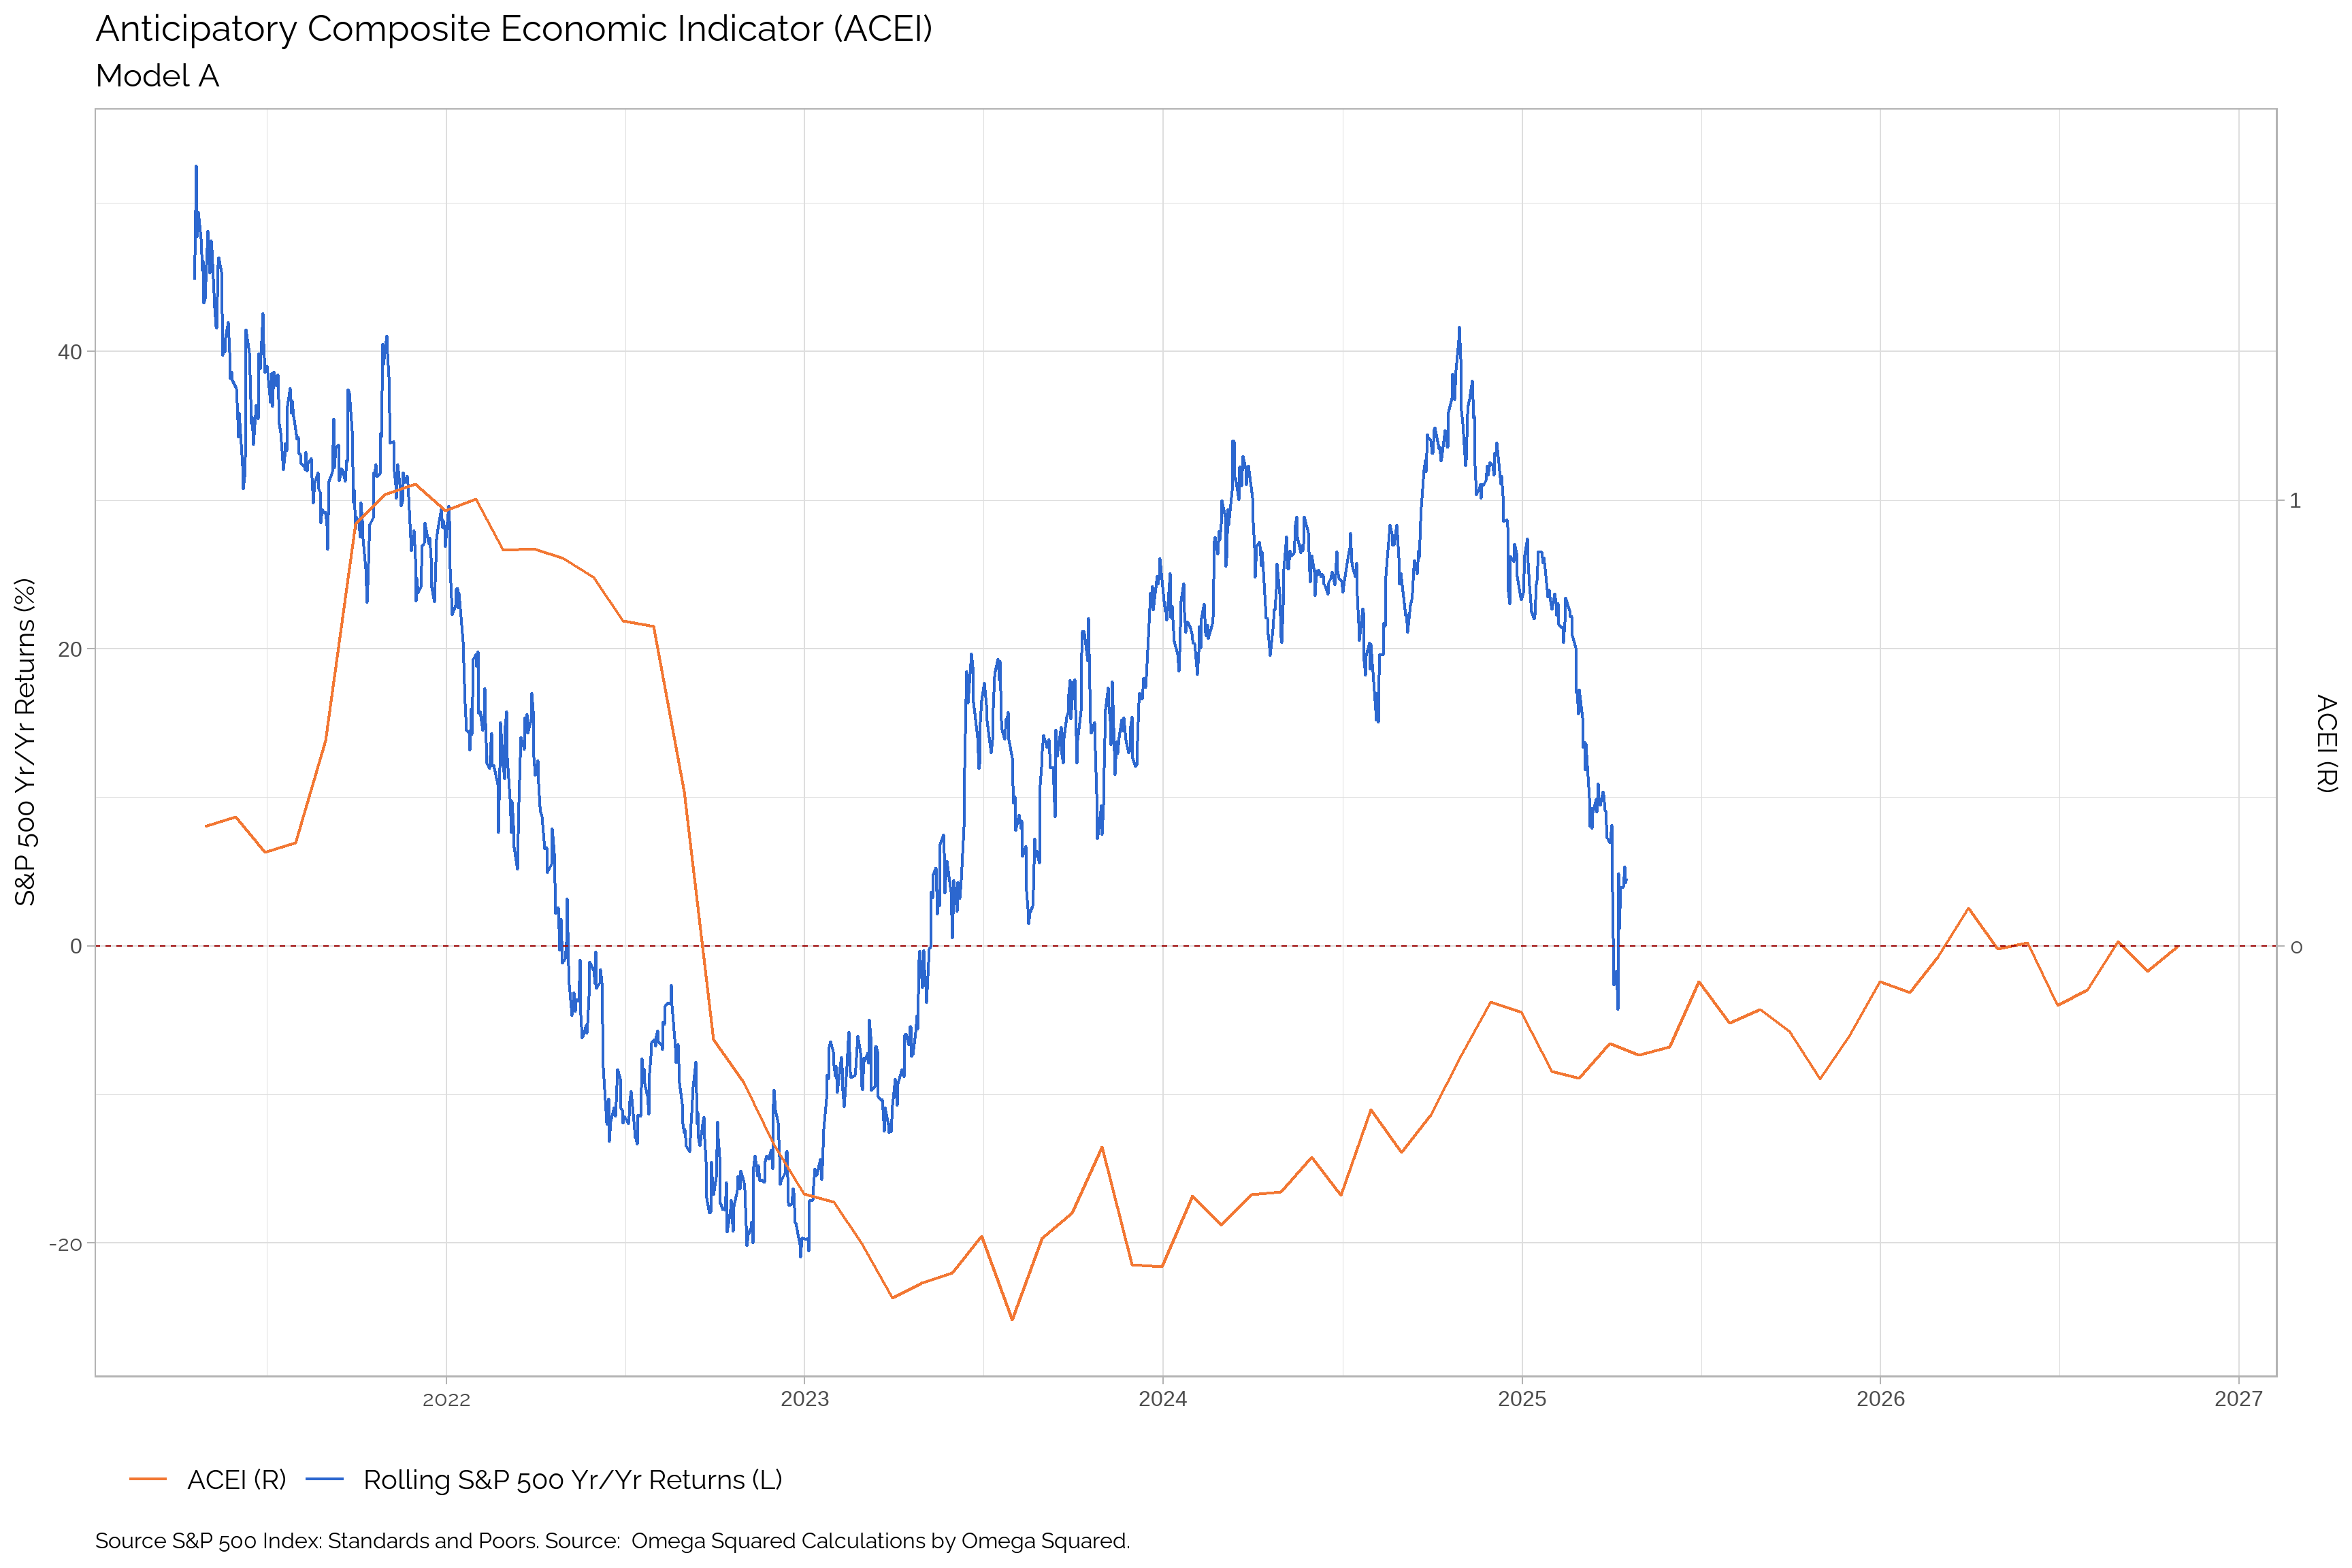
Anticipatory Economic Indicators
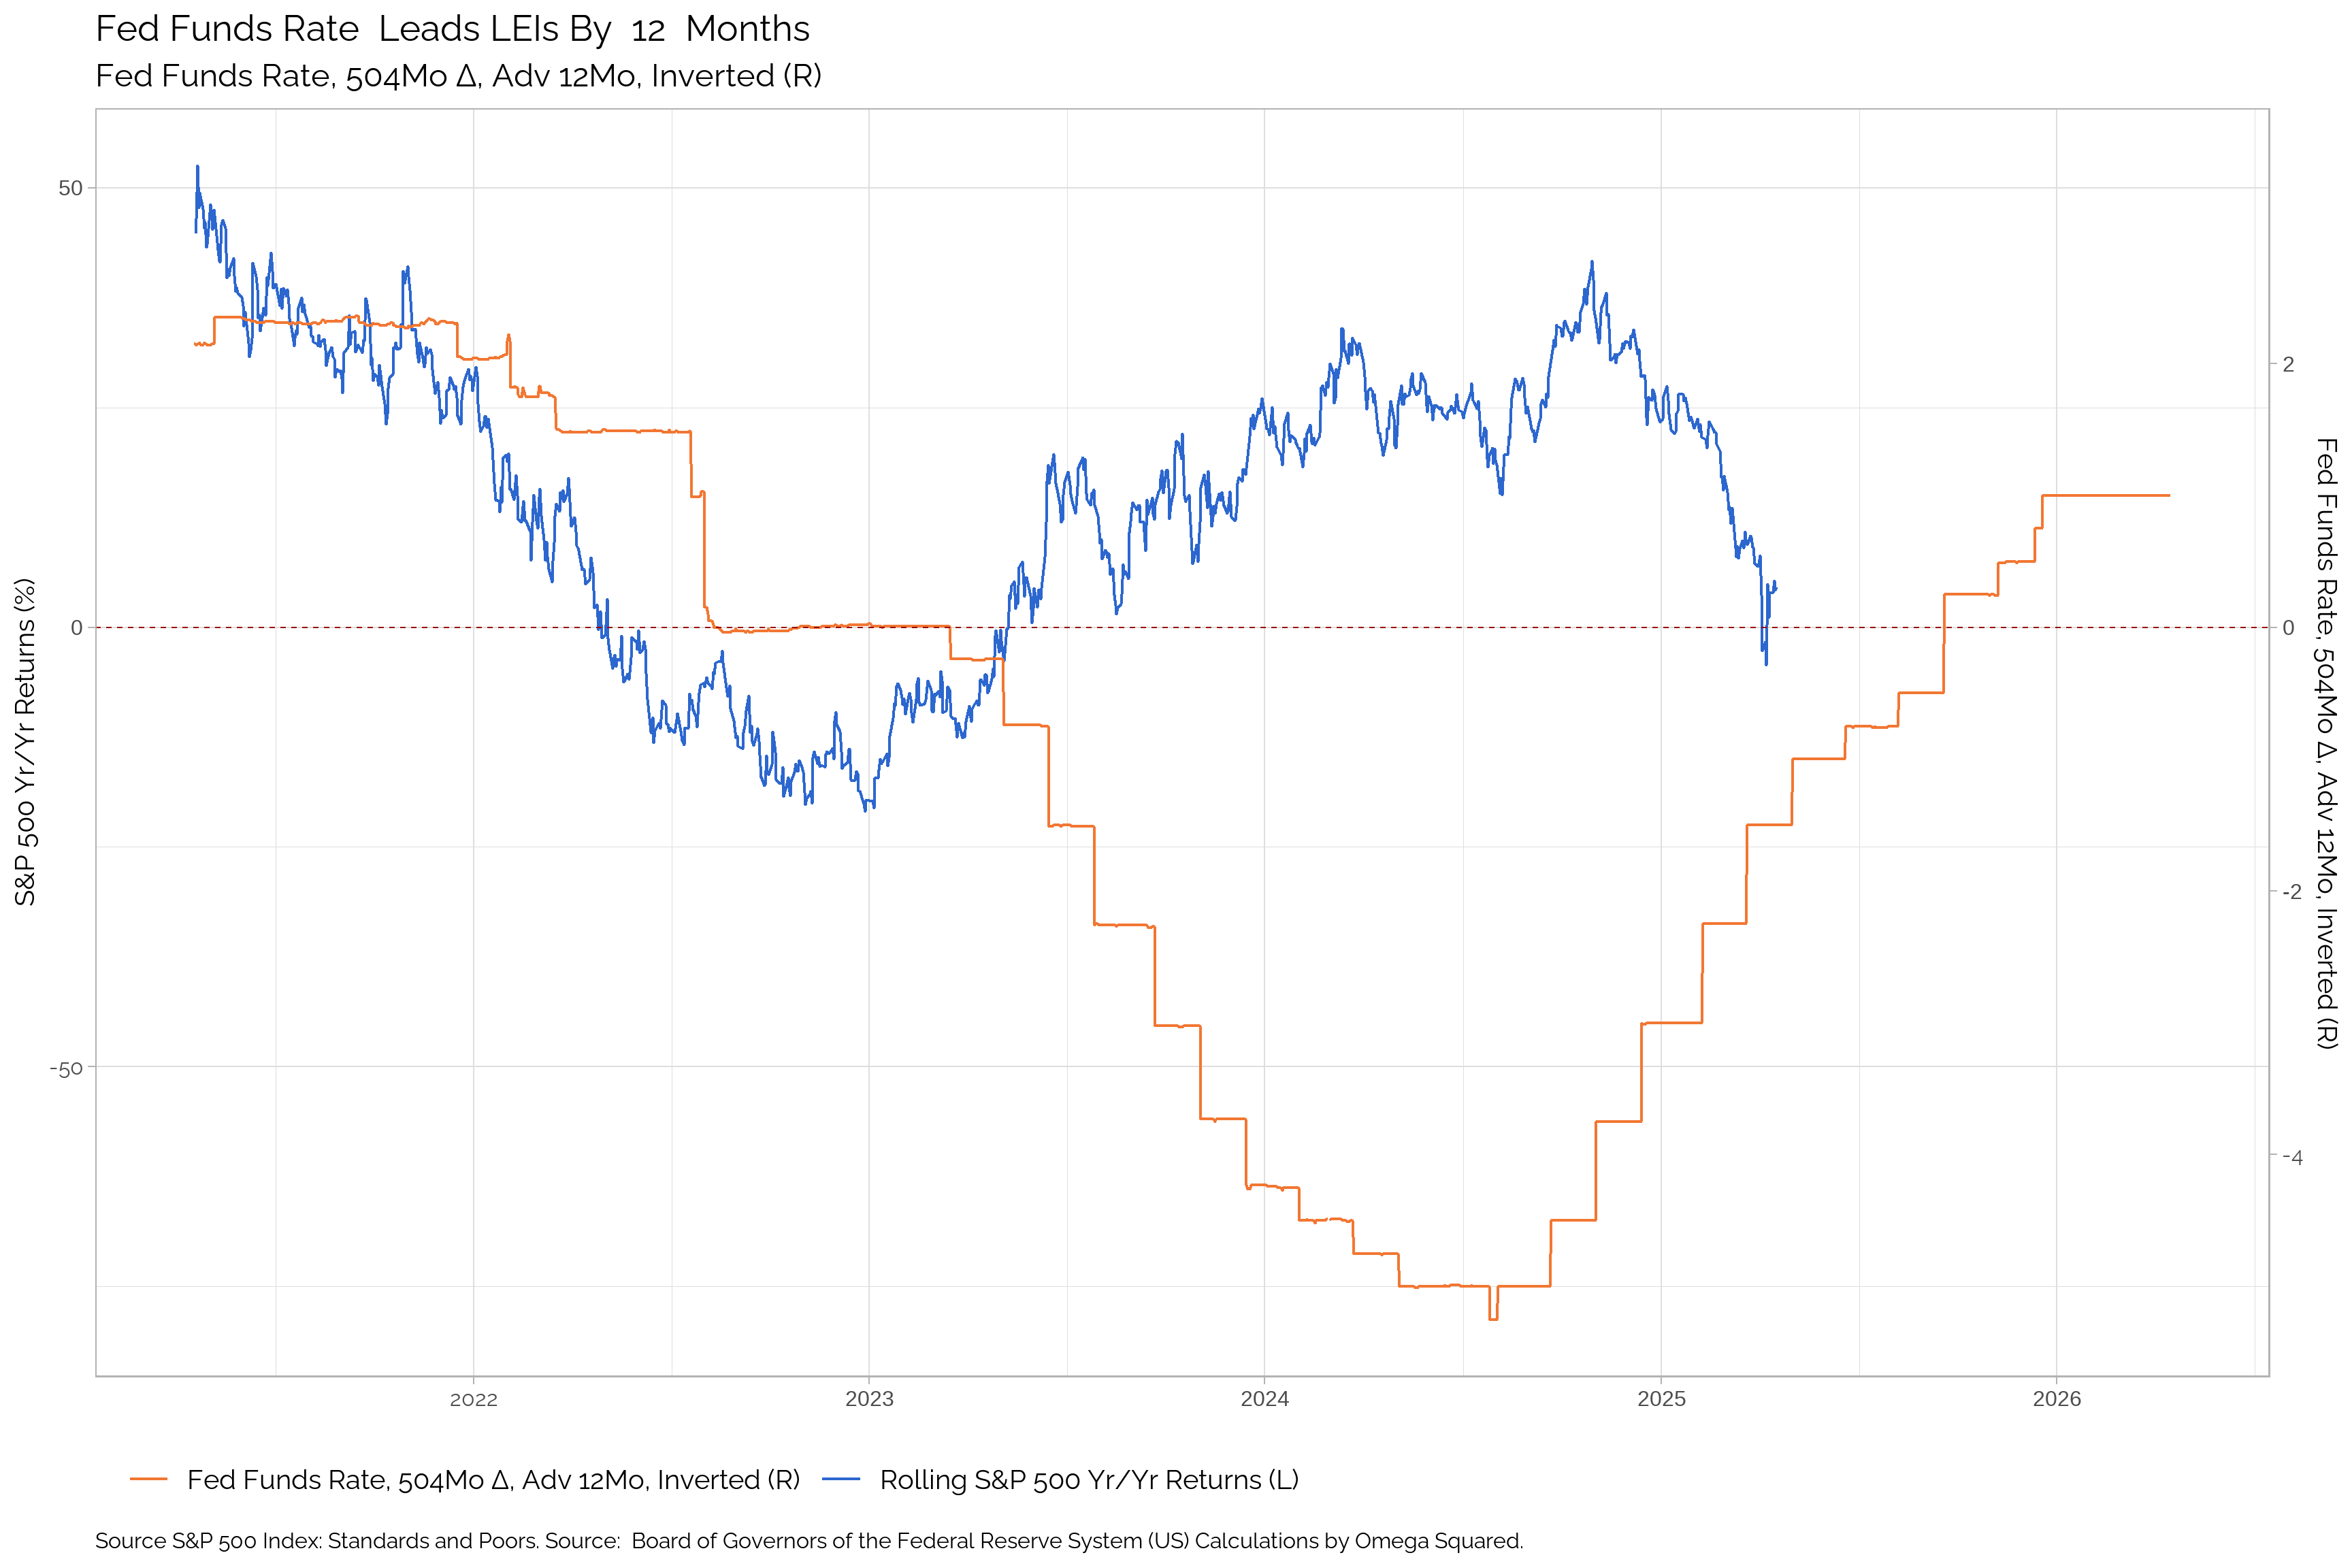
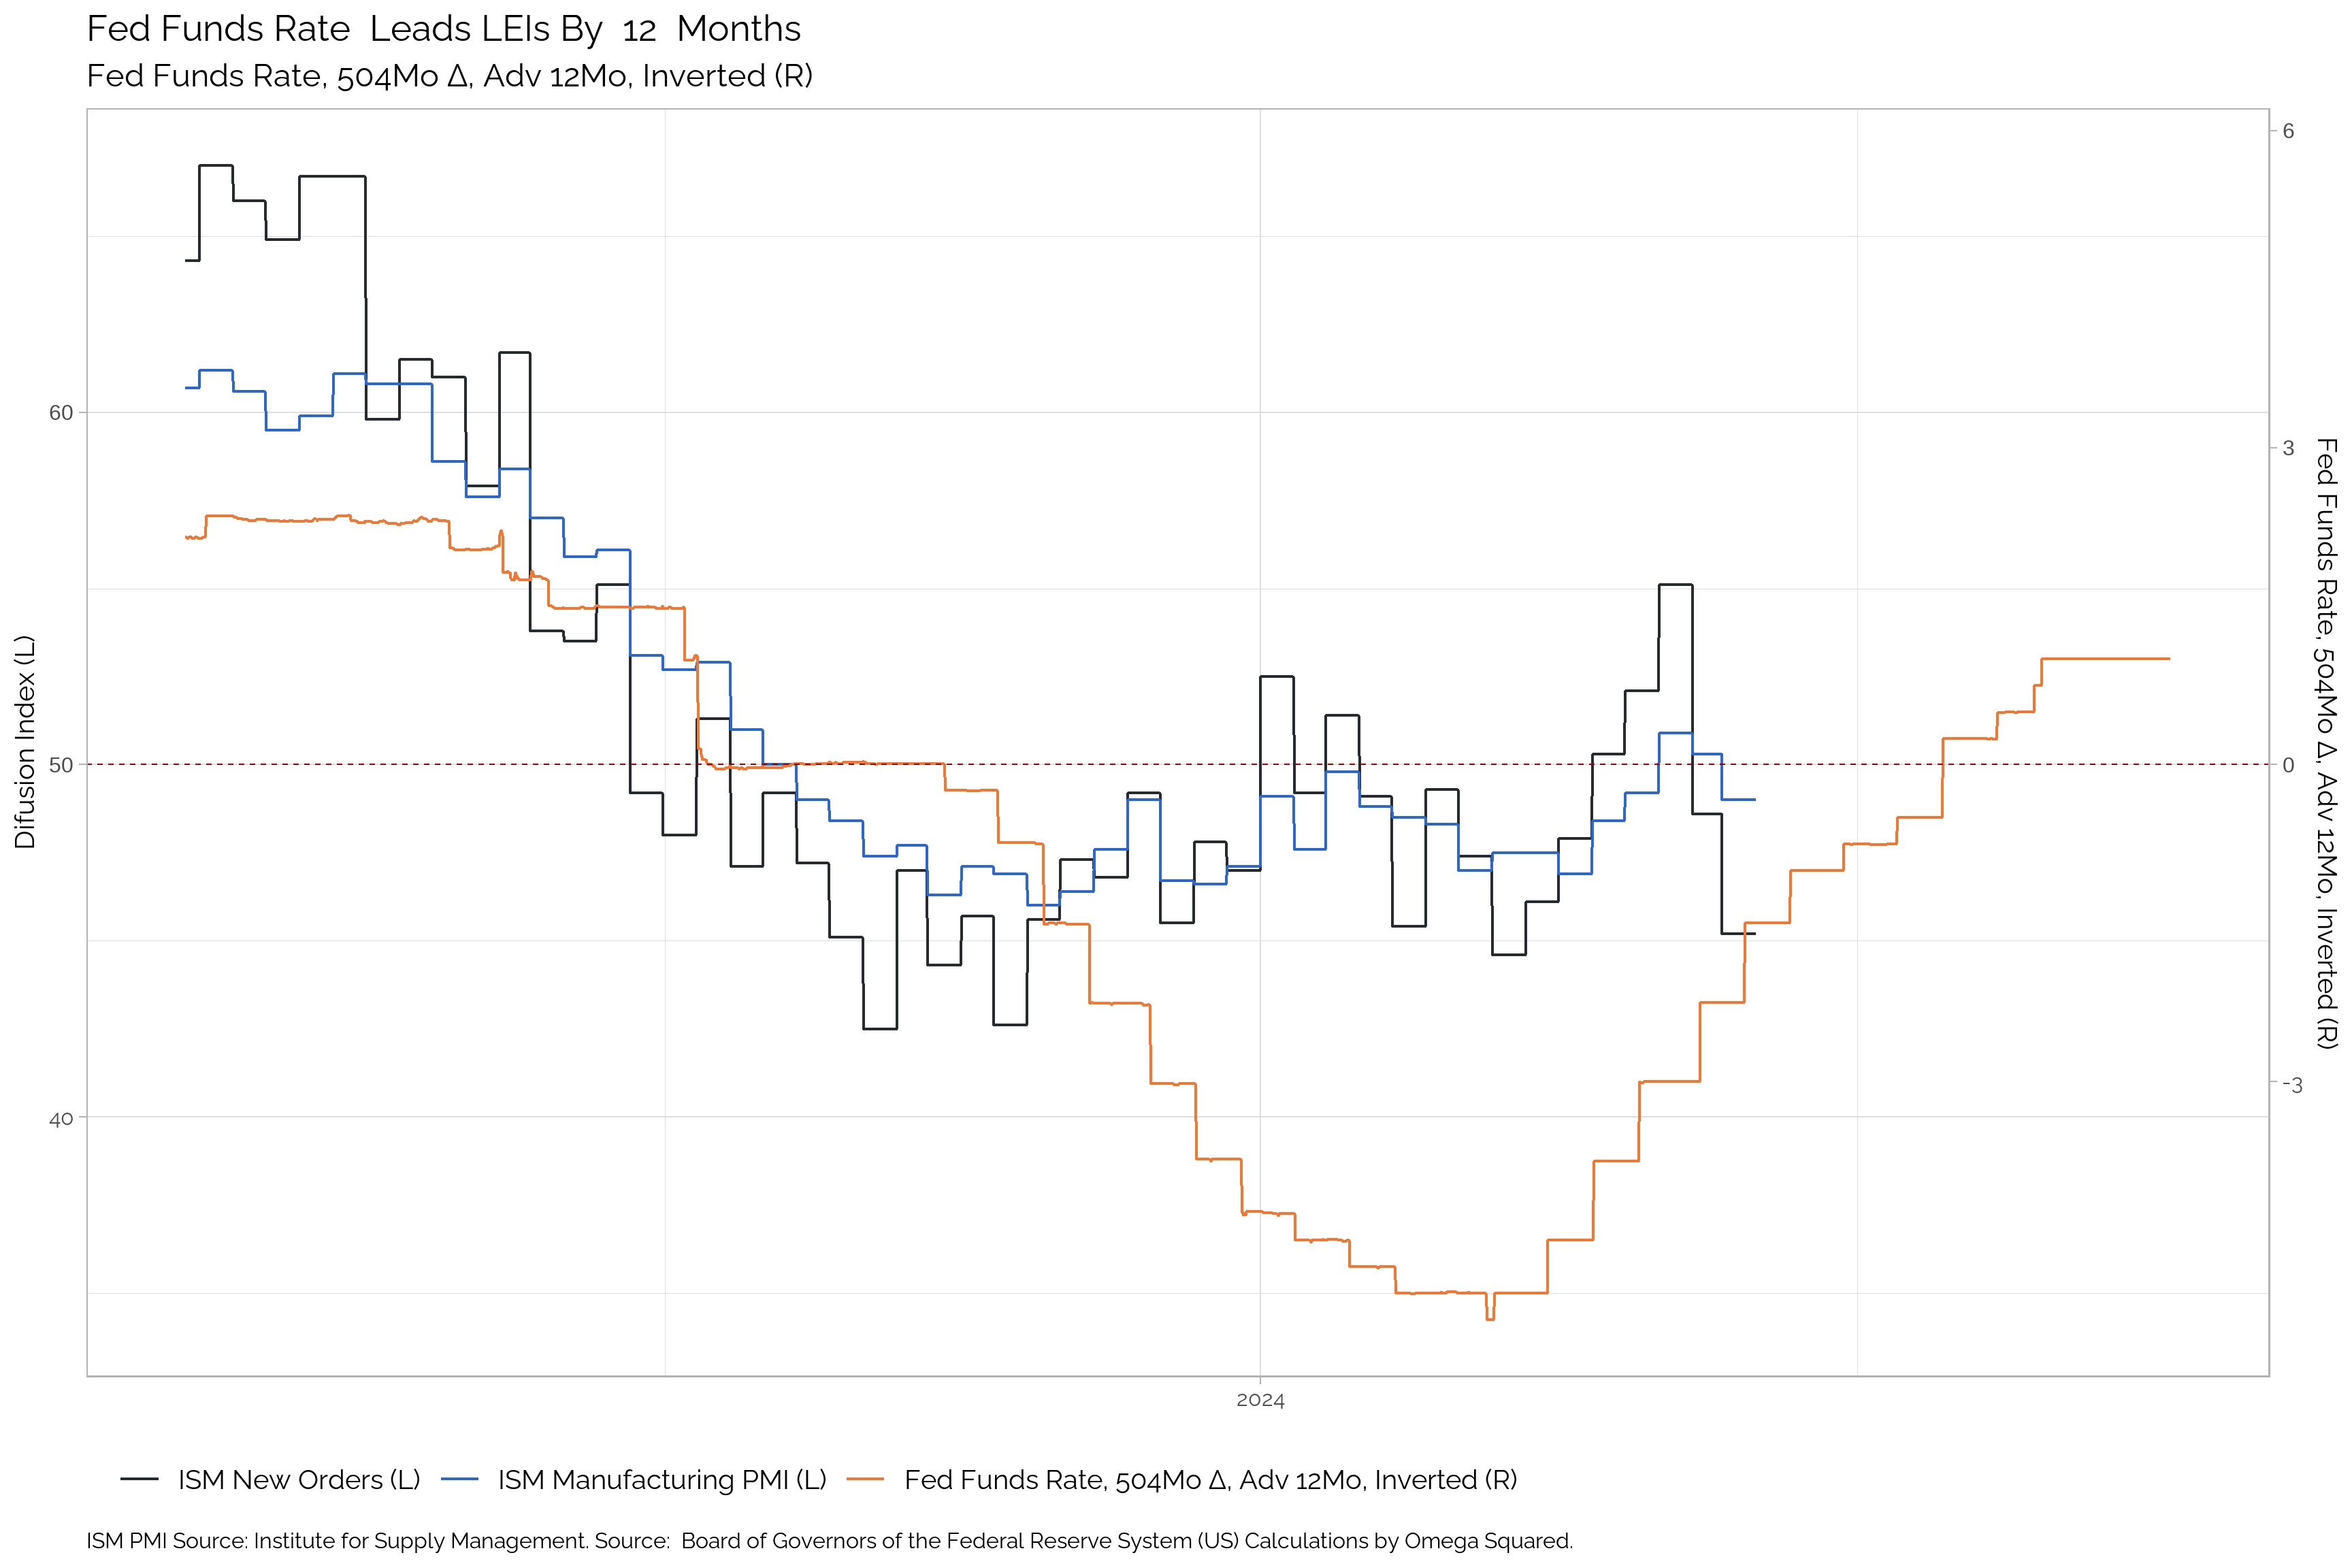
Fed Funds Rate
| Apr-25 | Mar-25 | Feb-25 | Jan-25 | Dec-24 | Nov-24 | Oct-24 | Sep-24 | Aug-24 | Jul-24 | Jun-24 | May-24 | |
|---|---|---|---|---|---|---|---|---|---|---|---|---|
| Dollar | 4.33 | 4.33 | 4.33 | 4.33 | 4.58 | 4.83 | 4.83 | 5.33 | 5.33 | 5.33 | 5.33 | 5.33 |
| Δ in Dollar | 0 | 0 | 0 | -0.25 | 0 | 0 | -0.5 | 0 | 0 | 0 | 0 | 0 |
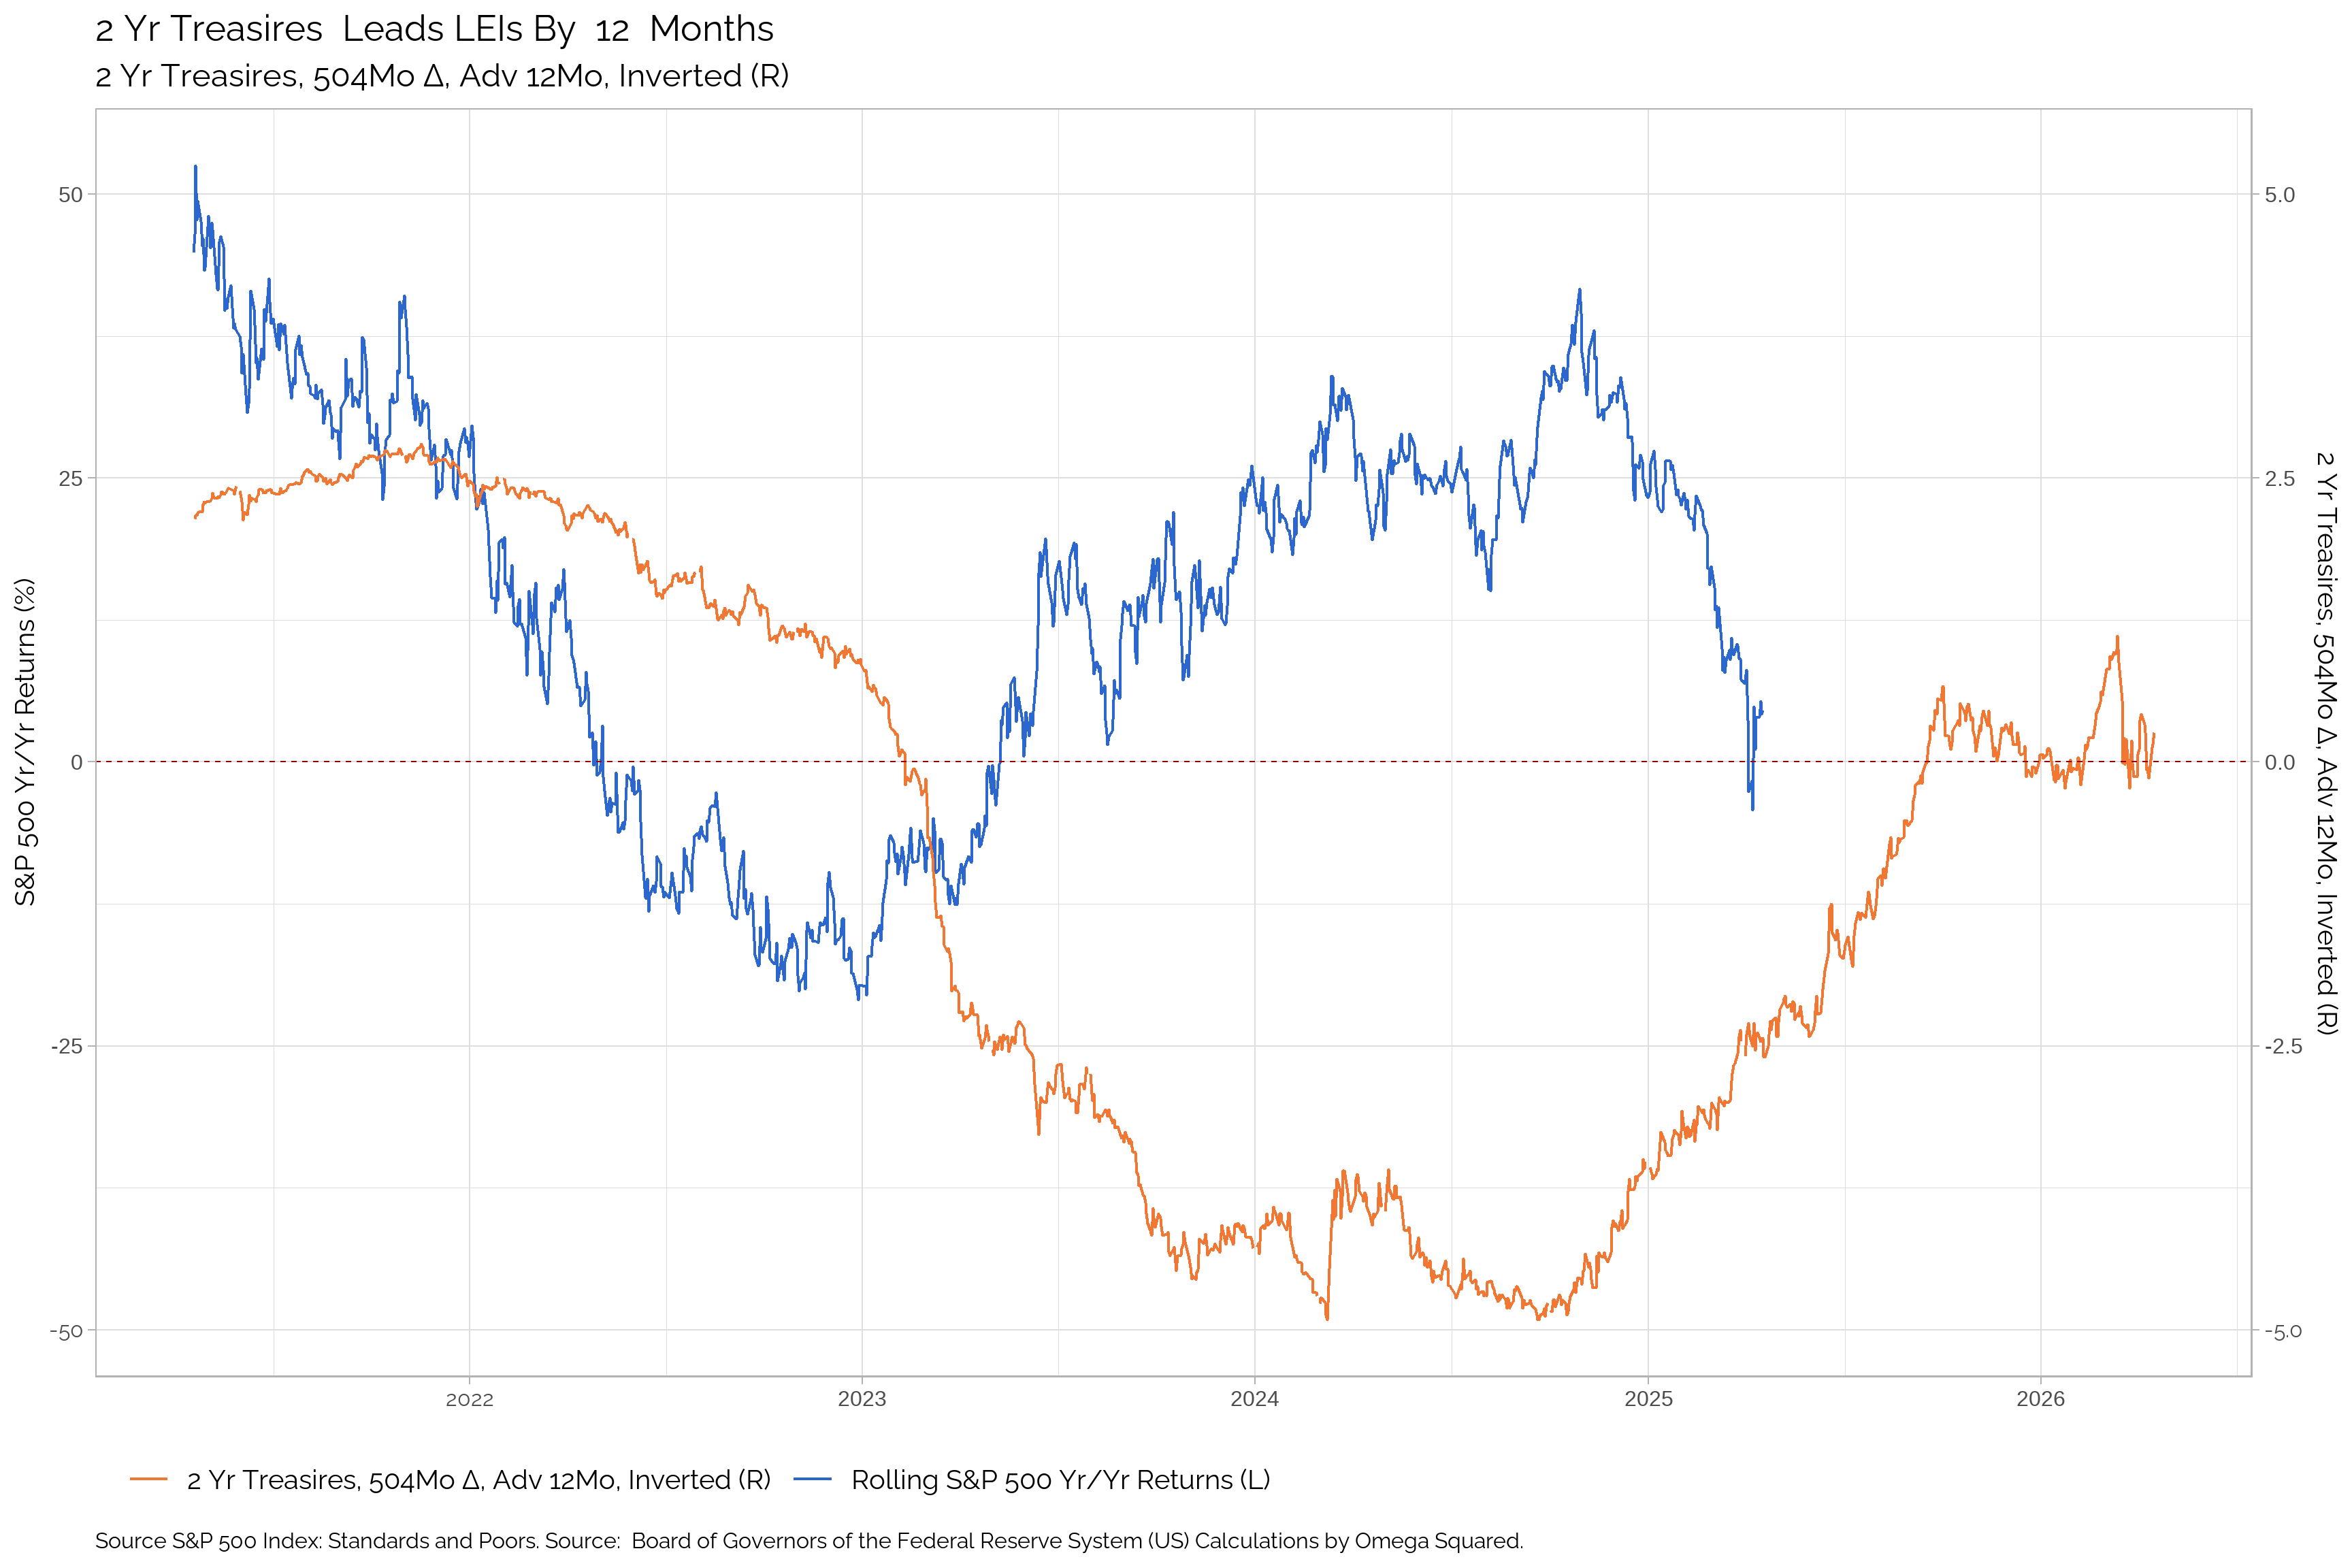
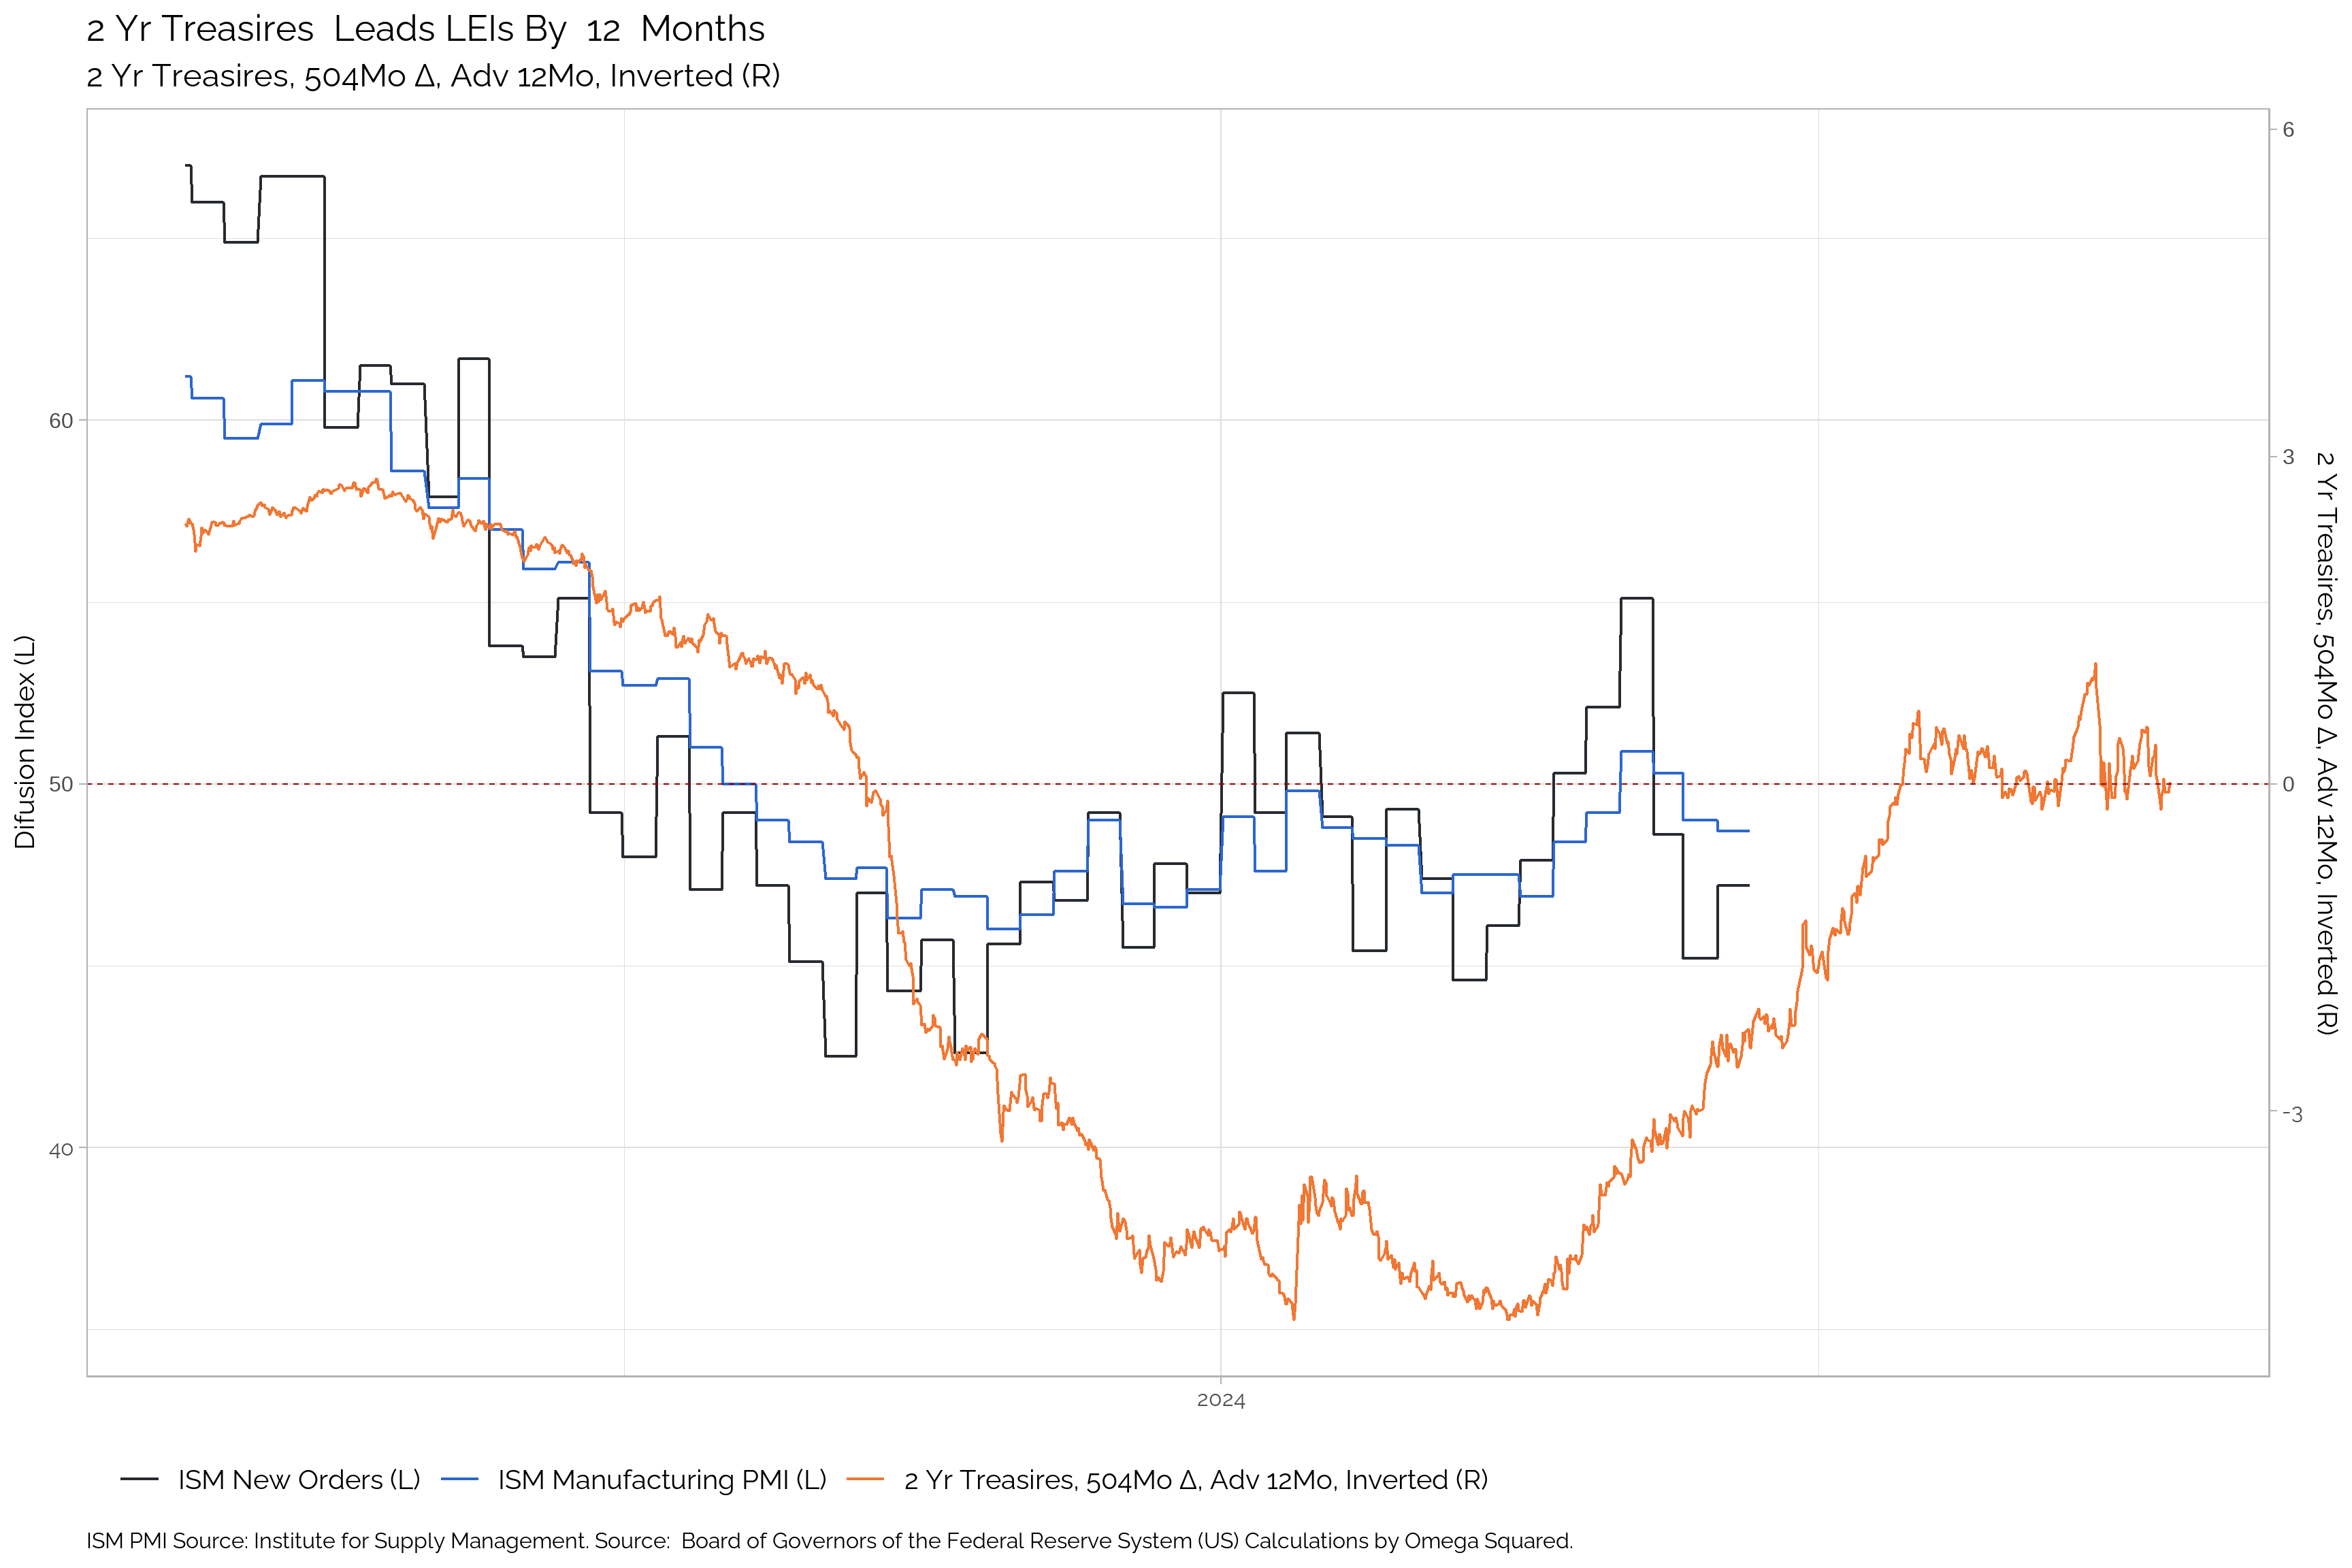
Two Year Treasuries
| Apr-25 | Mar-25 | Feb-25 | Jan-25 | Dec-24 | Nov-24 | Oct-24 | Sep-24 | Aug-24 | Jul-24 | Jun-24 | May-24 | |
|---|---|---|---|---|---|---|---|---|---|---|---|---|
| 2Yr Treasuriesr | 3.89 | 3.99 | 4.22 | 4.25 | 4.13 | 4.16 | 3.66 | 3.91 | 4.29 | 4.71 | 4.89 | 5.04 |
| Δ in 2Yr Treasuriesr | -0.18 | -0.2 | -0.02 | 0.06 | 0.01 | 0.5 | -0.17 | -0.38 | -0.42 | -0.23 | -0.15 | 0.45 |
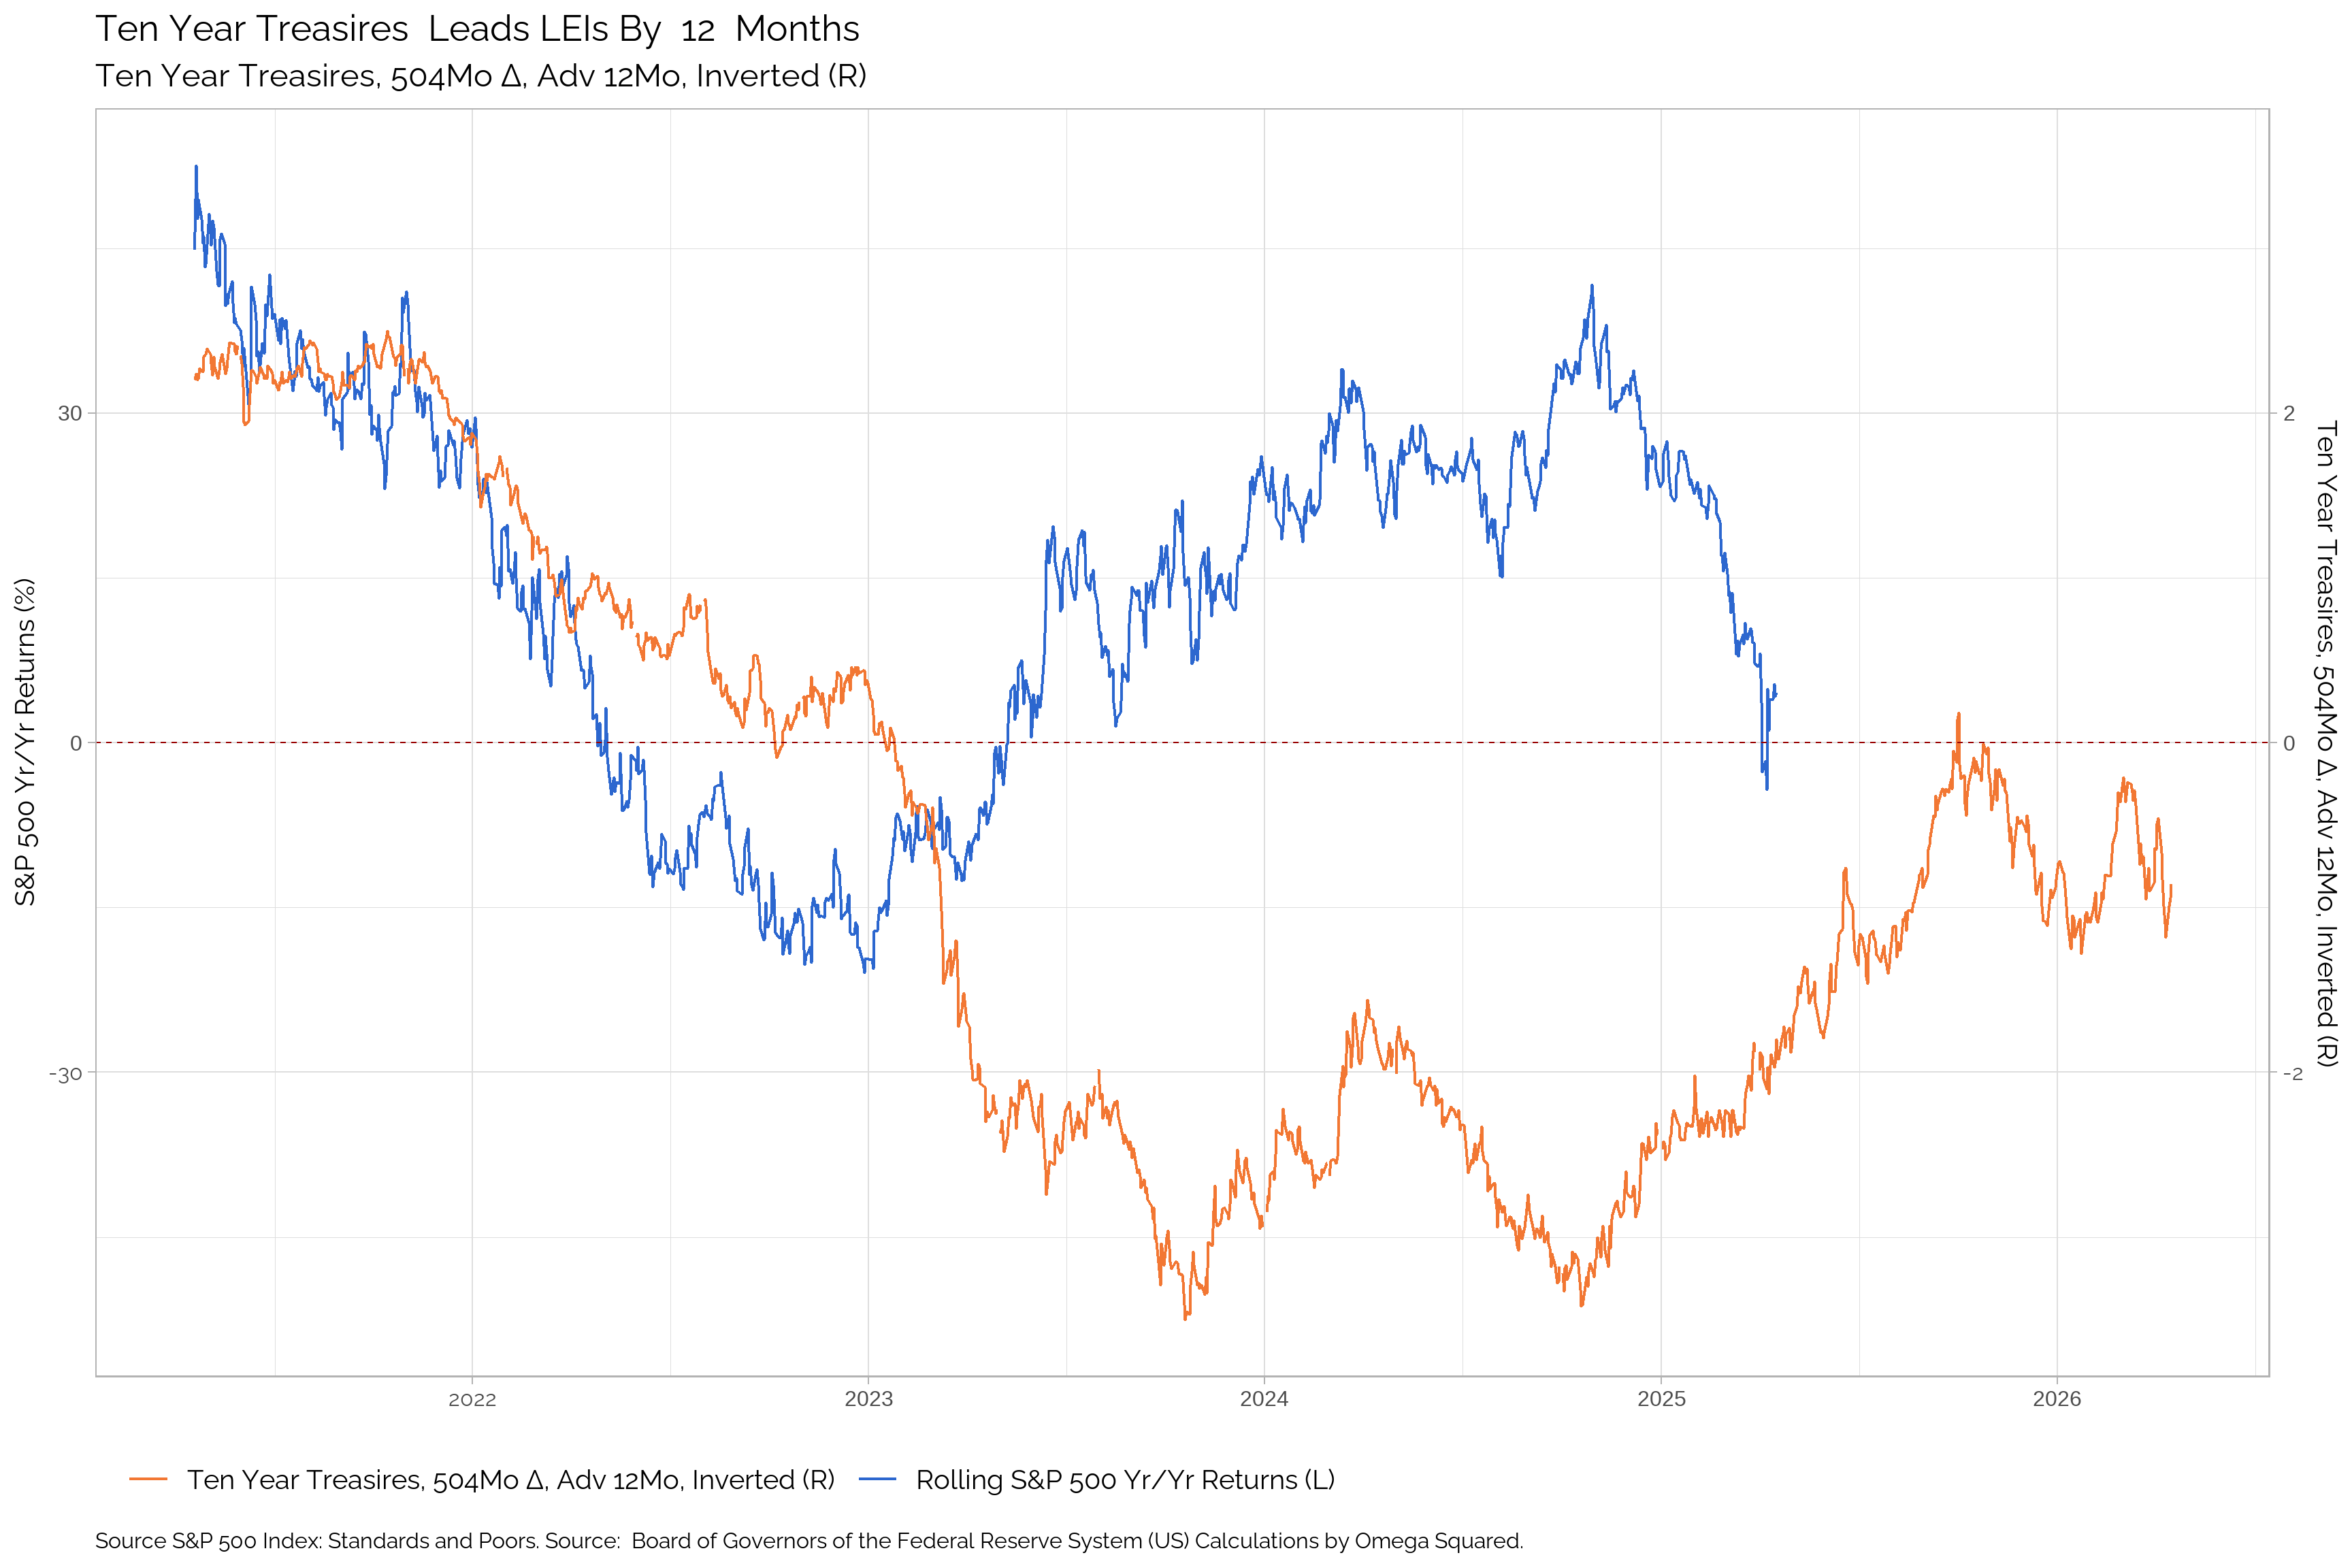
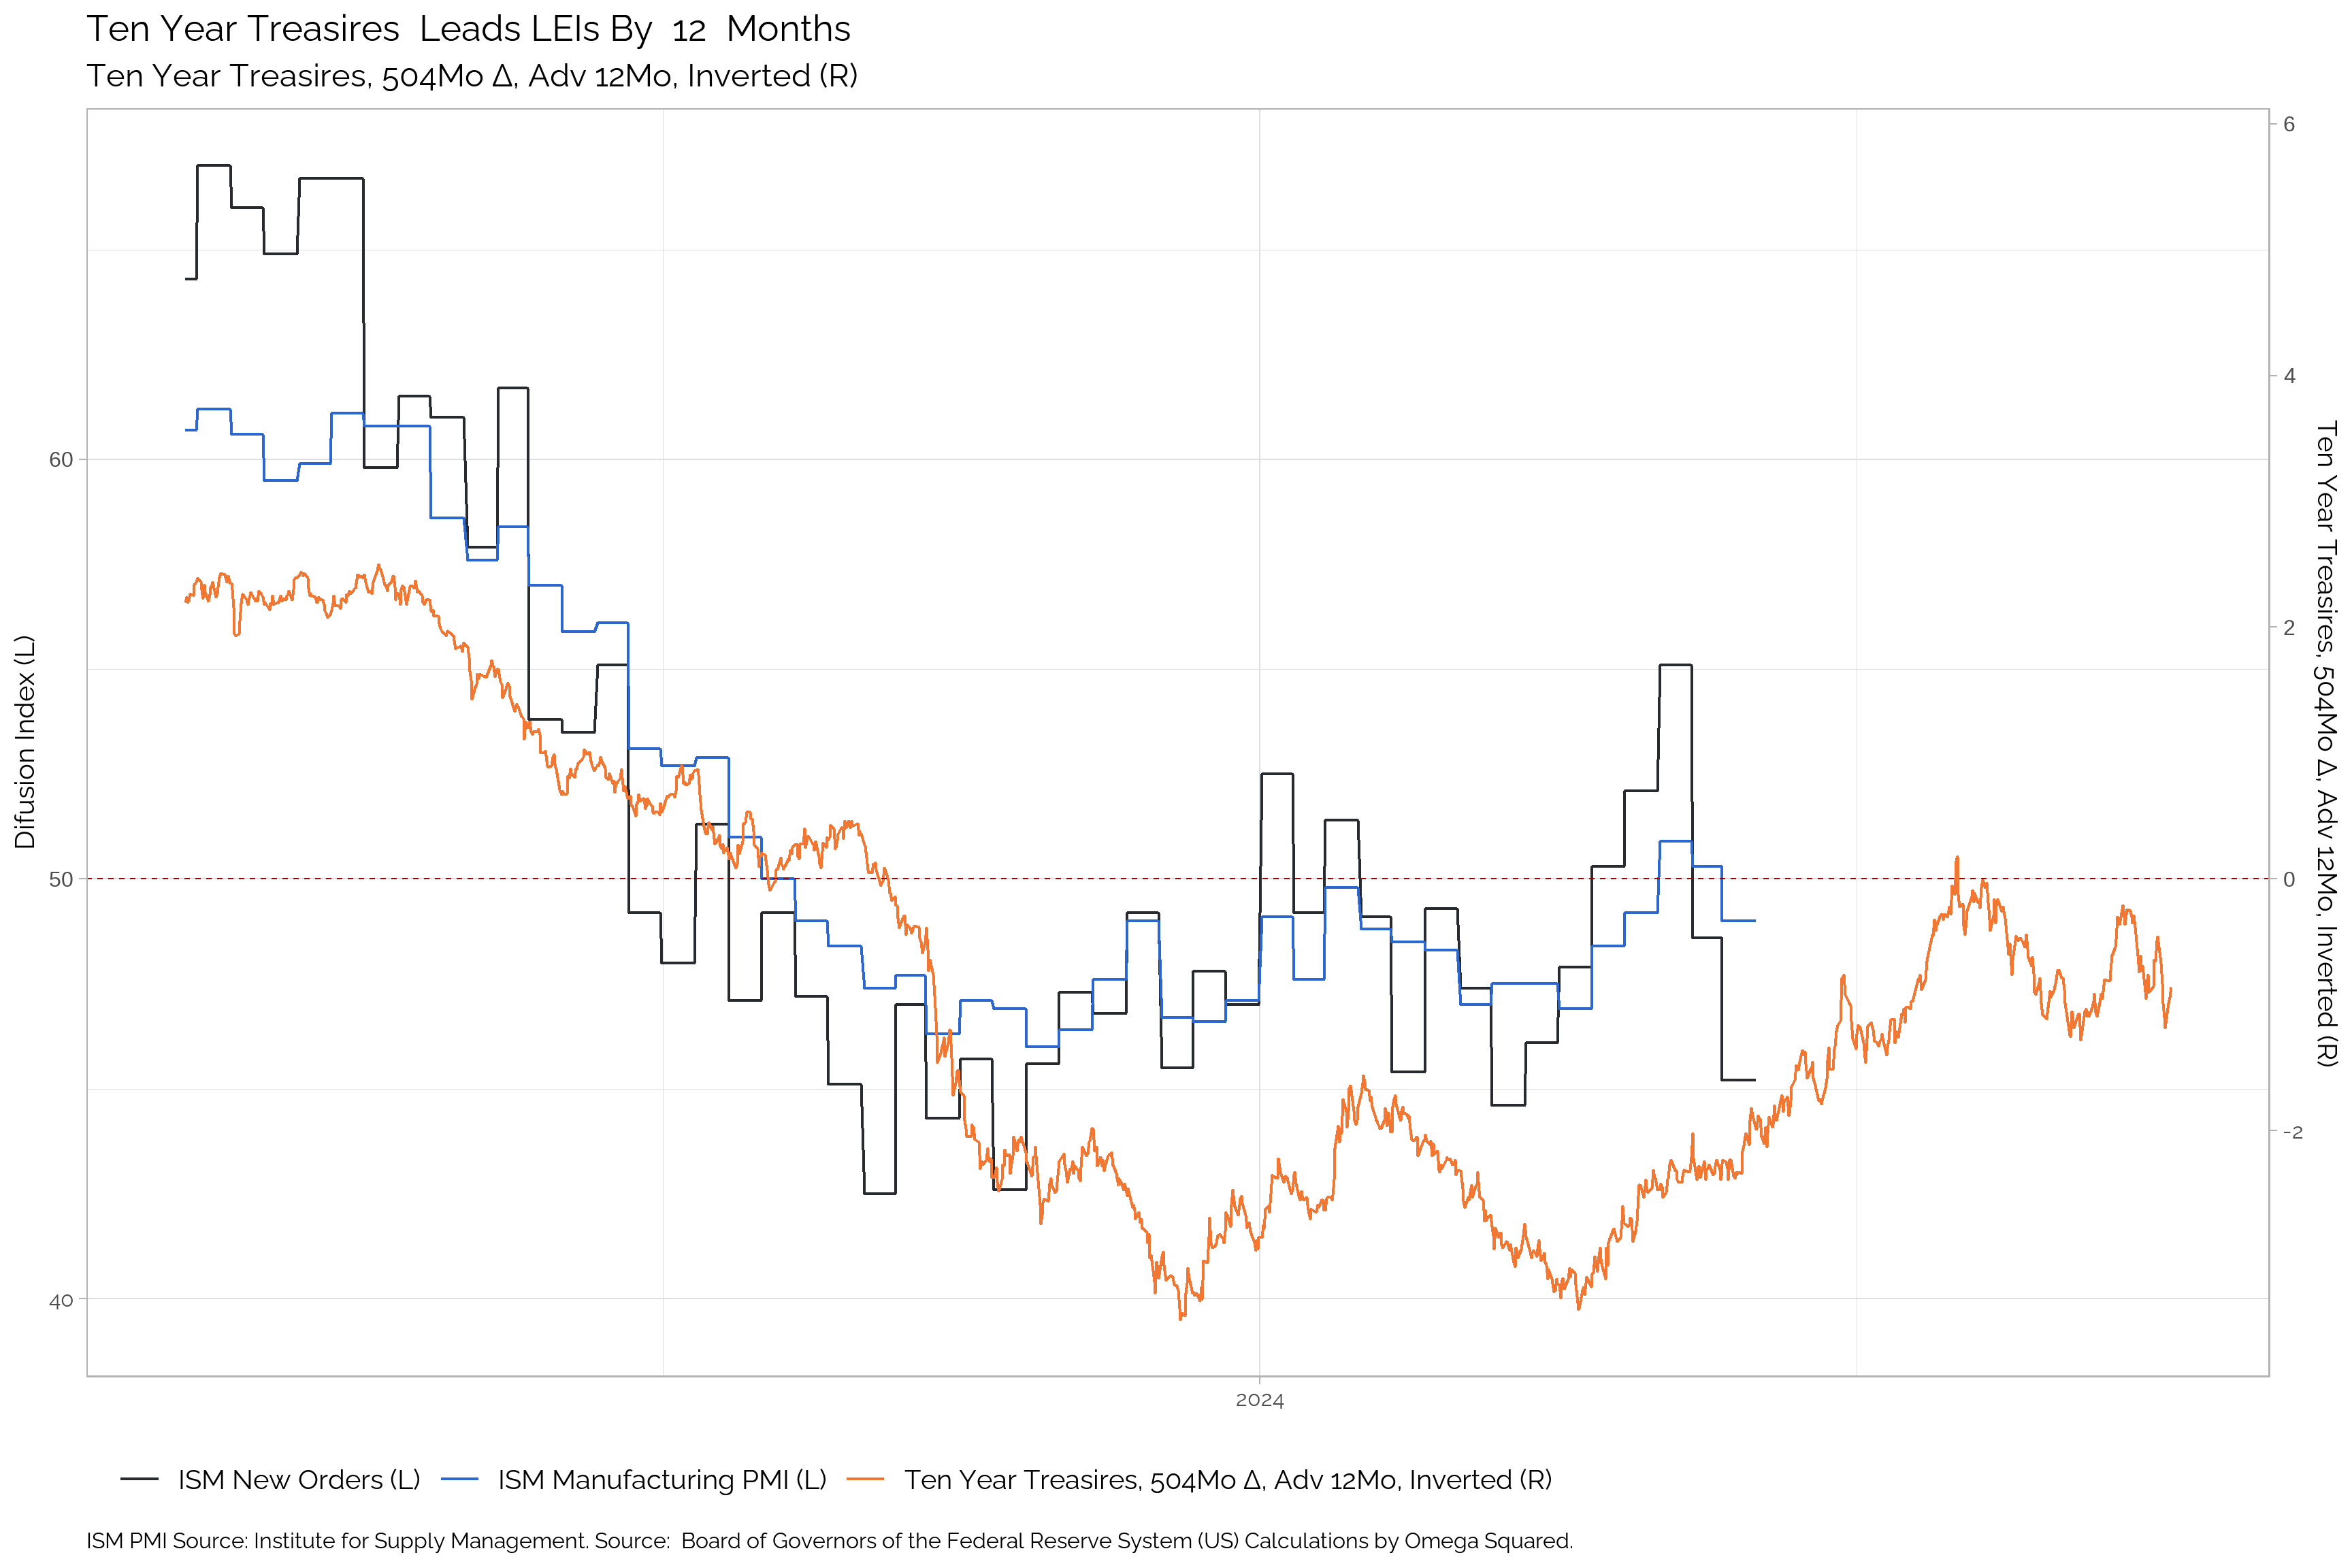
Ten Year Treasuries
| Apr-25 | Mar-25 | Feb-25 | Jan-25 | Dec-24 | Nov-24 | Oct-24 | Sep-24 | Aug-24 | Jul-24 | Jun-24 | May-24 | |
|---|---|---|---|---|---|---|---|---|---|---|---|---|
| 10Yr Treasuriesr | 4.23 | 4.24 | 4.58 | 4.58 | 4.18 | 4.28 | 3.81 | 3.91 | 4.09 | 4.36 | 4.51 | 4.69 |
| Δ in 10Yr Treasuriesr | -0.06 | -0.31 | 0.03 | 0.33 | -0.1 | 0.47 | -0.03 | -0.18 | -0.27 | -0.18 | -0.18 | 0.49 |
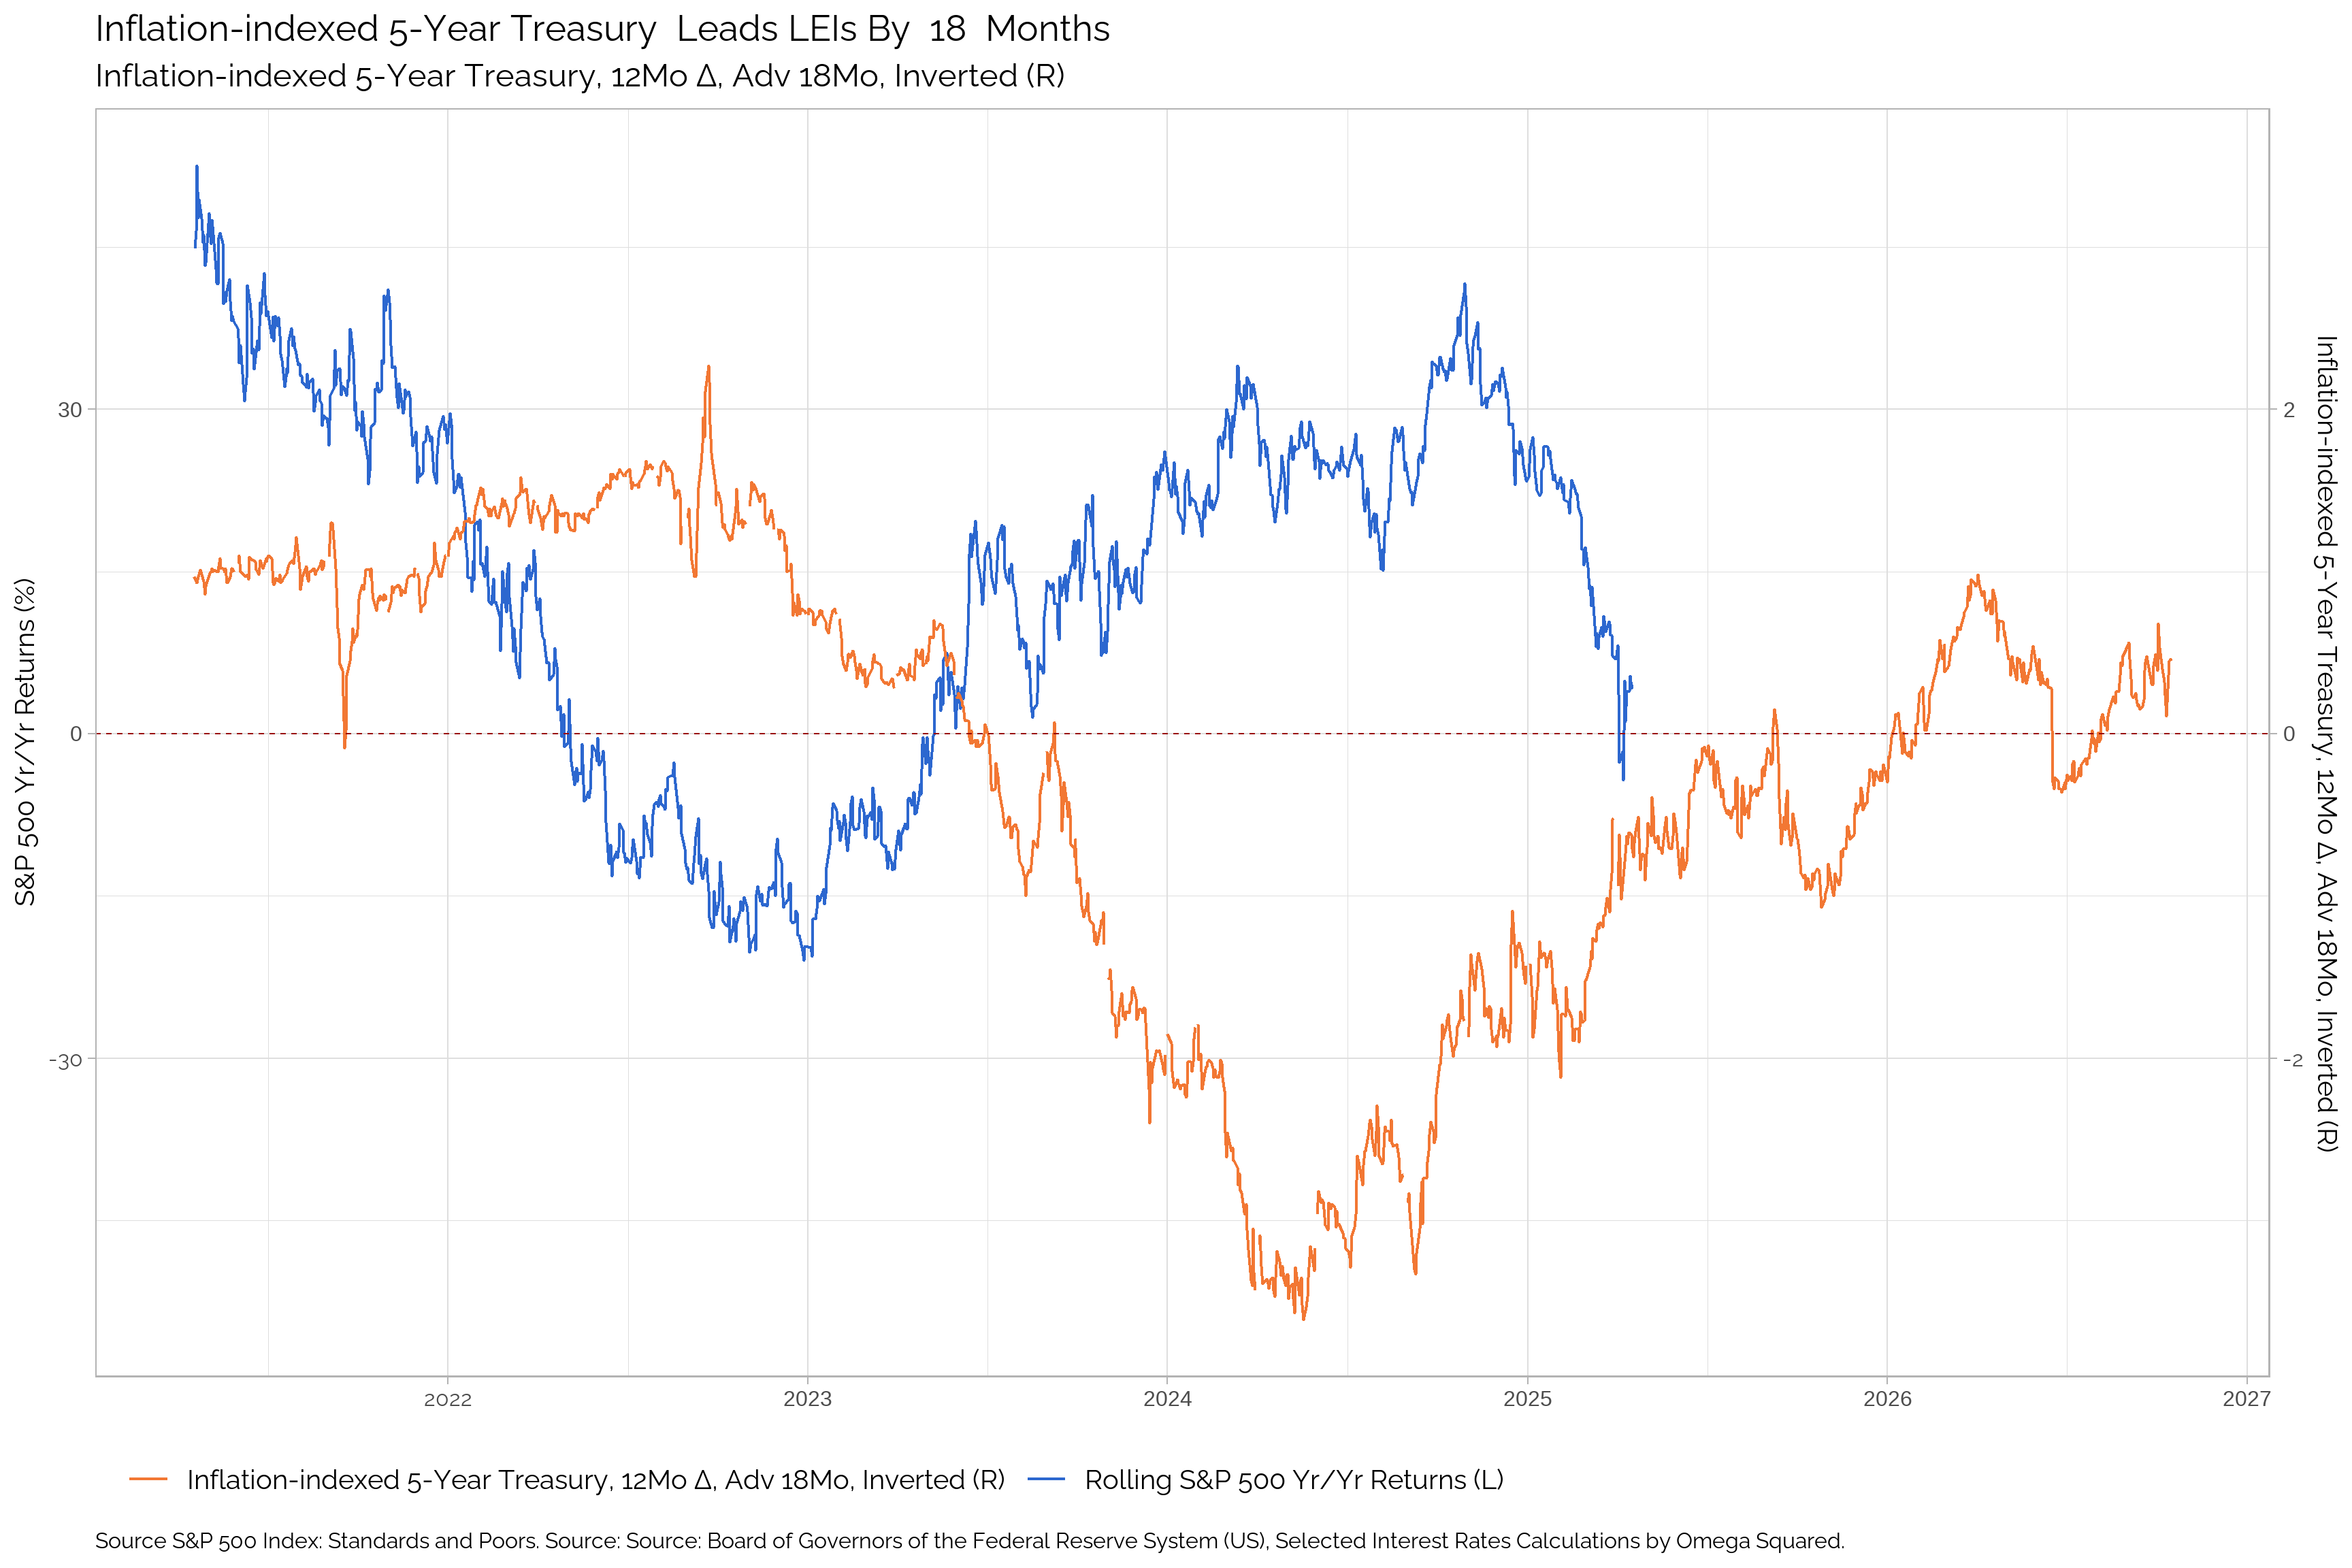
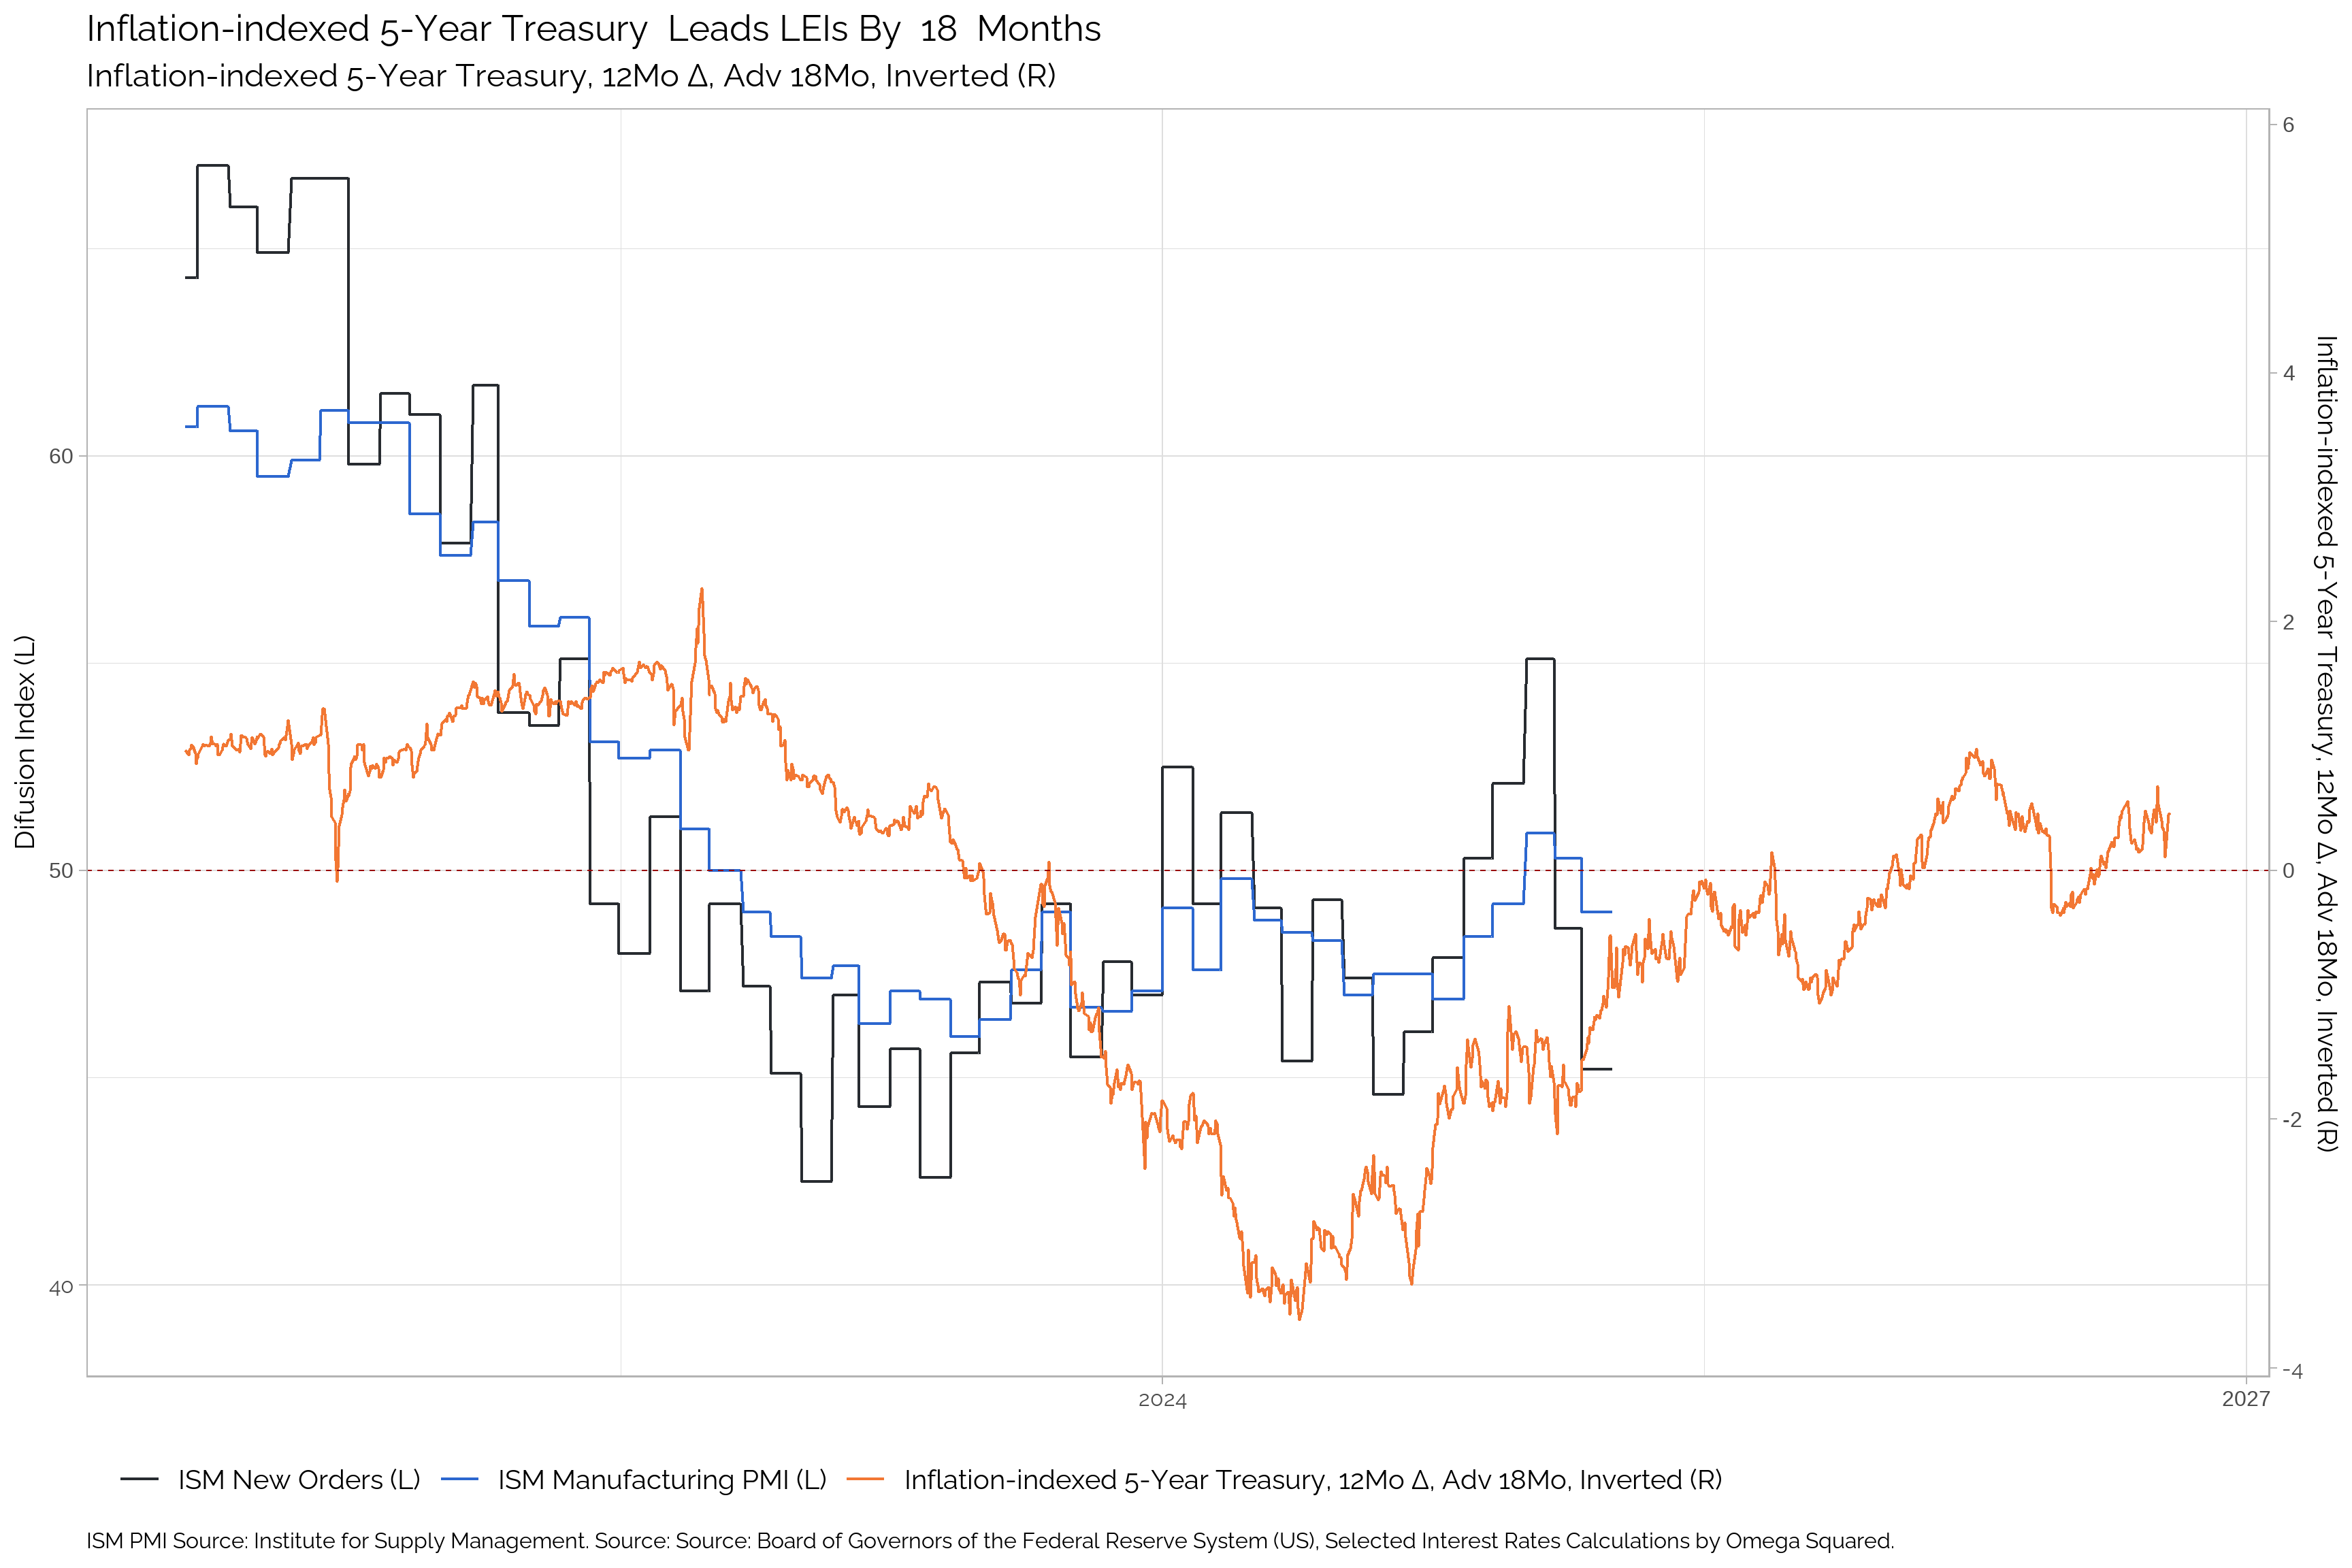
5Yr. Real Rates
| Apr-25 | Mar-25 | Feb-25 | Jan-25 | Dec-24 | Nov-24 | Oct-24 | Sep-24 | Aug-24 | Jul-24 | Jun-24 | May-24 | |
|---|---|---|---|---|---|---|---|---|---|---|---|---|
| Real Rates 5-Year Treasury | 1.35 | 1.45 | 1.82 | 2 | 1.72 | 1.77 | 1.51 | 1.7 | 1.84 | 2.09 | 2.18 | 2.29 |
| Δ in Real Rates 5-Year Treasury | -0.17 | -0.36 | -0.2 | 0.21 | -0.08 | 0.26 | -0.13 | -0.14 | -0.25 | -0.14 | -0.11 | 0.46 |
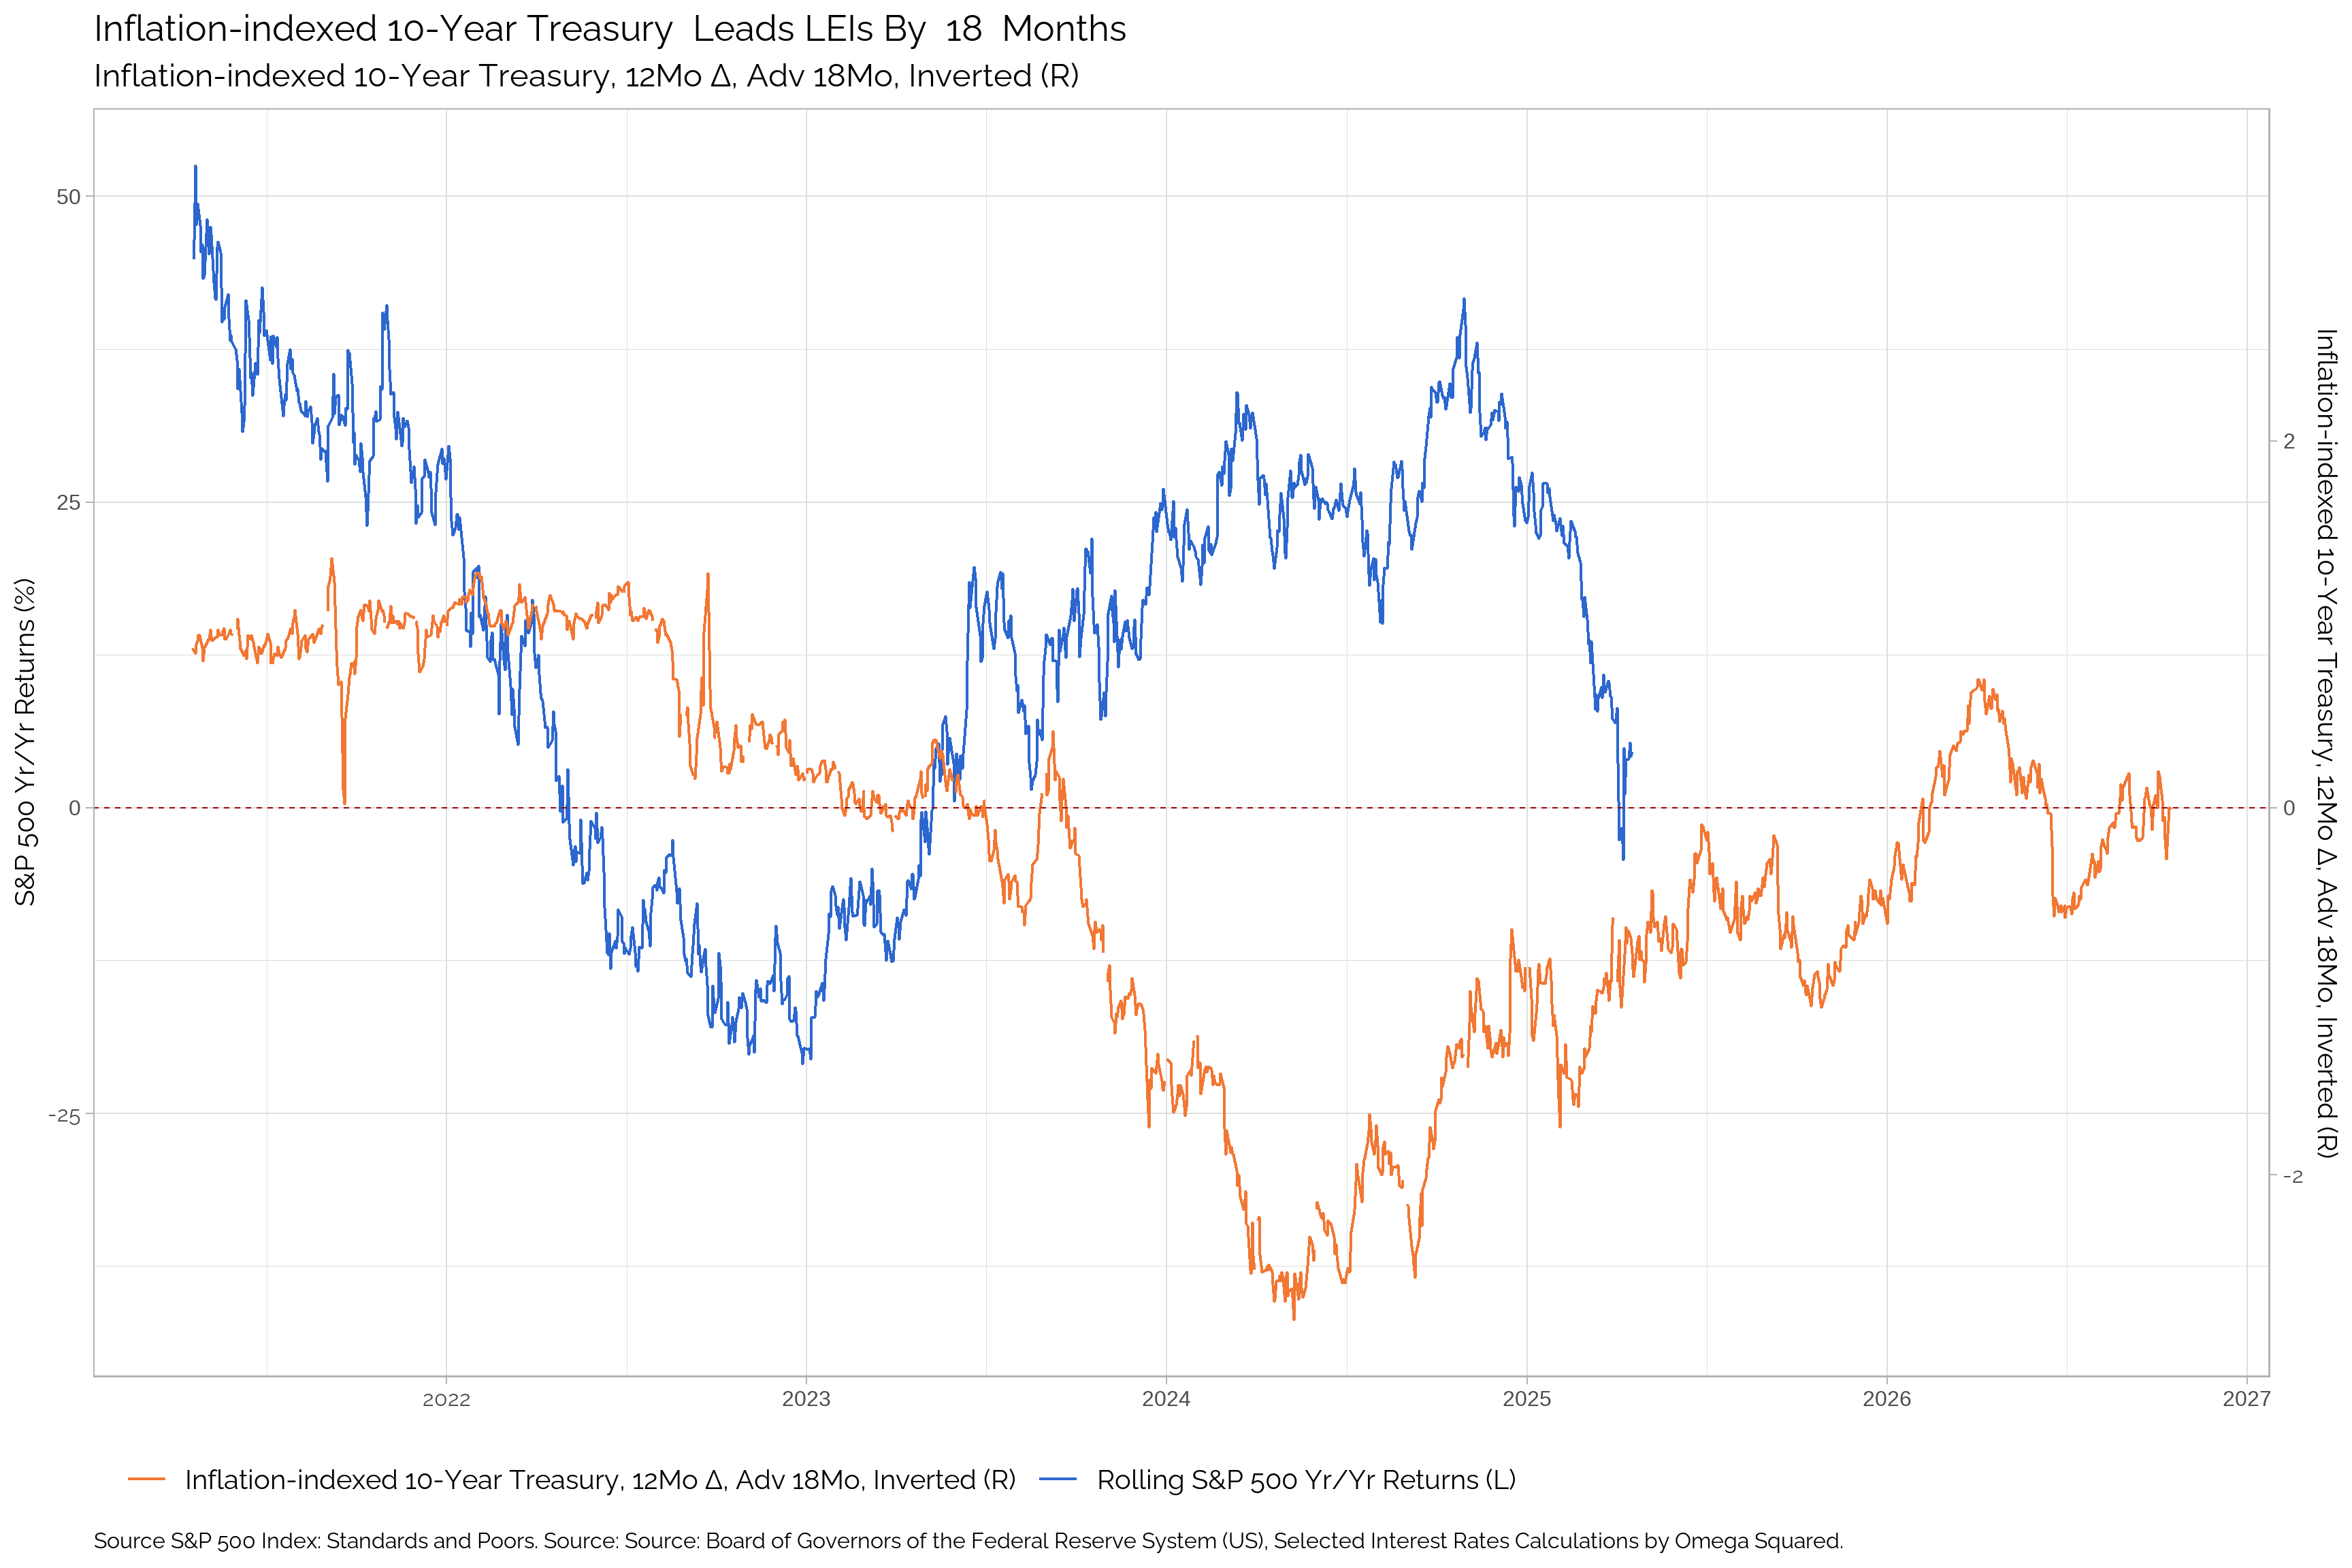
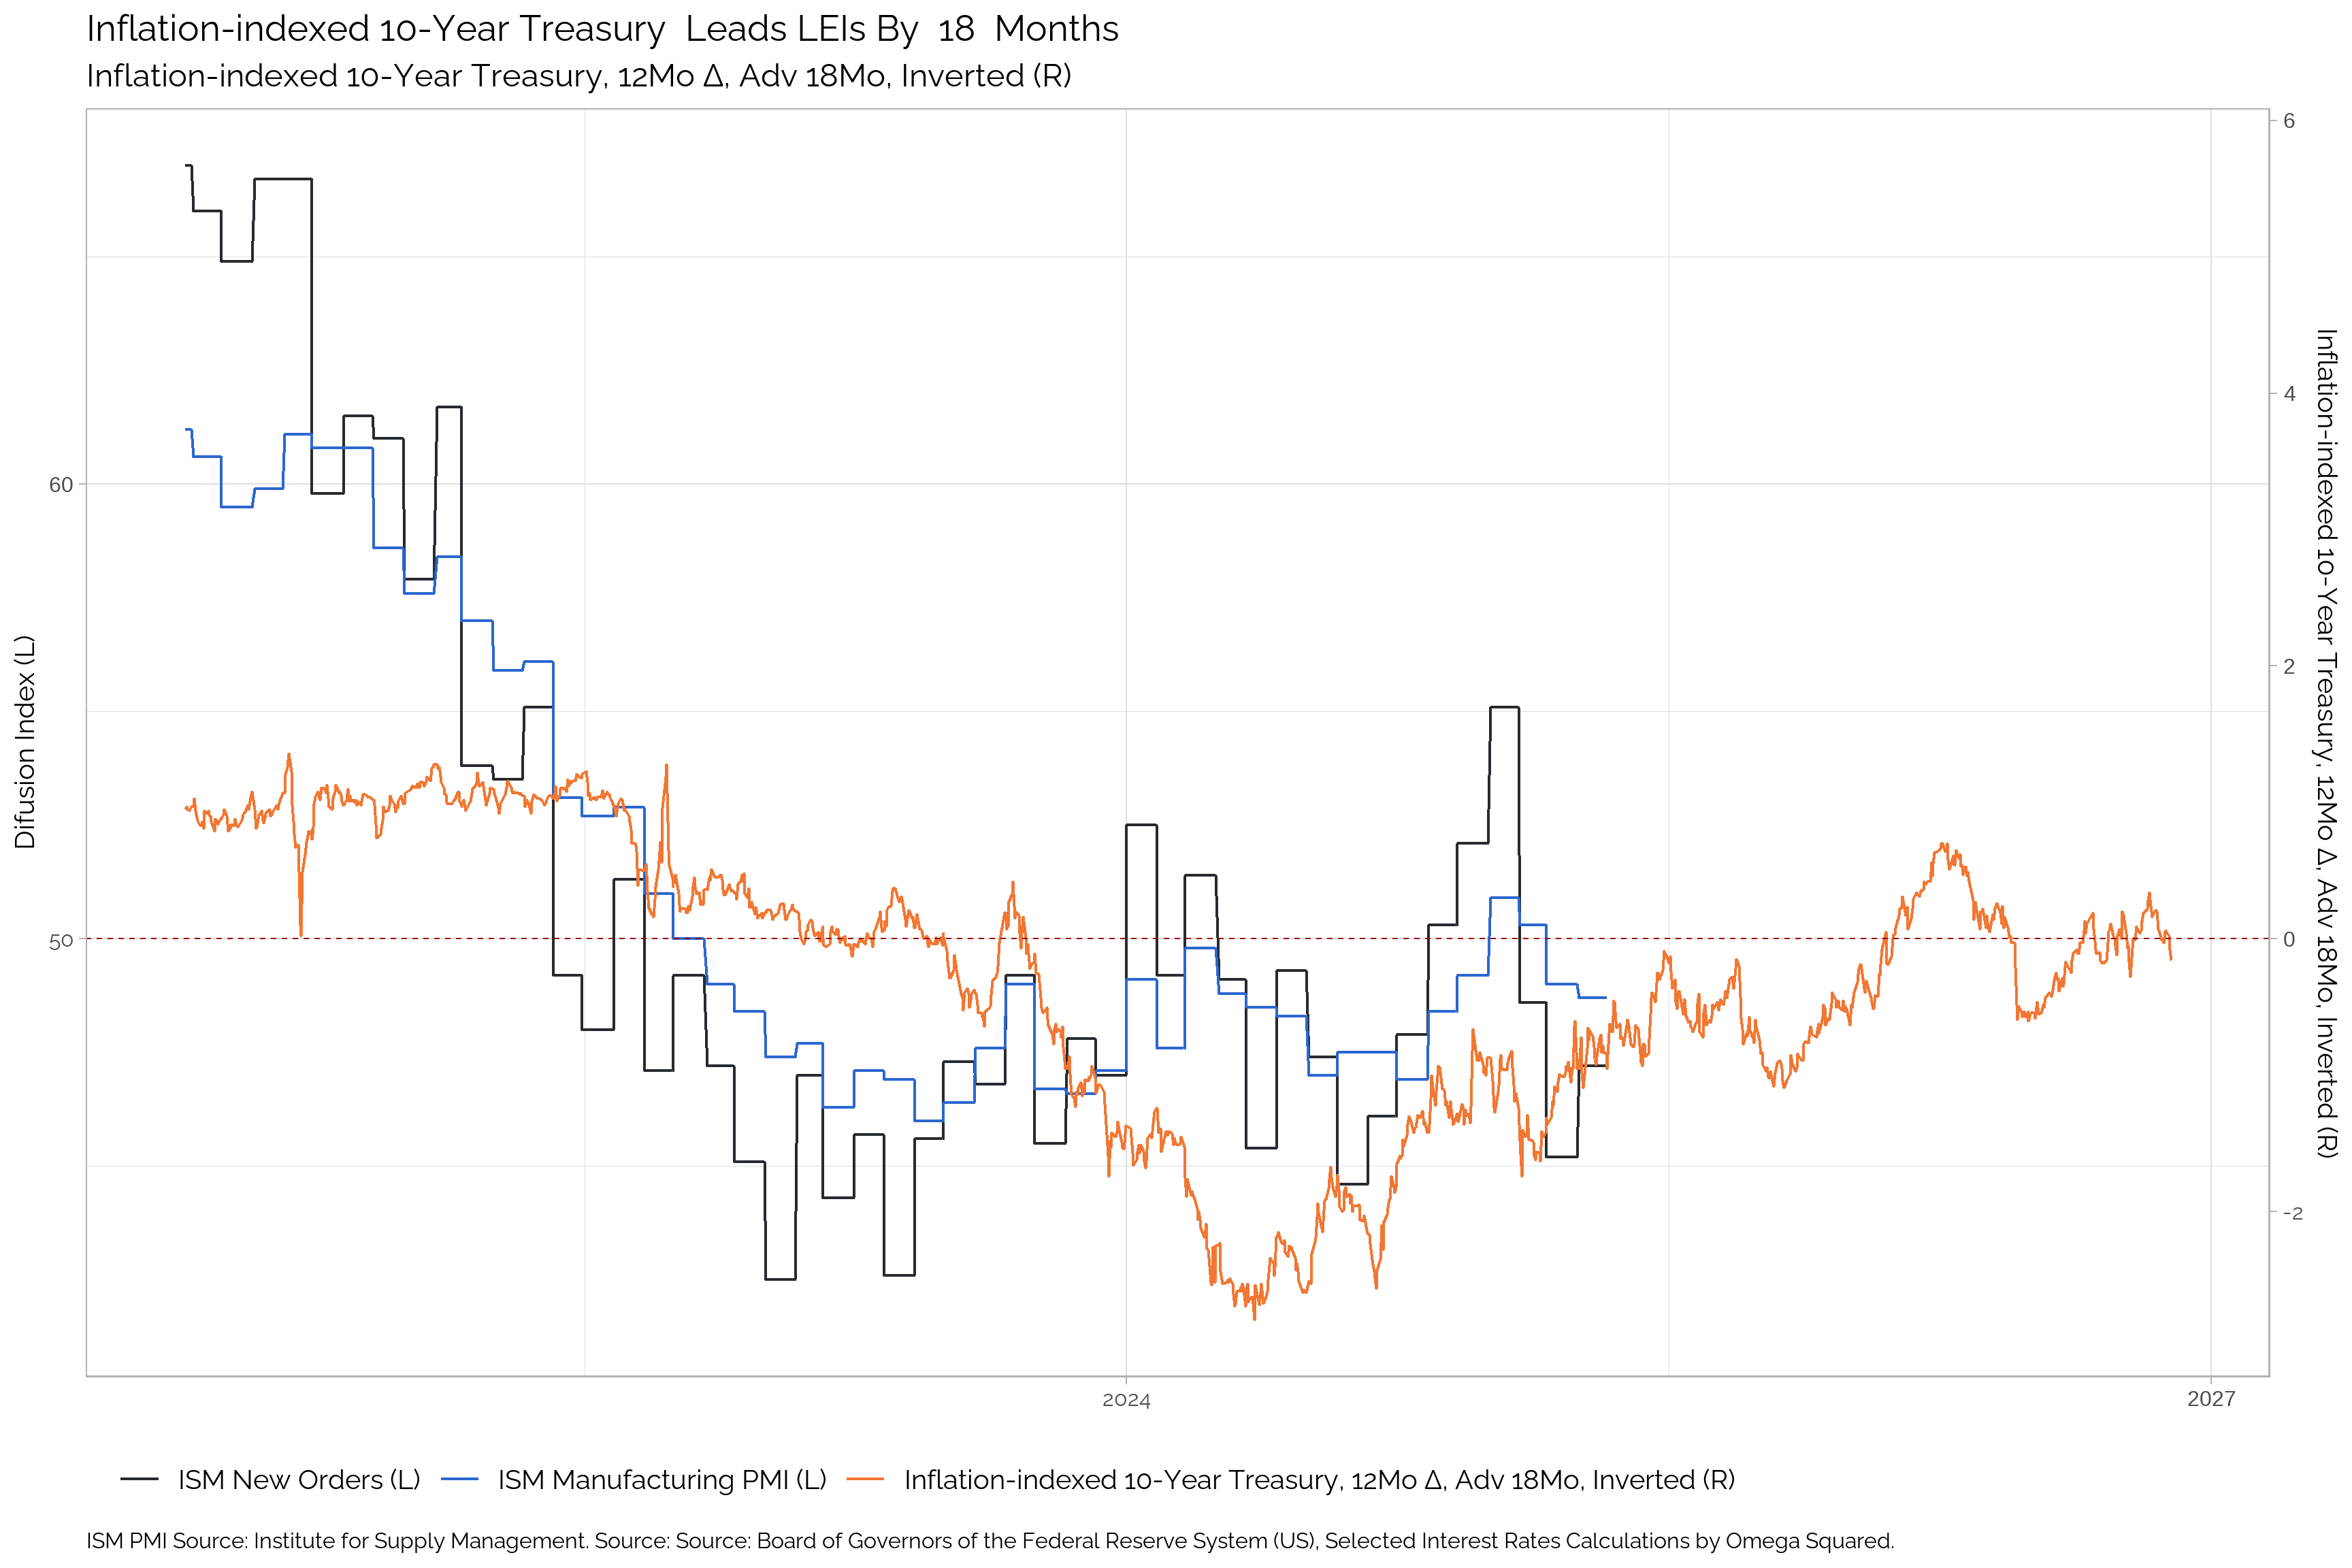
10Yr. Real Rates
| Apr-25 | Mar-25 | Feb-25 | Jan-25 | Dec-24 | Nov-24 | Oct-24 | Sep-24 | Aug-24 | Jul-24 | Jun-24 | May-24 | |
|---|---|---|---|---|---|---|---|---|---|---|---|---|
| Real Rates 10-Year Treasury | 1.85 | 1.86 | 2.16 | 2.24 | 1.92 | 1.95 | 1.63 | 1.76 | 1.85 | 2.08 | 2.16 | 2.28 |
| Δ in Real Rates 10-Year Treasury | -0.07 | -0.27 | -0.08 | 0.25 | -0.07 | 0.32 | -0.06 | -0.09 | -0.23 | -0.12 | -0.12 | 0.4 |
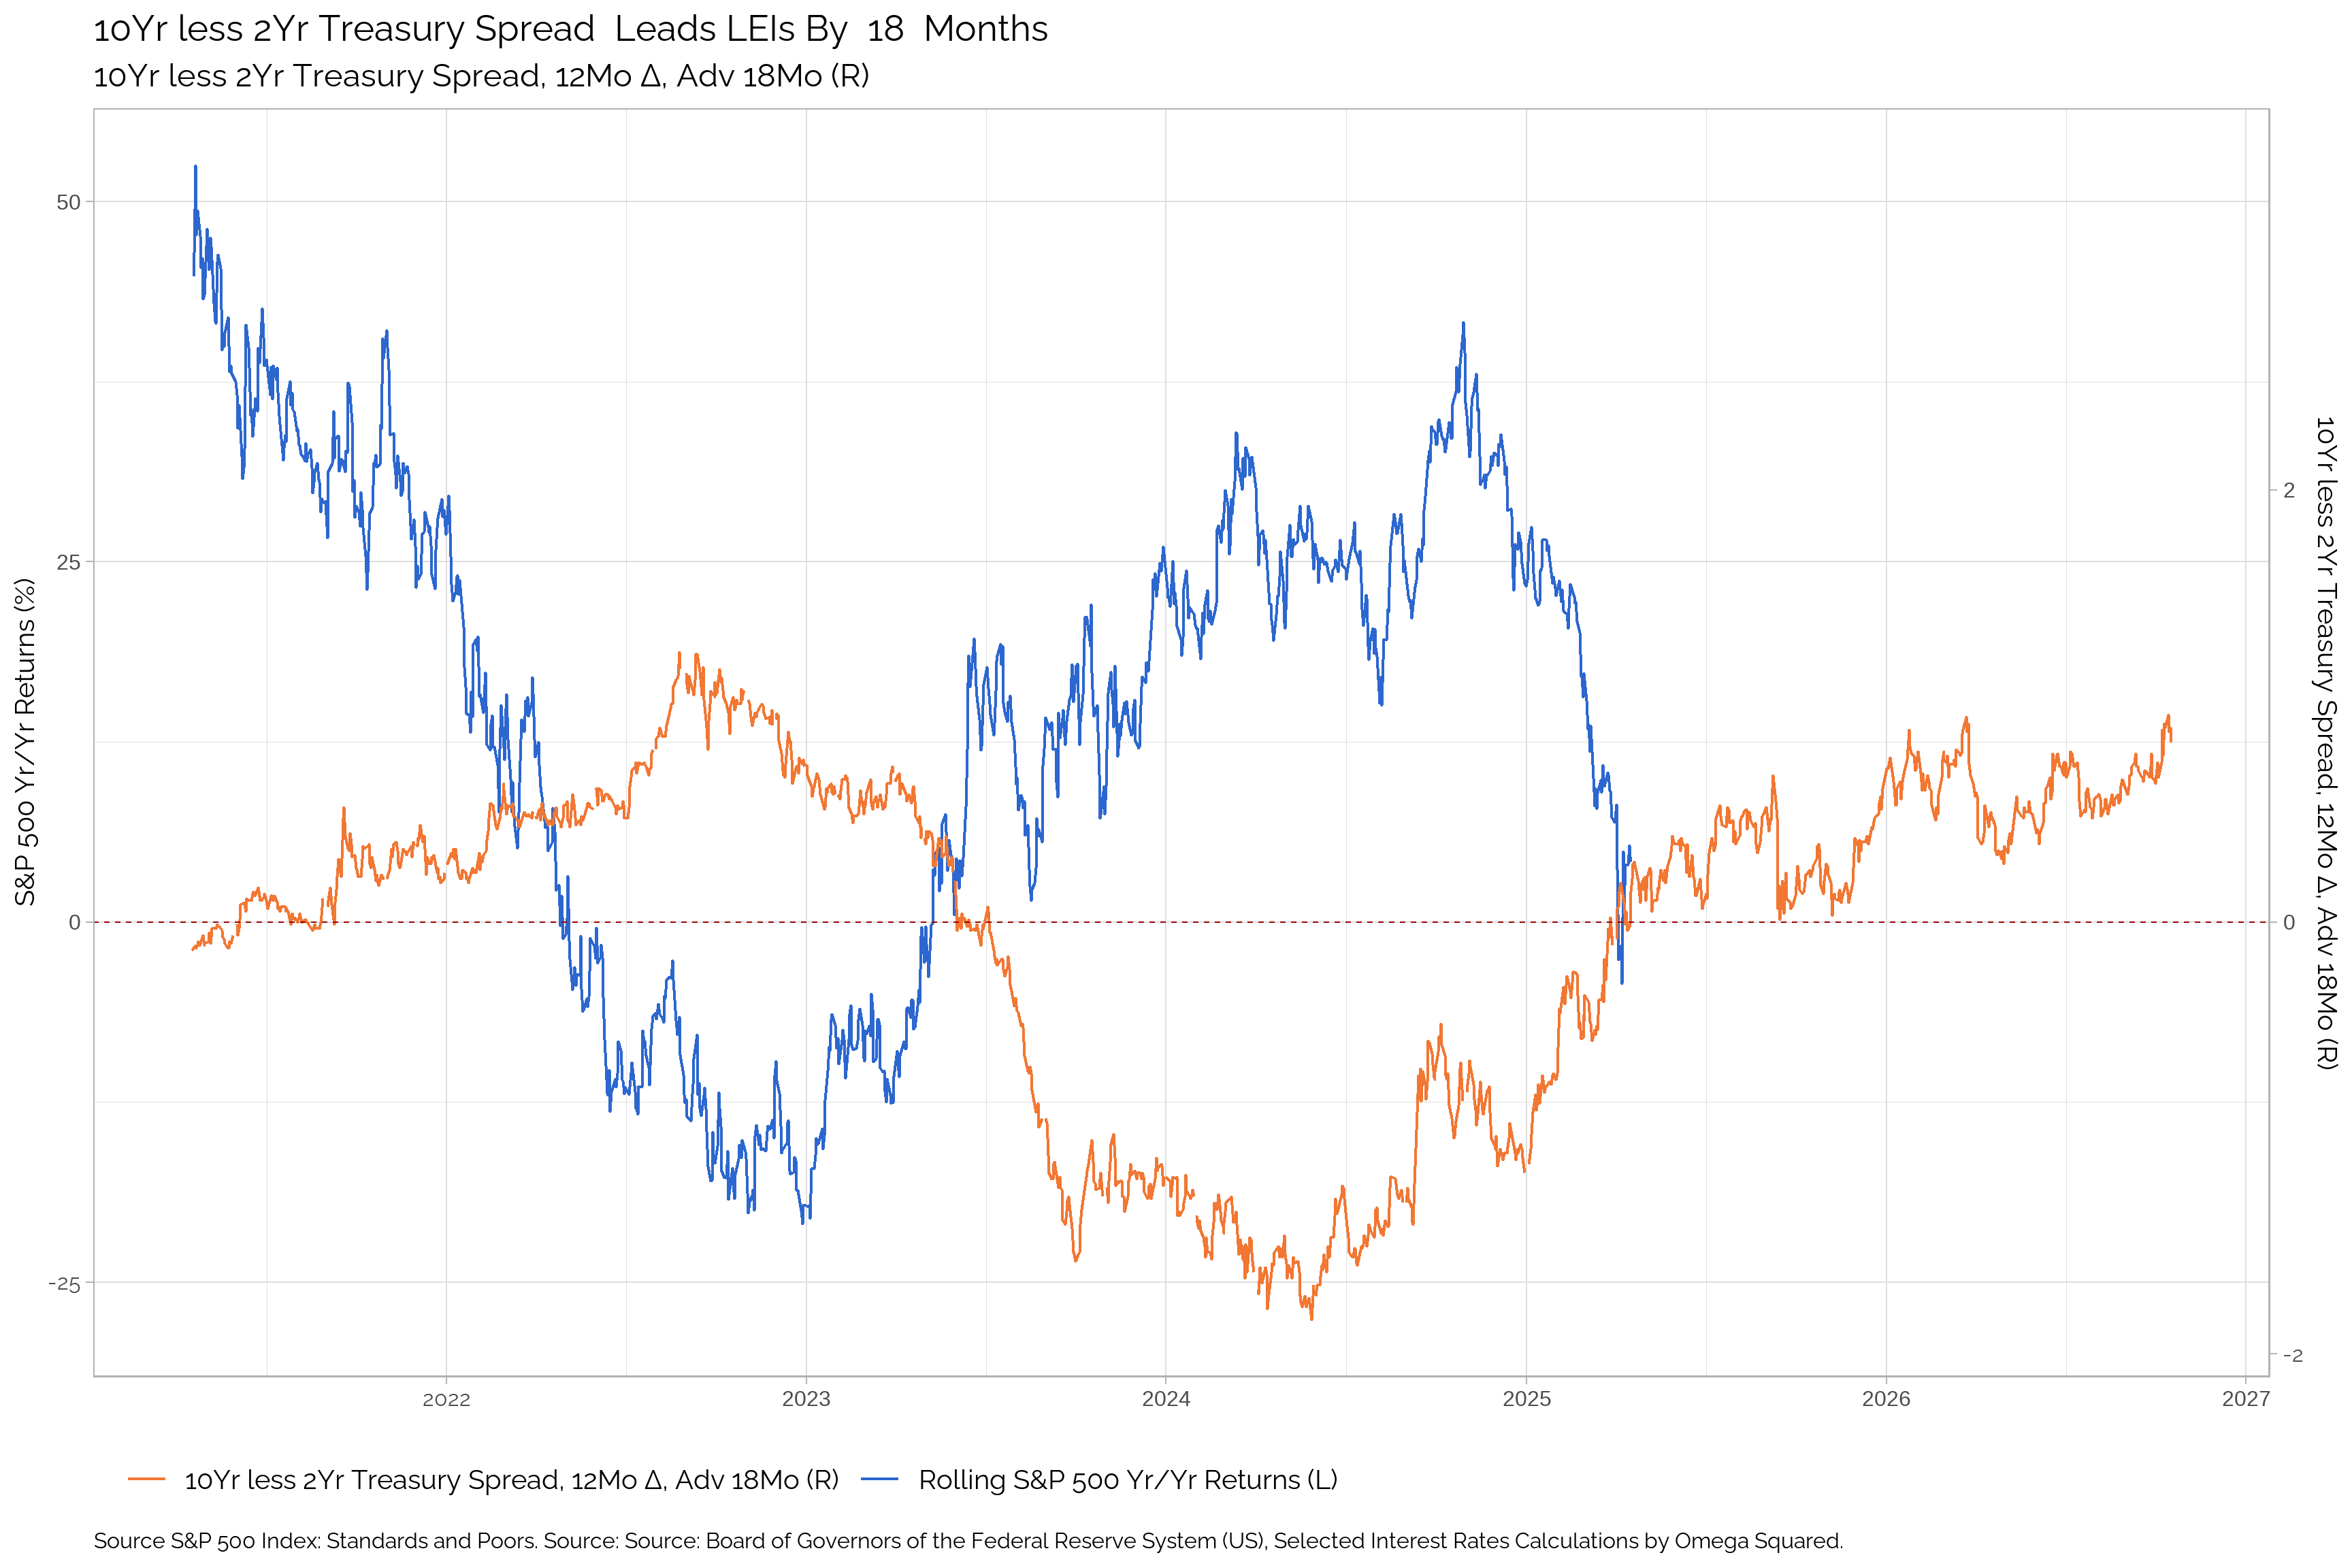
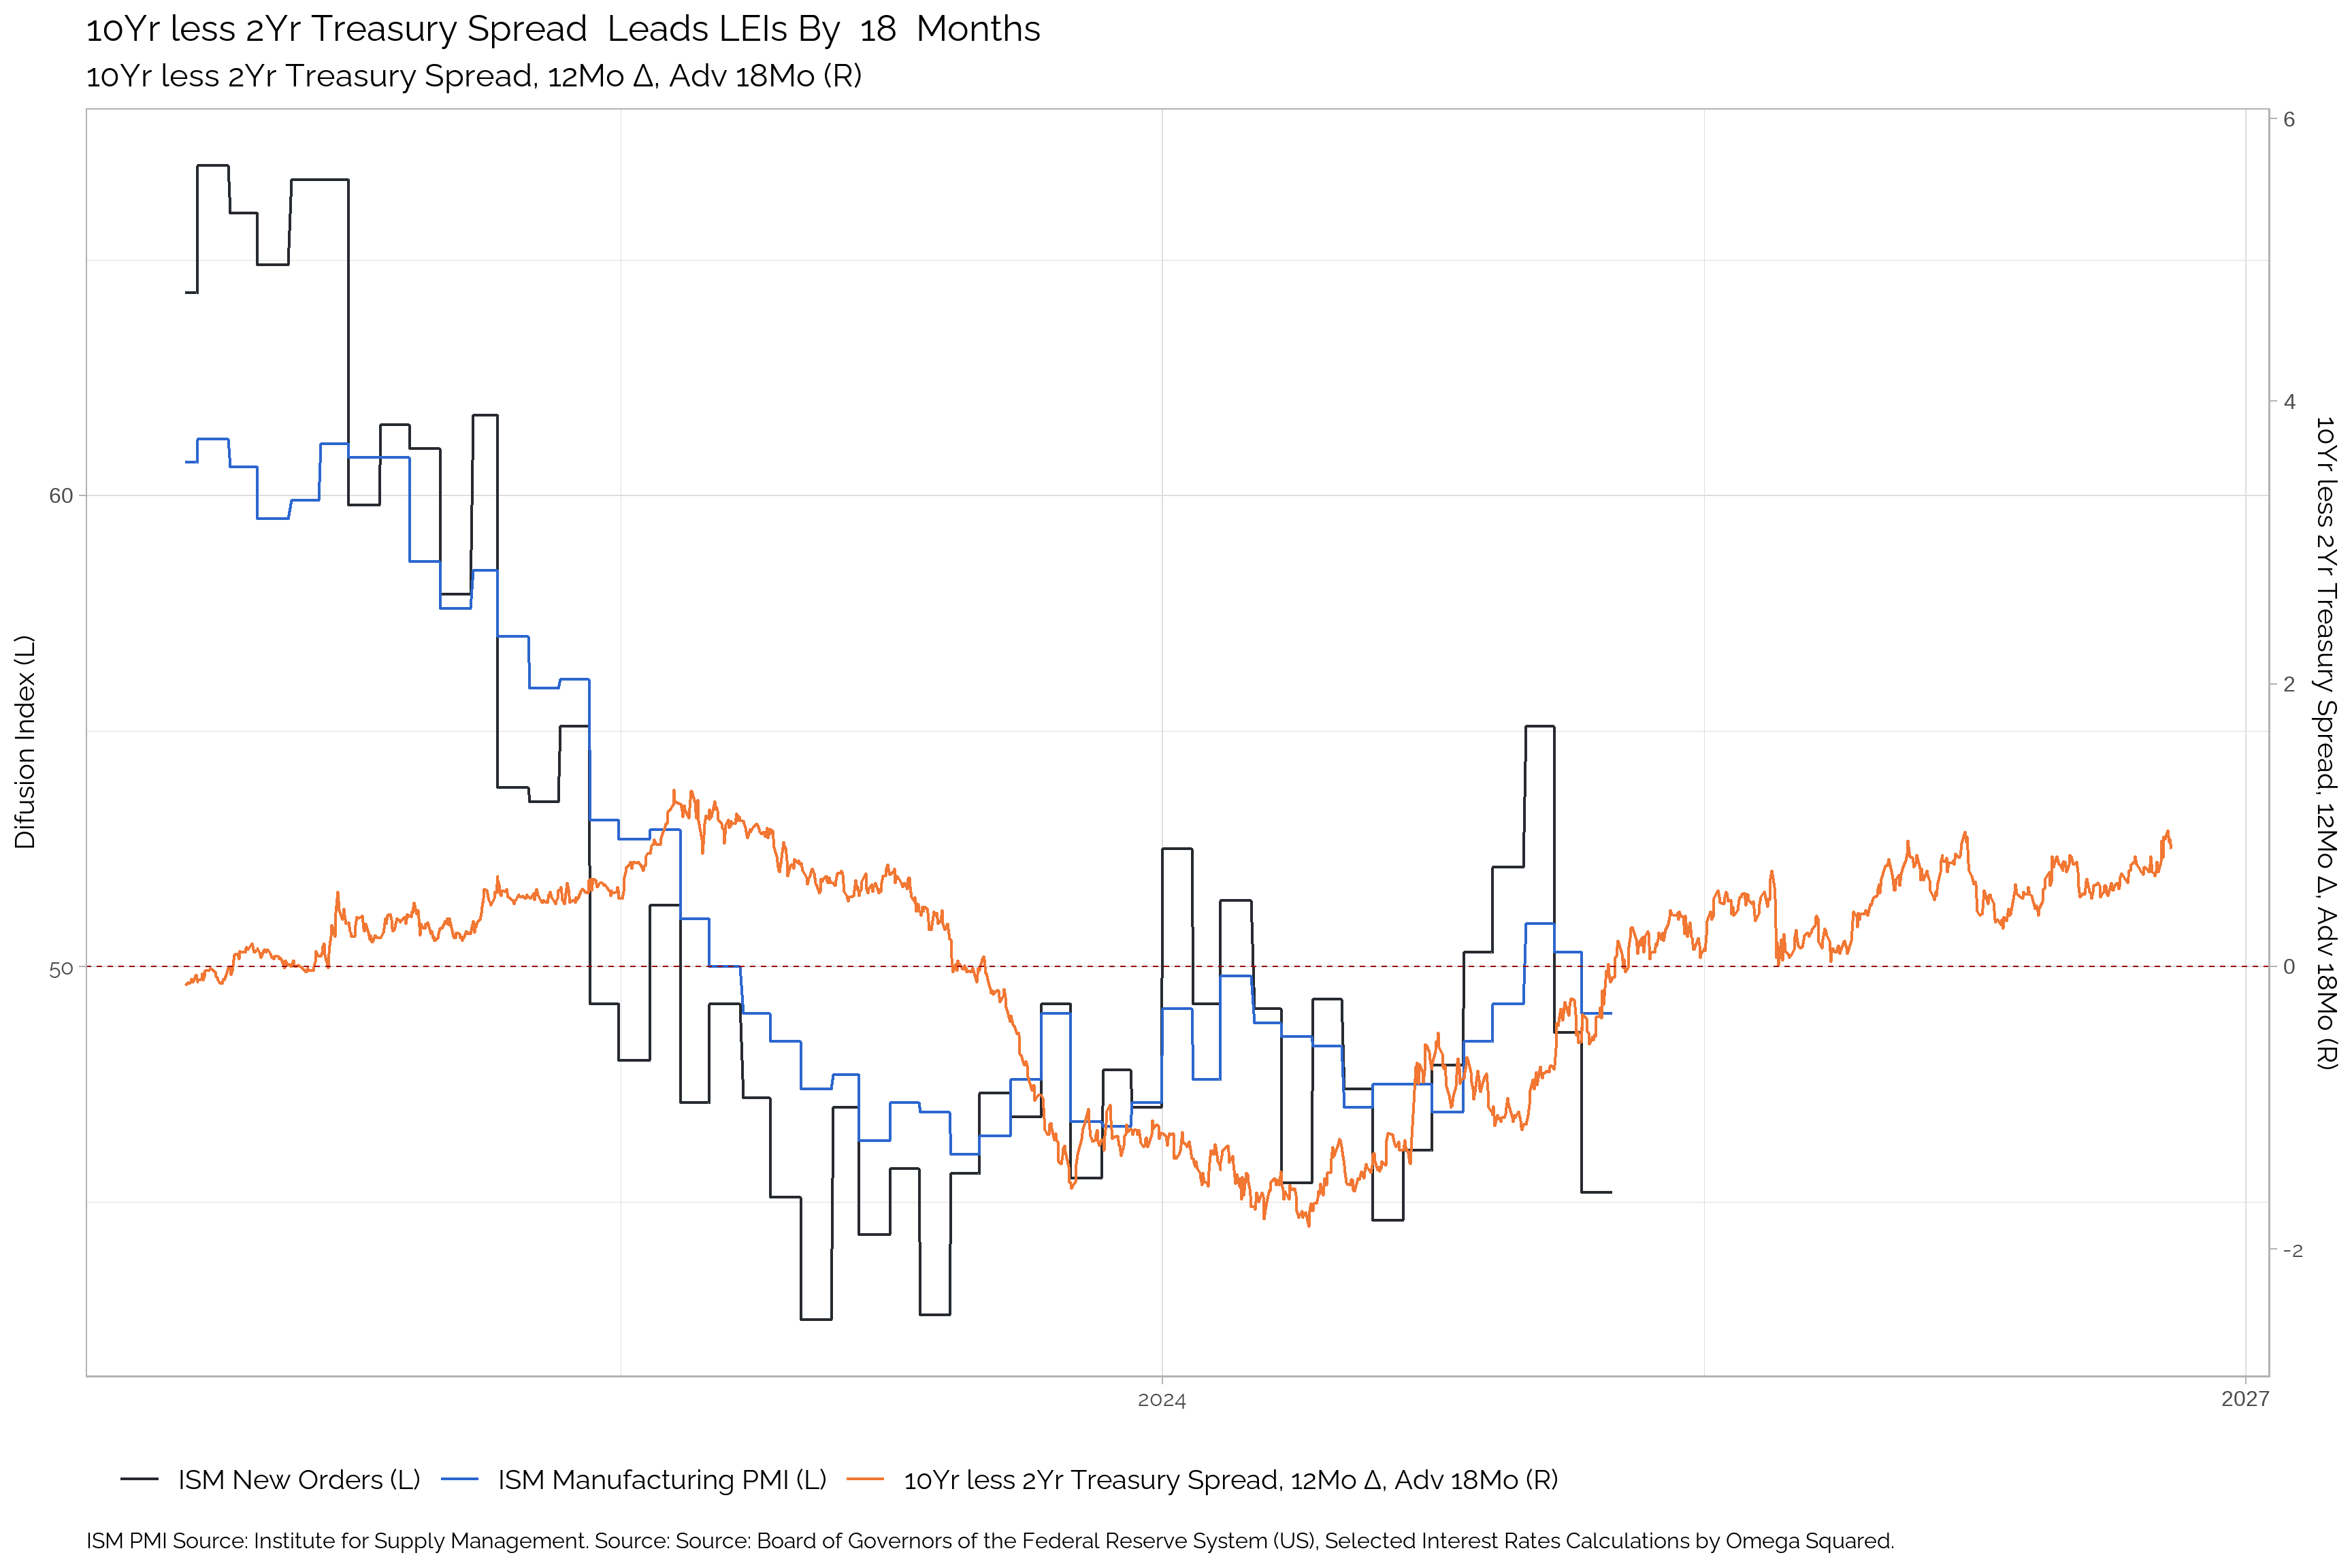
10Yr less 2Yr Treasury Spread
| Apr-25 | Mar-25 | Feb-25 | Jan-25 | Dec-24 | Nov-24 | Oct-24 | Sep-24 | Aug-24 | Jul-24 | Jun-24 | May-24 | |
|---|---|---|---|---|---|---|---|---|---|---|---|---|
| 10Yr less 2Yr Treasury Spread | 0.34 | 0.25 | 0.36 | 0.33 | 0.05 | 0.12 | 0.15 | 0 | -0.2 | -0.35 | -0.38 | -0.35 |
| Δ in 10Yr less 2Yr Treasury Spread | 0.12 | -0.11 | 0.05 | 0.27 | -0.11 | -0.03 | 0.14 | 0.2 | 0.15 | 0.05 | -0.03 | 0.04 |
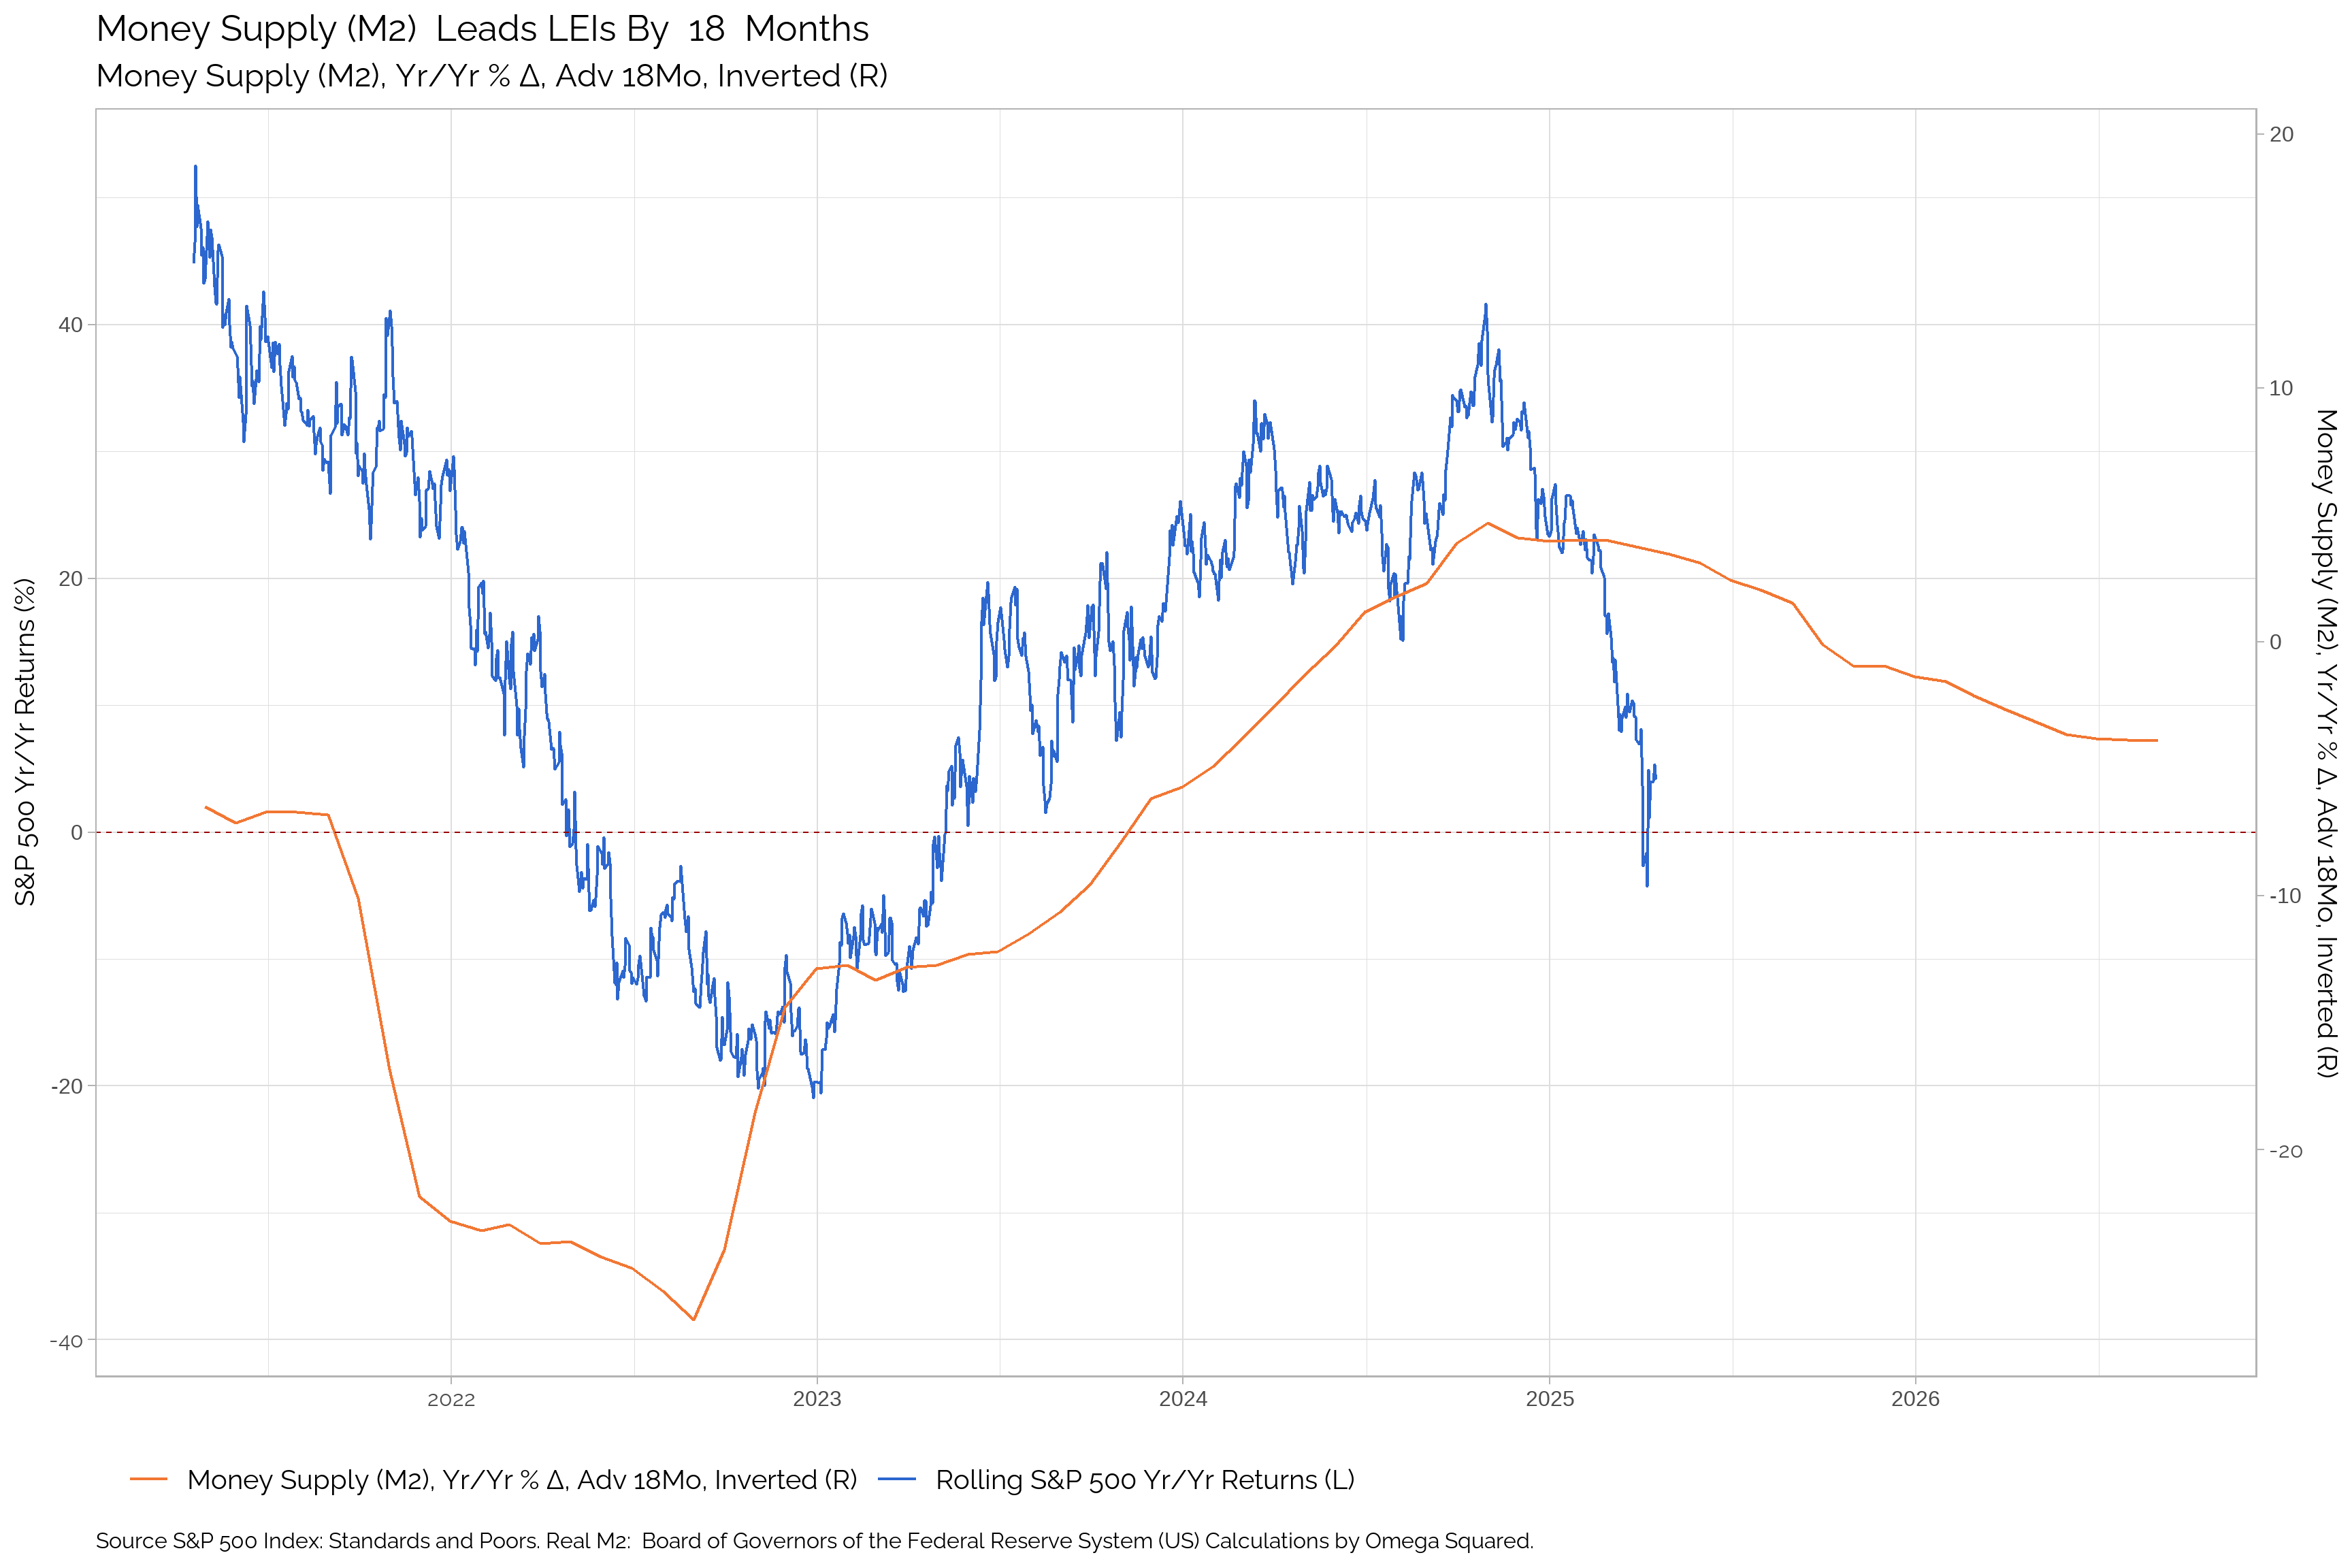
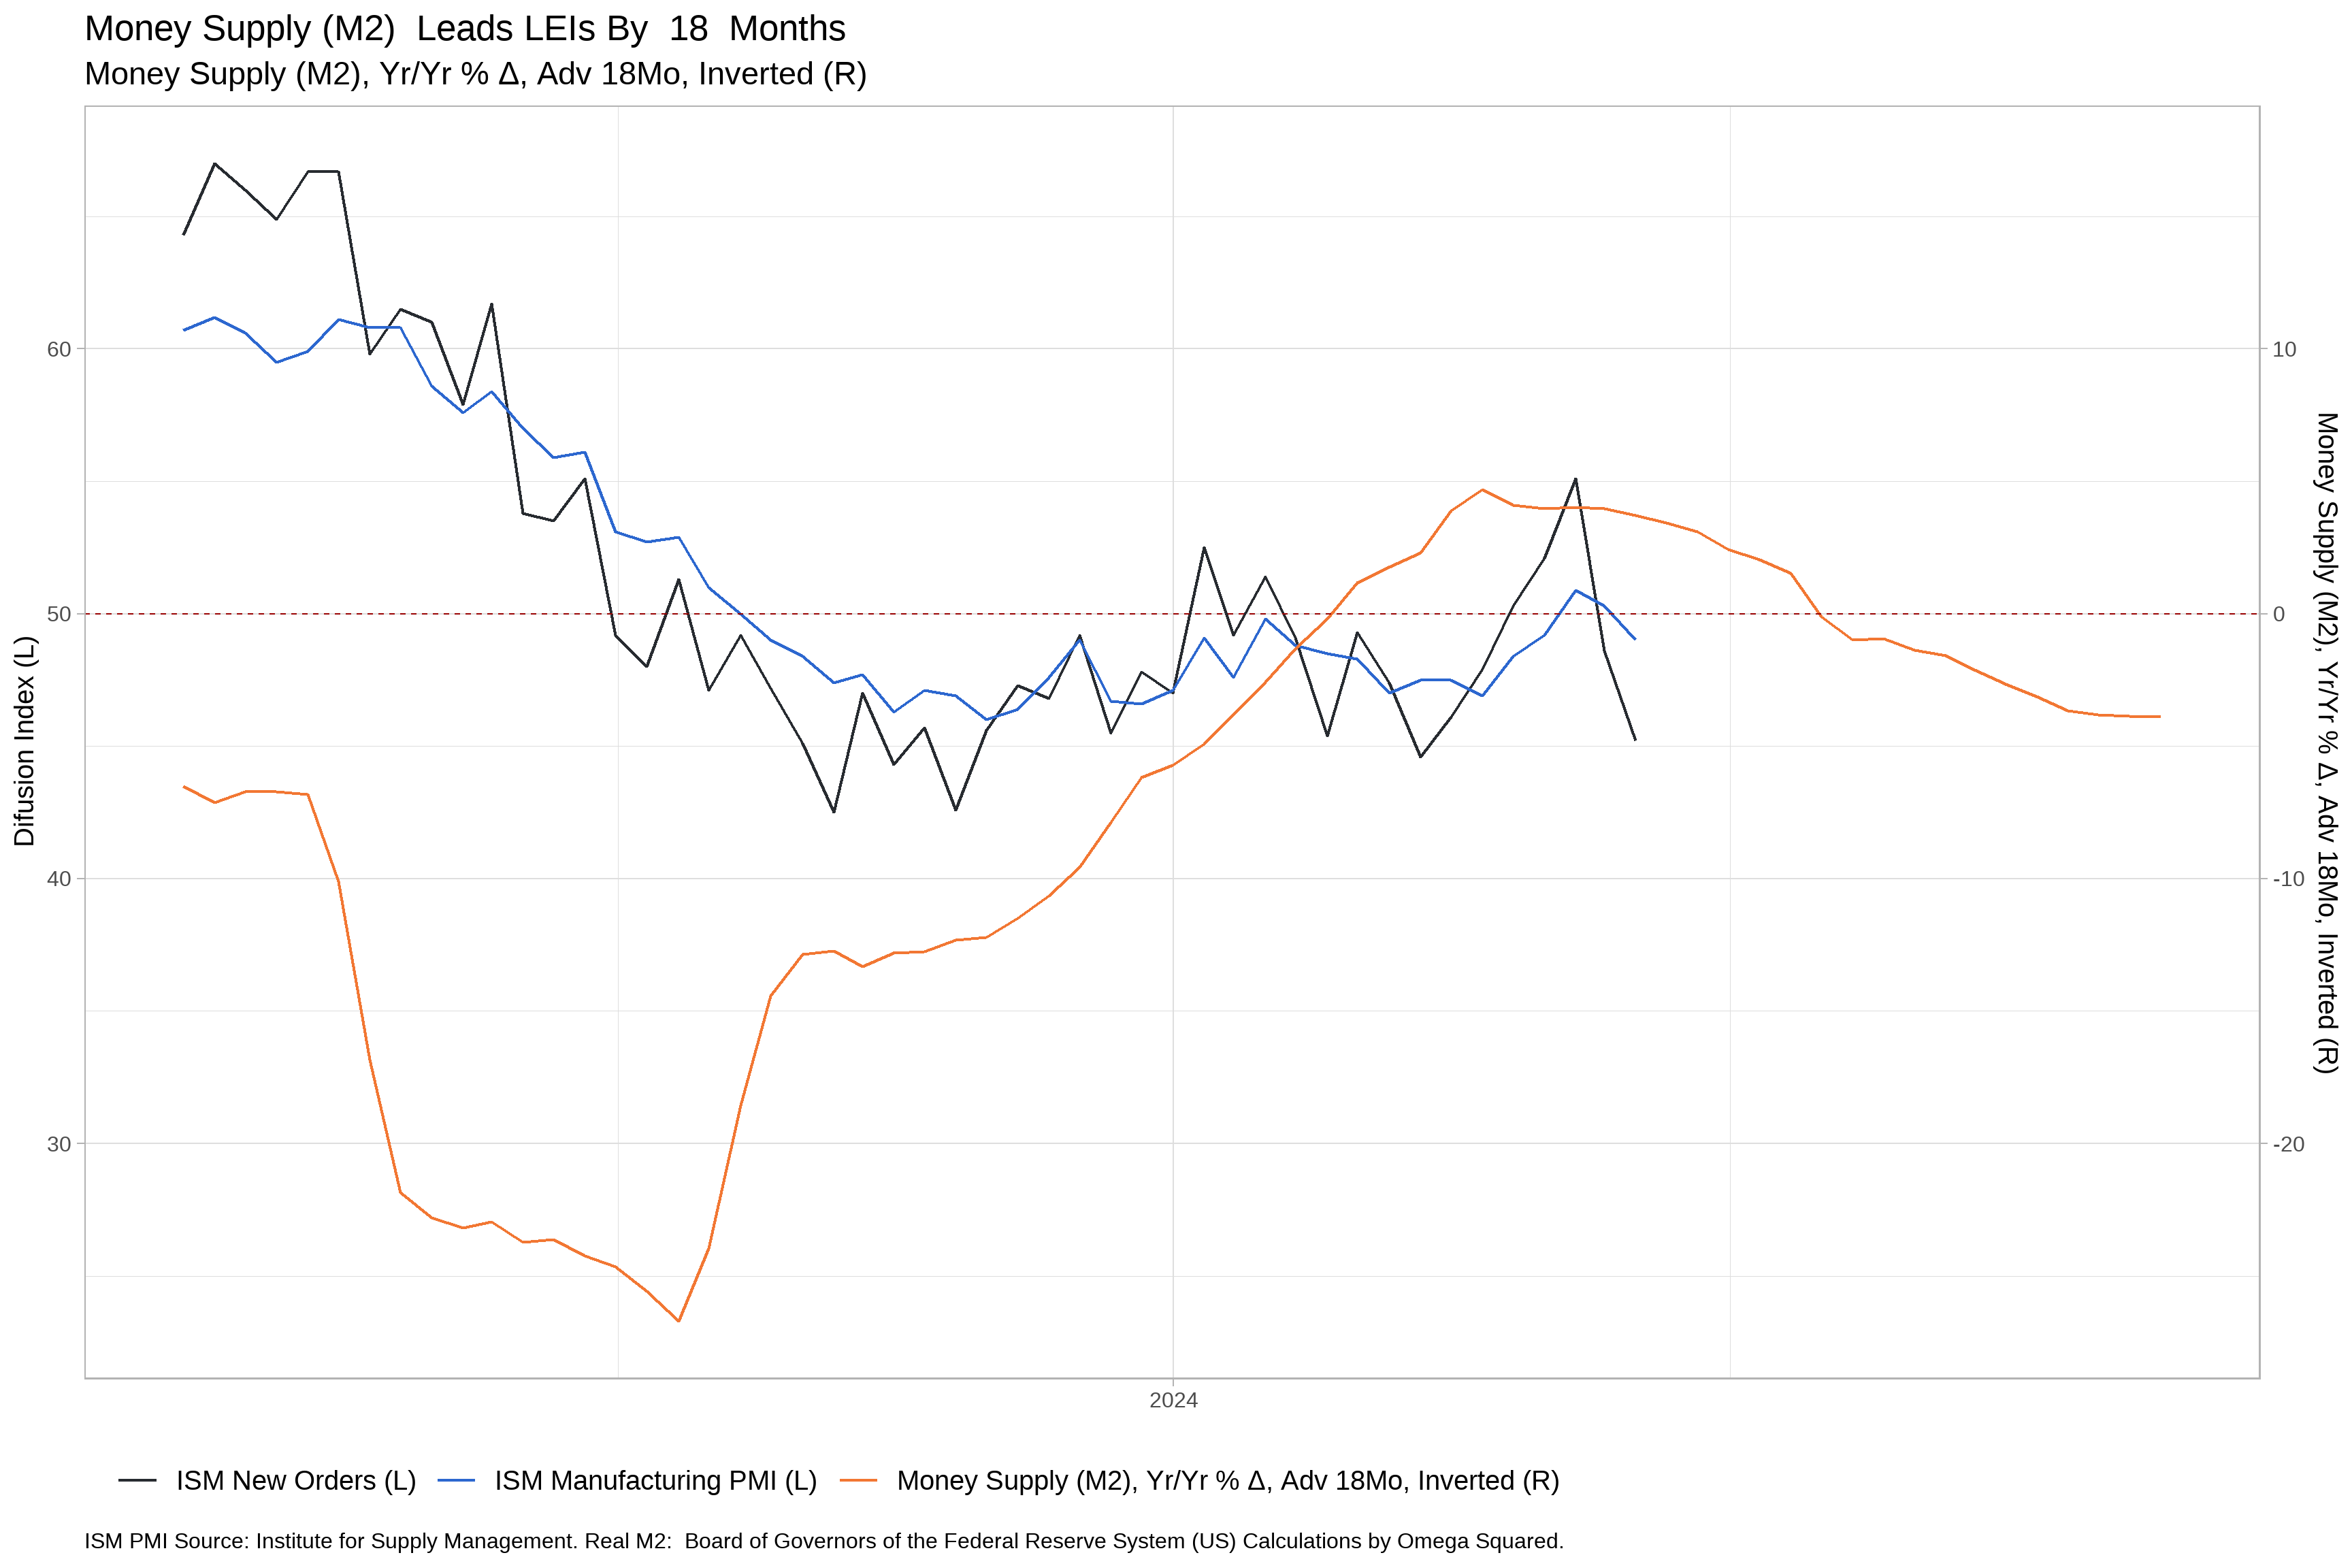
Money Supply (M2)
| Apr-25 | Mar-25 | Feb-25 | Jan-25 | Dec-24 | Nov-24 | Oct-24 | Sep-24 | Aug-24 | Jul-24 | Jun-24 | May-24 | |
|---|---|---|---|---|---|---|---|---|---|---|---|---|
| M2 | -- | 21671 | 21577 | 21490 | 21454 | 21336 | 21272 | 21186 | 21098 | 21066 | 20997 | 20933 |
| Δ in M2 | -- | 94 | 87 | 36 | 118 | 64 | 86 | 88 | 32 | 69 | 64 | 31 |
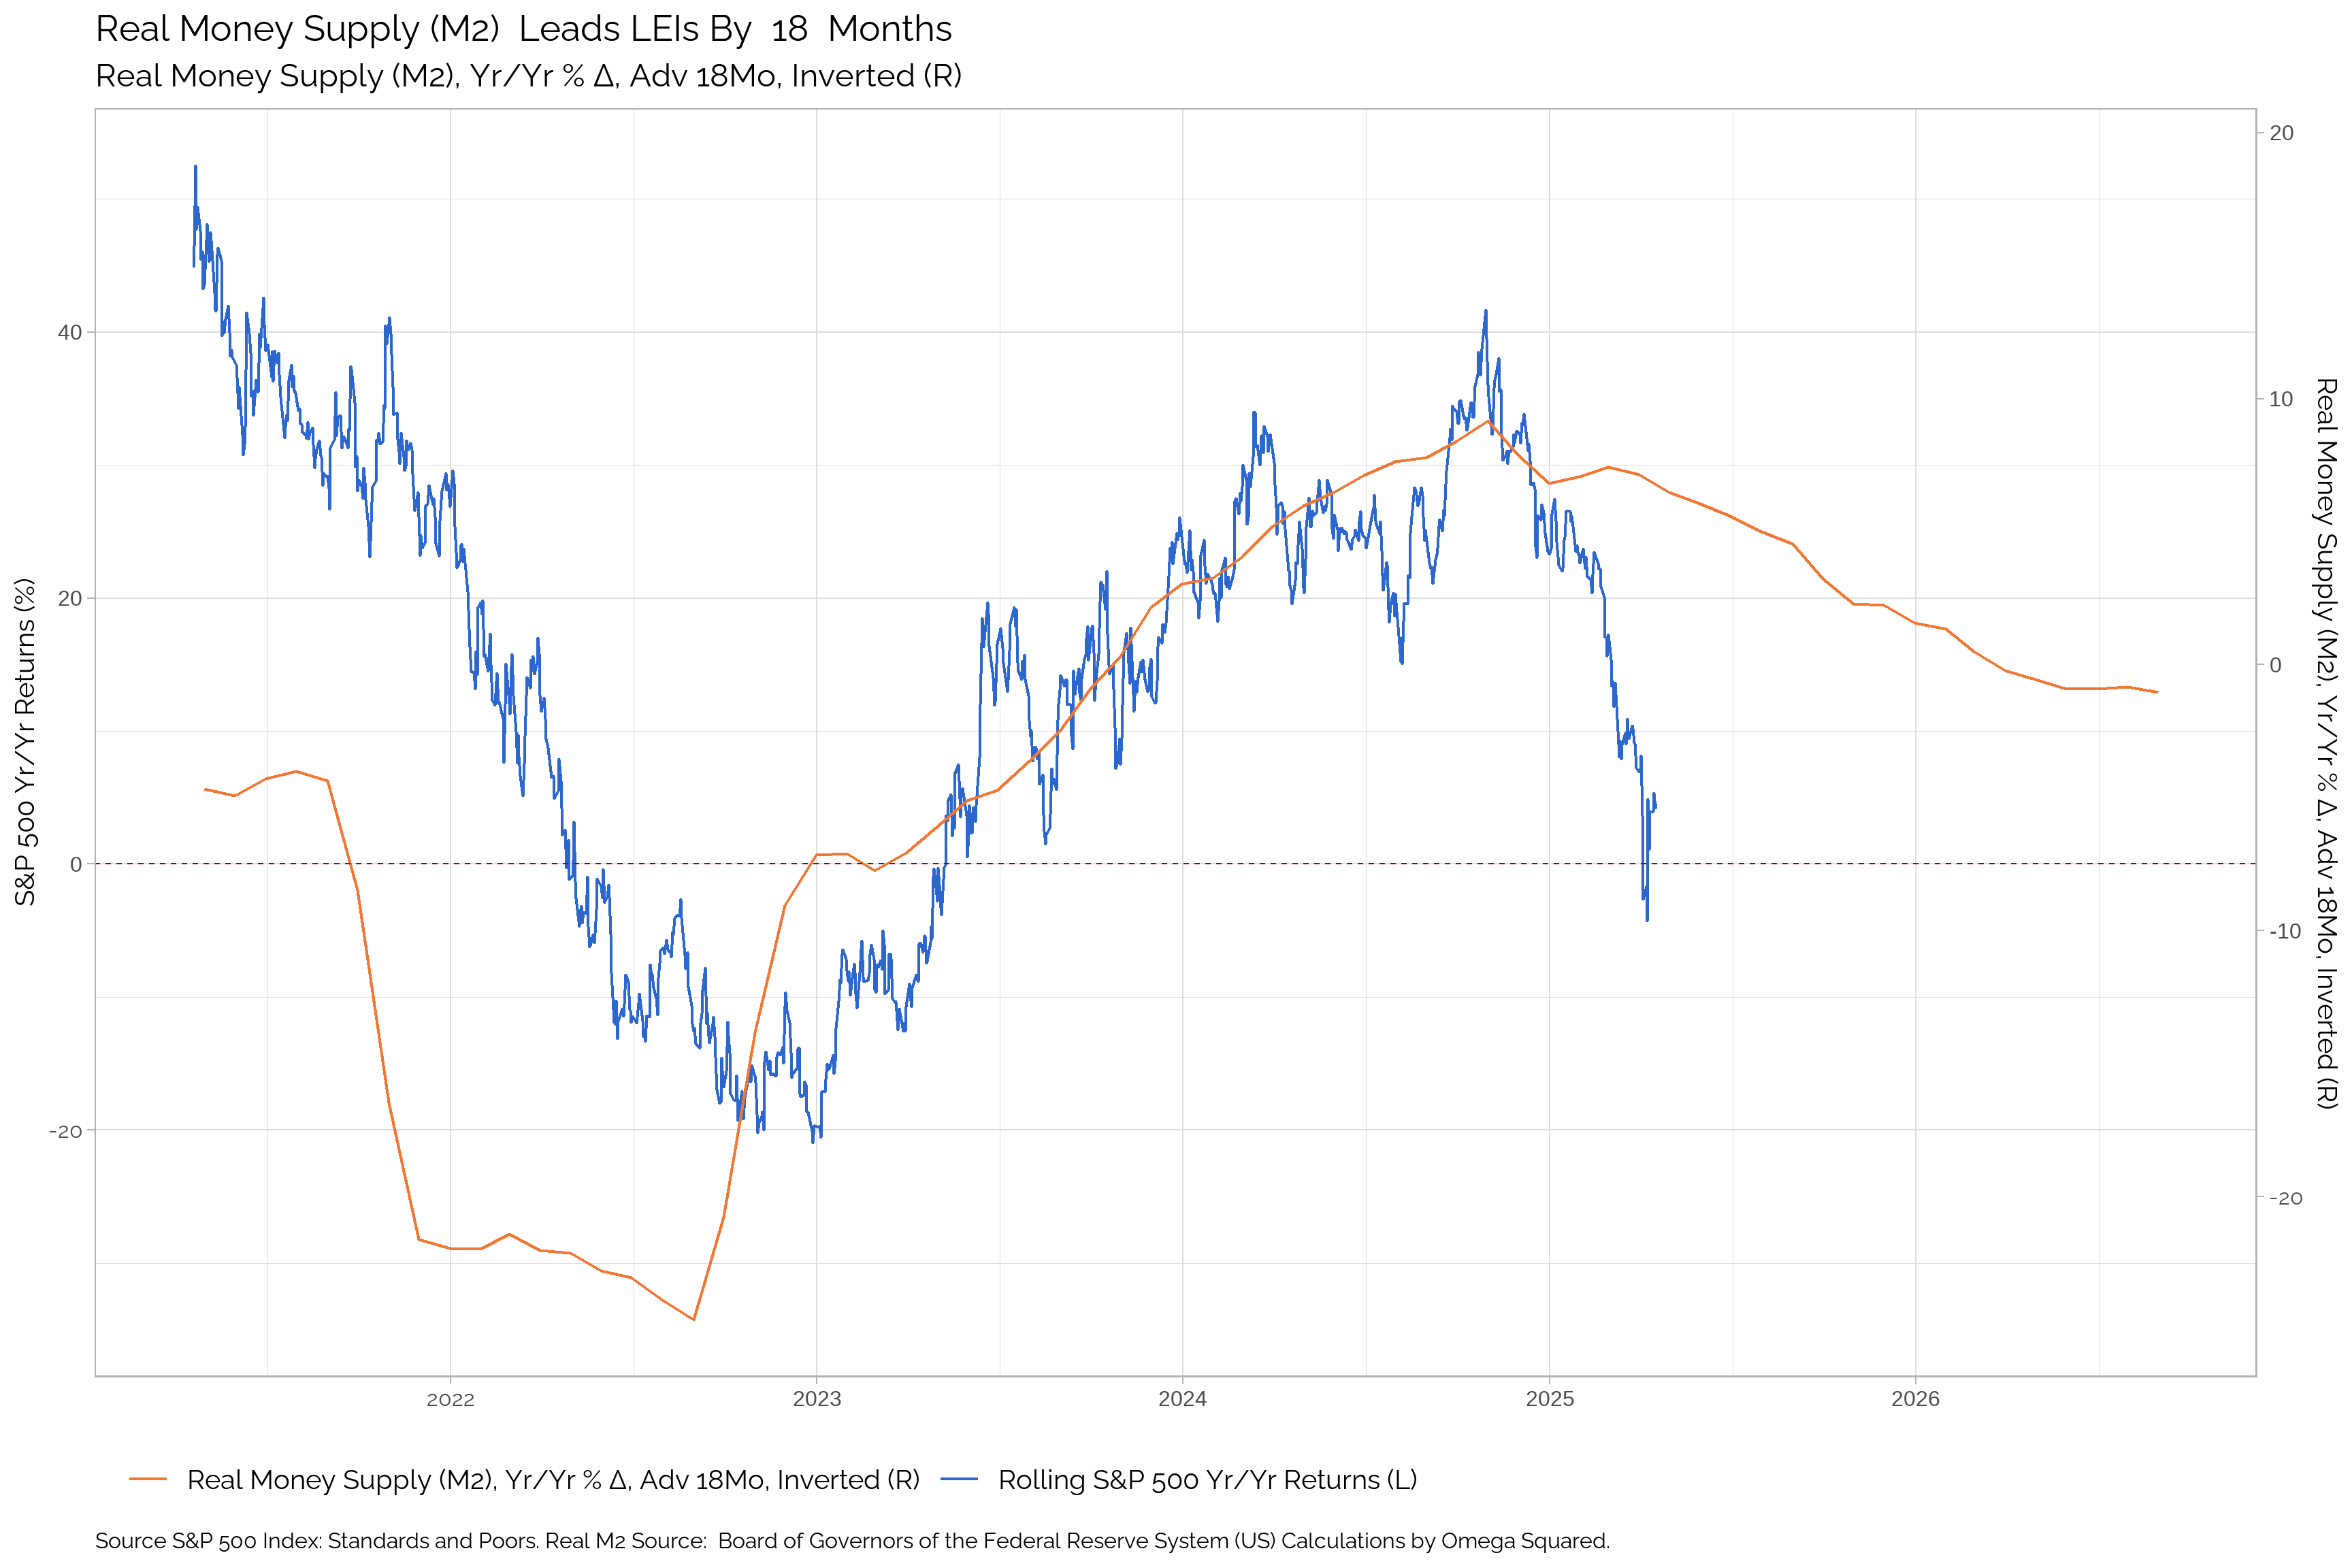
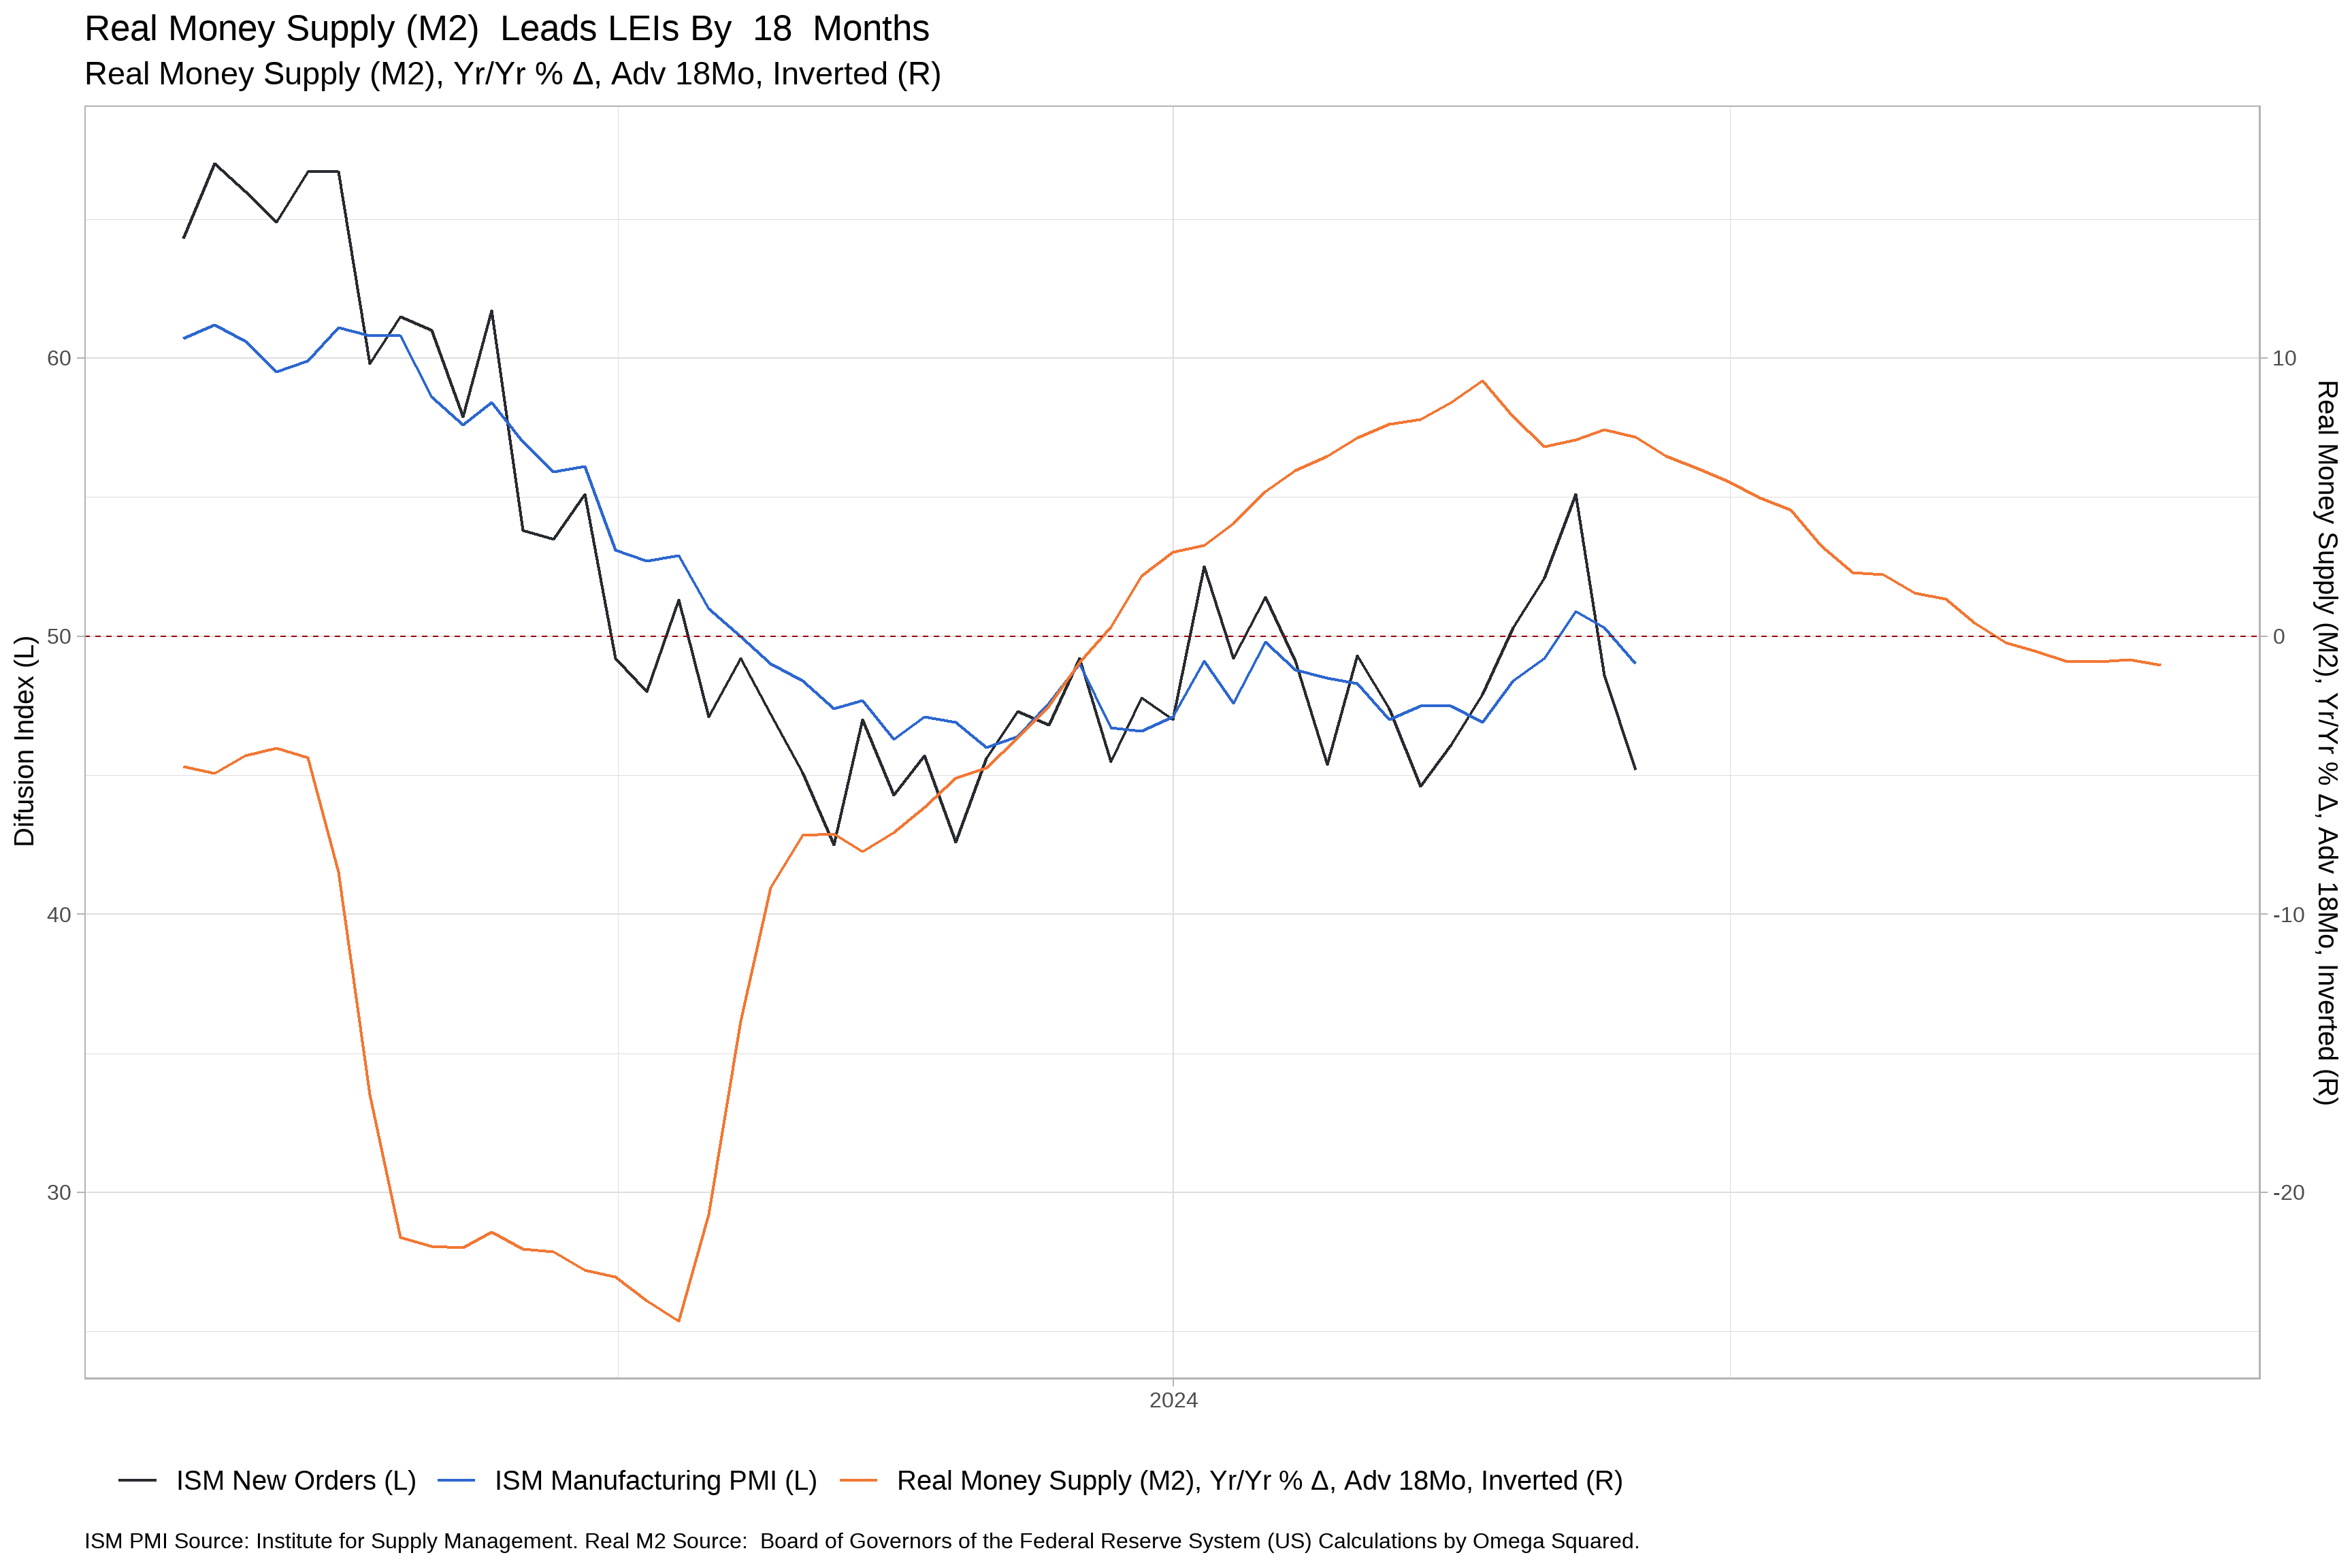
Real Money Supply (M2)
| Apr-25 | Mar-25 | Feb-25 | Jan-25 | Dec-24 | Nov-24 | Oct-24 | Sep-24 | Aug-24 | Jul-24 | Jun-24 | May-24 | |
|---|---|---|---|---|---|---|---|---|---|---|---|---|
| Real M2 | -- | 6777 | 6762 | 6766 | 6780 | 6761 | 6756 | 6744 | 6728 | 6727 | 6705 | 6688 |
| Δ in Real M2 | -- | 15 | -4 | -14 | 19 | 5 | 12 | 16 | 1 | 22 | 17 | -9 |
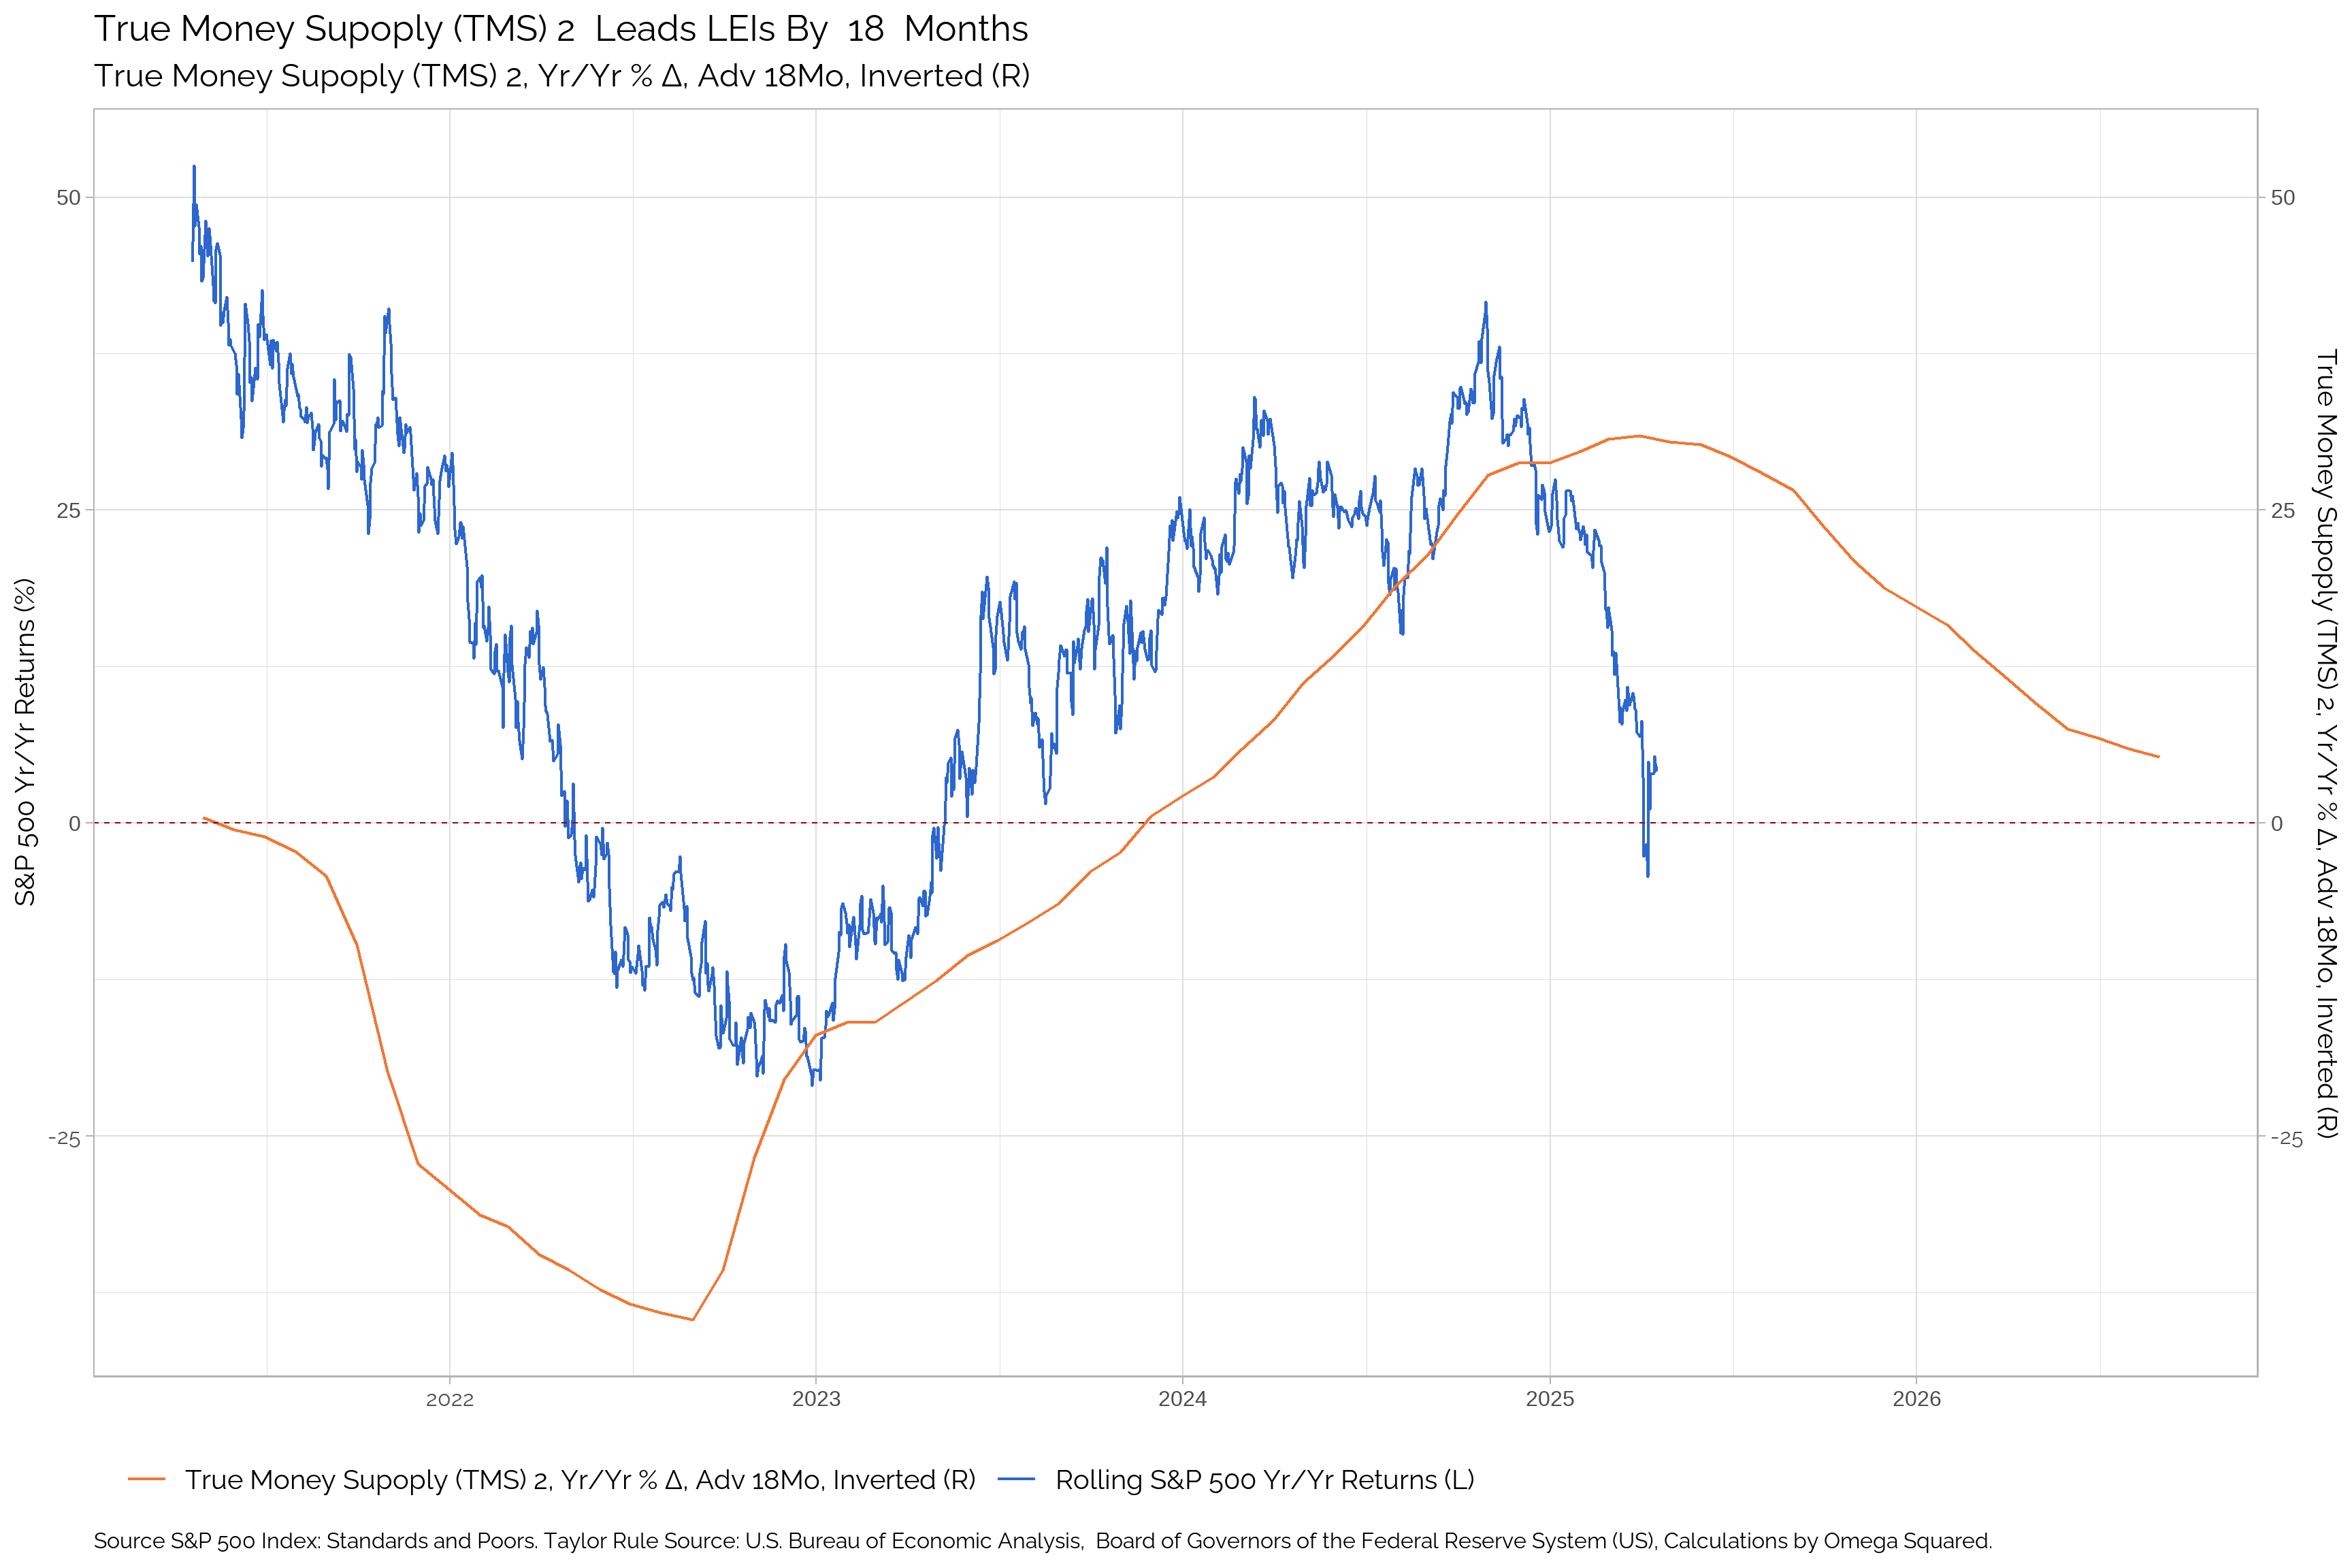
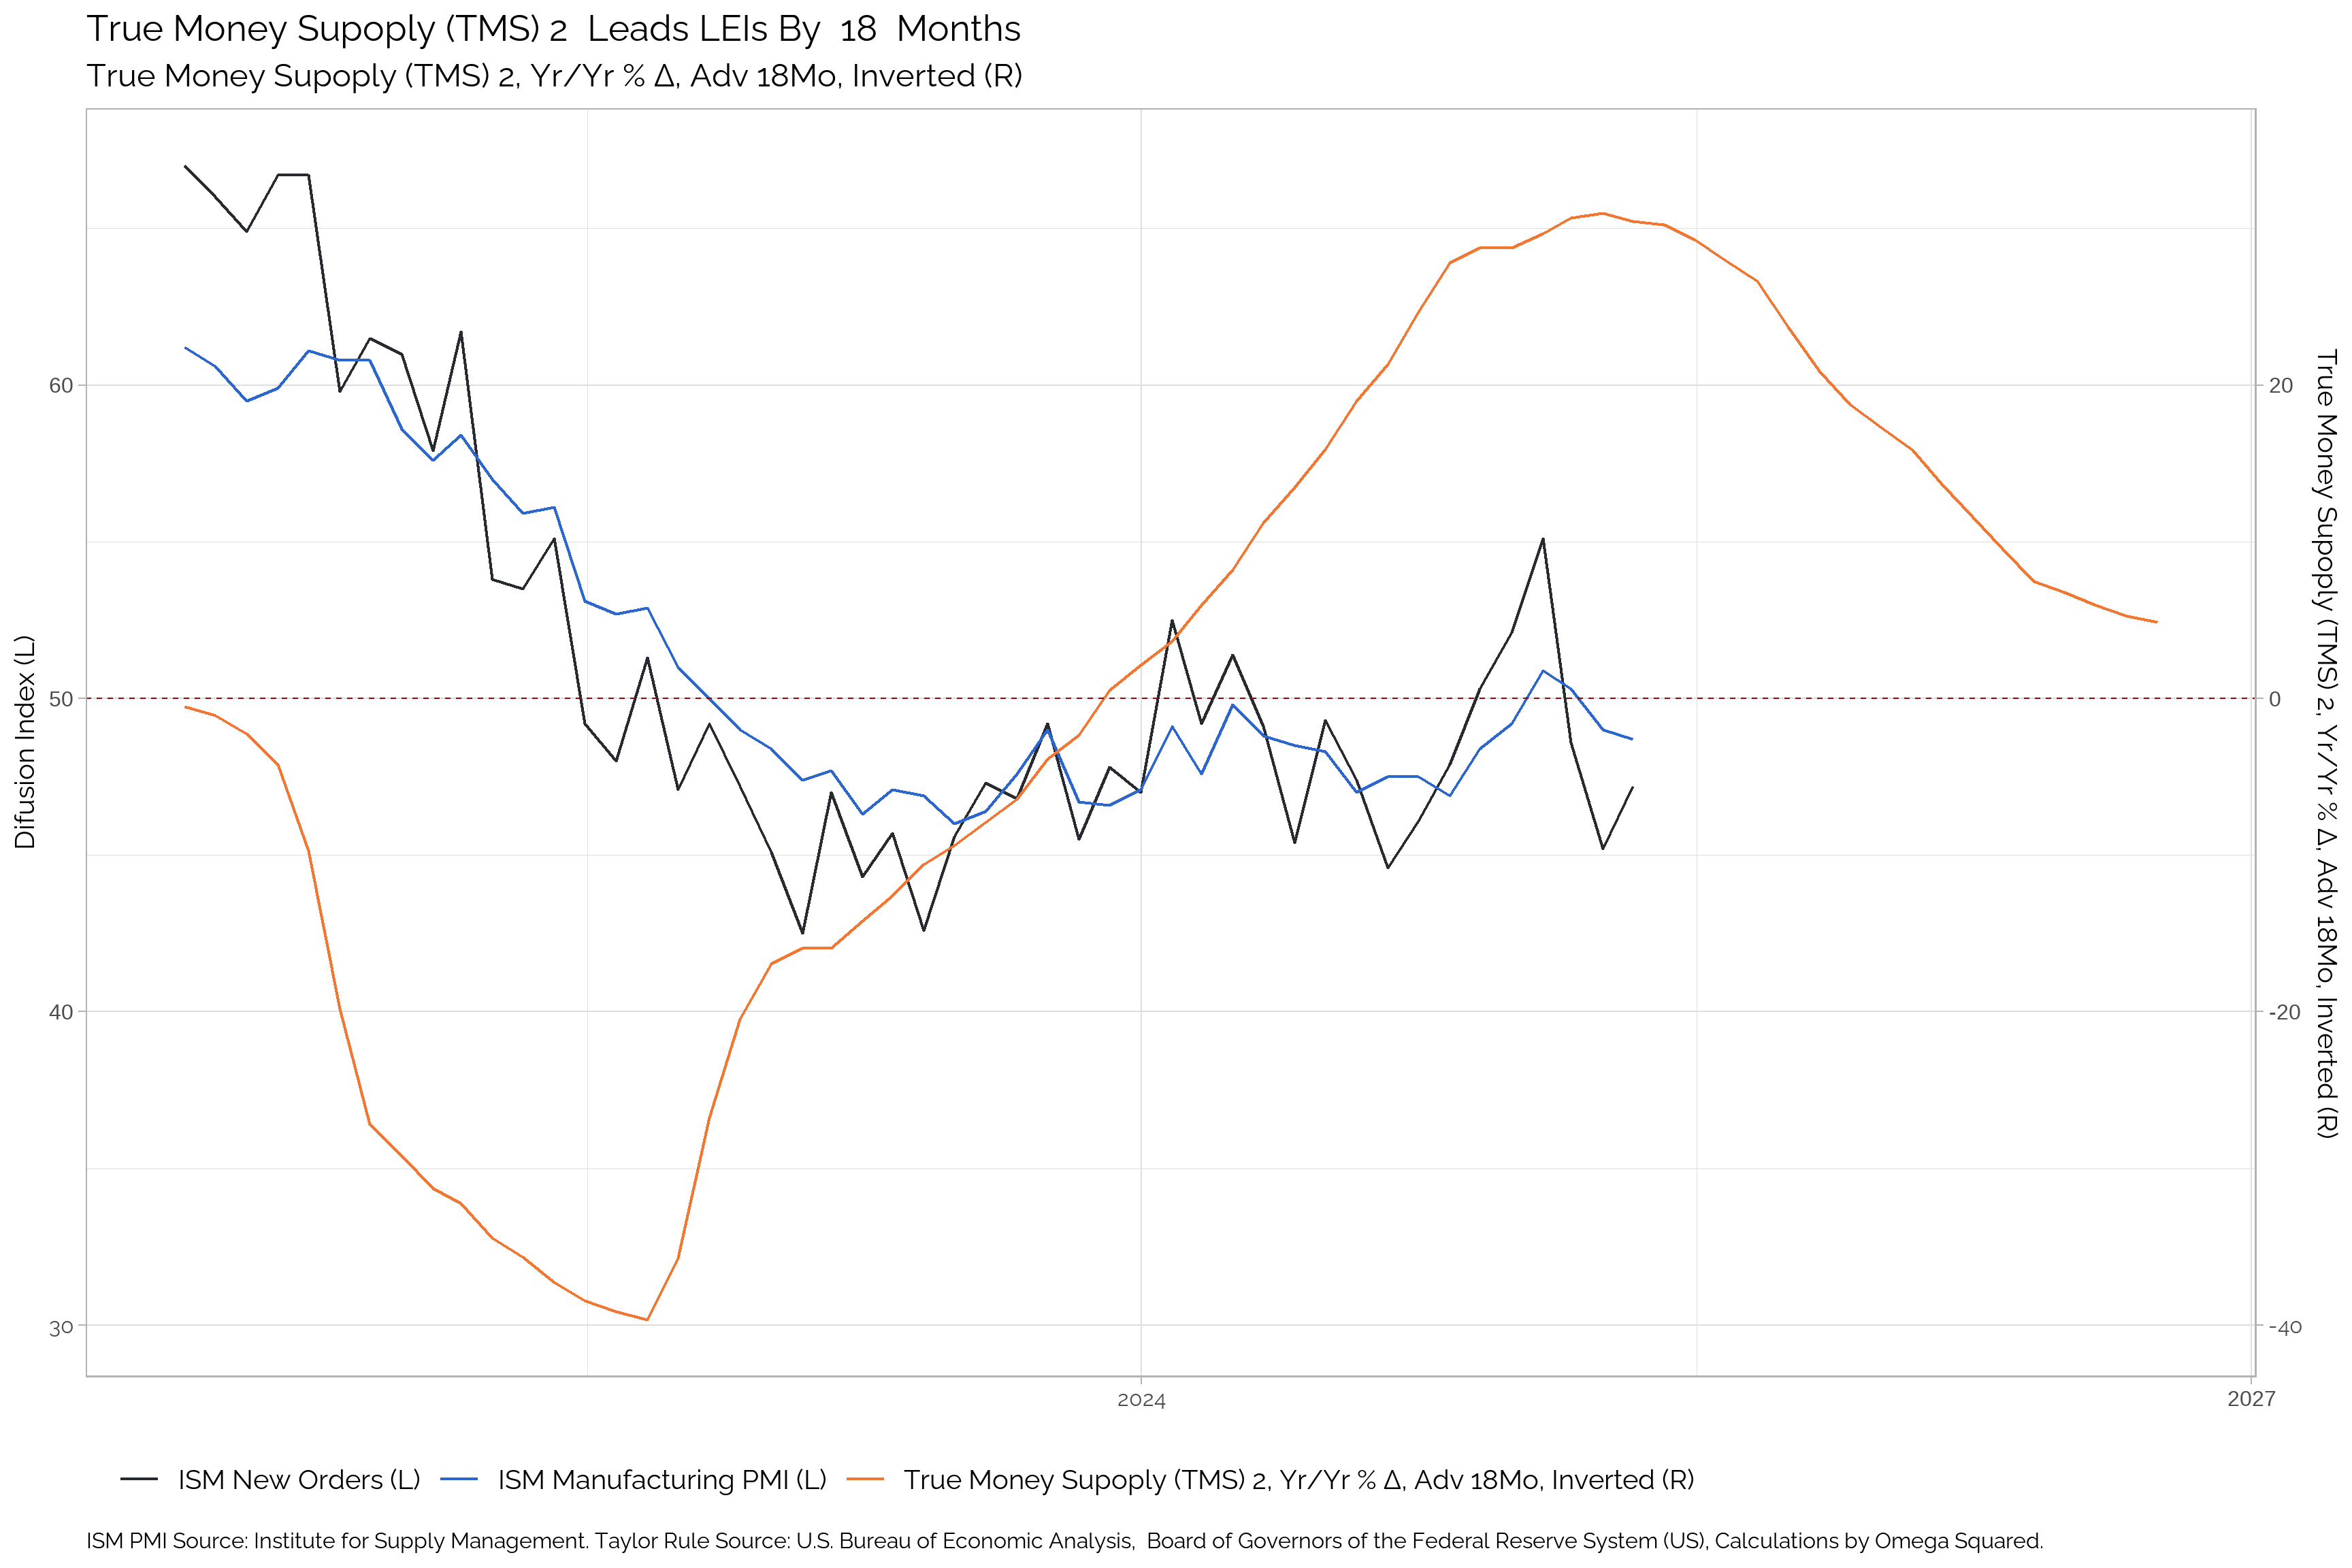
True Money Supply (TMS-2)
TMS-2 is a measure of the money supply that includes all cash, checking accounts, and savings accounts. It is a broader measure of the money supply than M2. TMS stands for “True Money Supply.”
| Apr-25 | Mar-25 | Feb-25 | Jan-25 | Dec-24 | Nov-24 | Oct-24 | Sep-24 | Aug-24 | Jul-24 | Jun-24 | May-24 | |
|---|---|---|---|---|---|---|---|---|---|---|---|---|
| TMS 2 | -- | 358930 | 359780 | 363620 | 366960 | 366450 | 367720 | 367380 | 368610 | 370460 | 371640 | 372630 |
| Δ in TMS 2 | -- | -850 | -3840 | -3340 | 510 | -1270 | 340 | -1230 | -1850 | -1180 | -990 | -1030 |
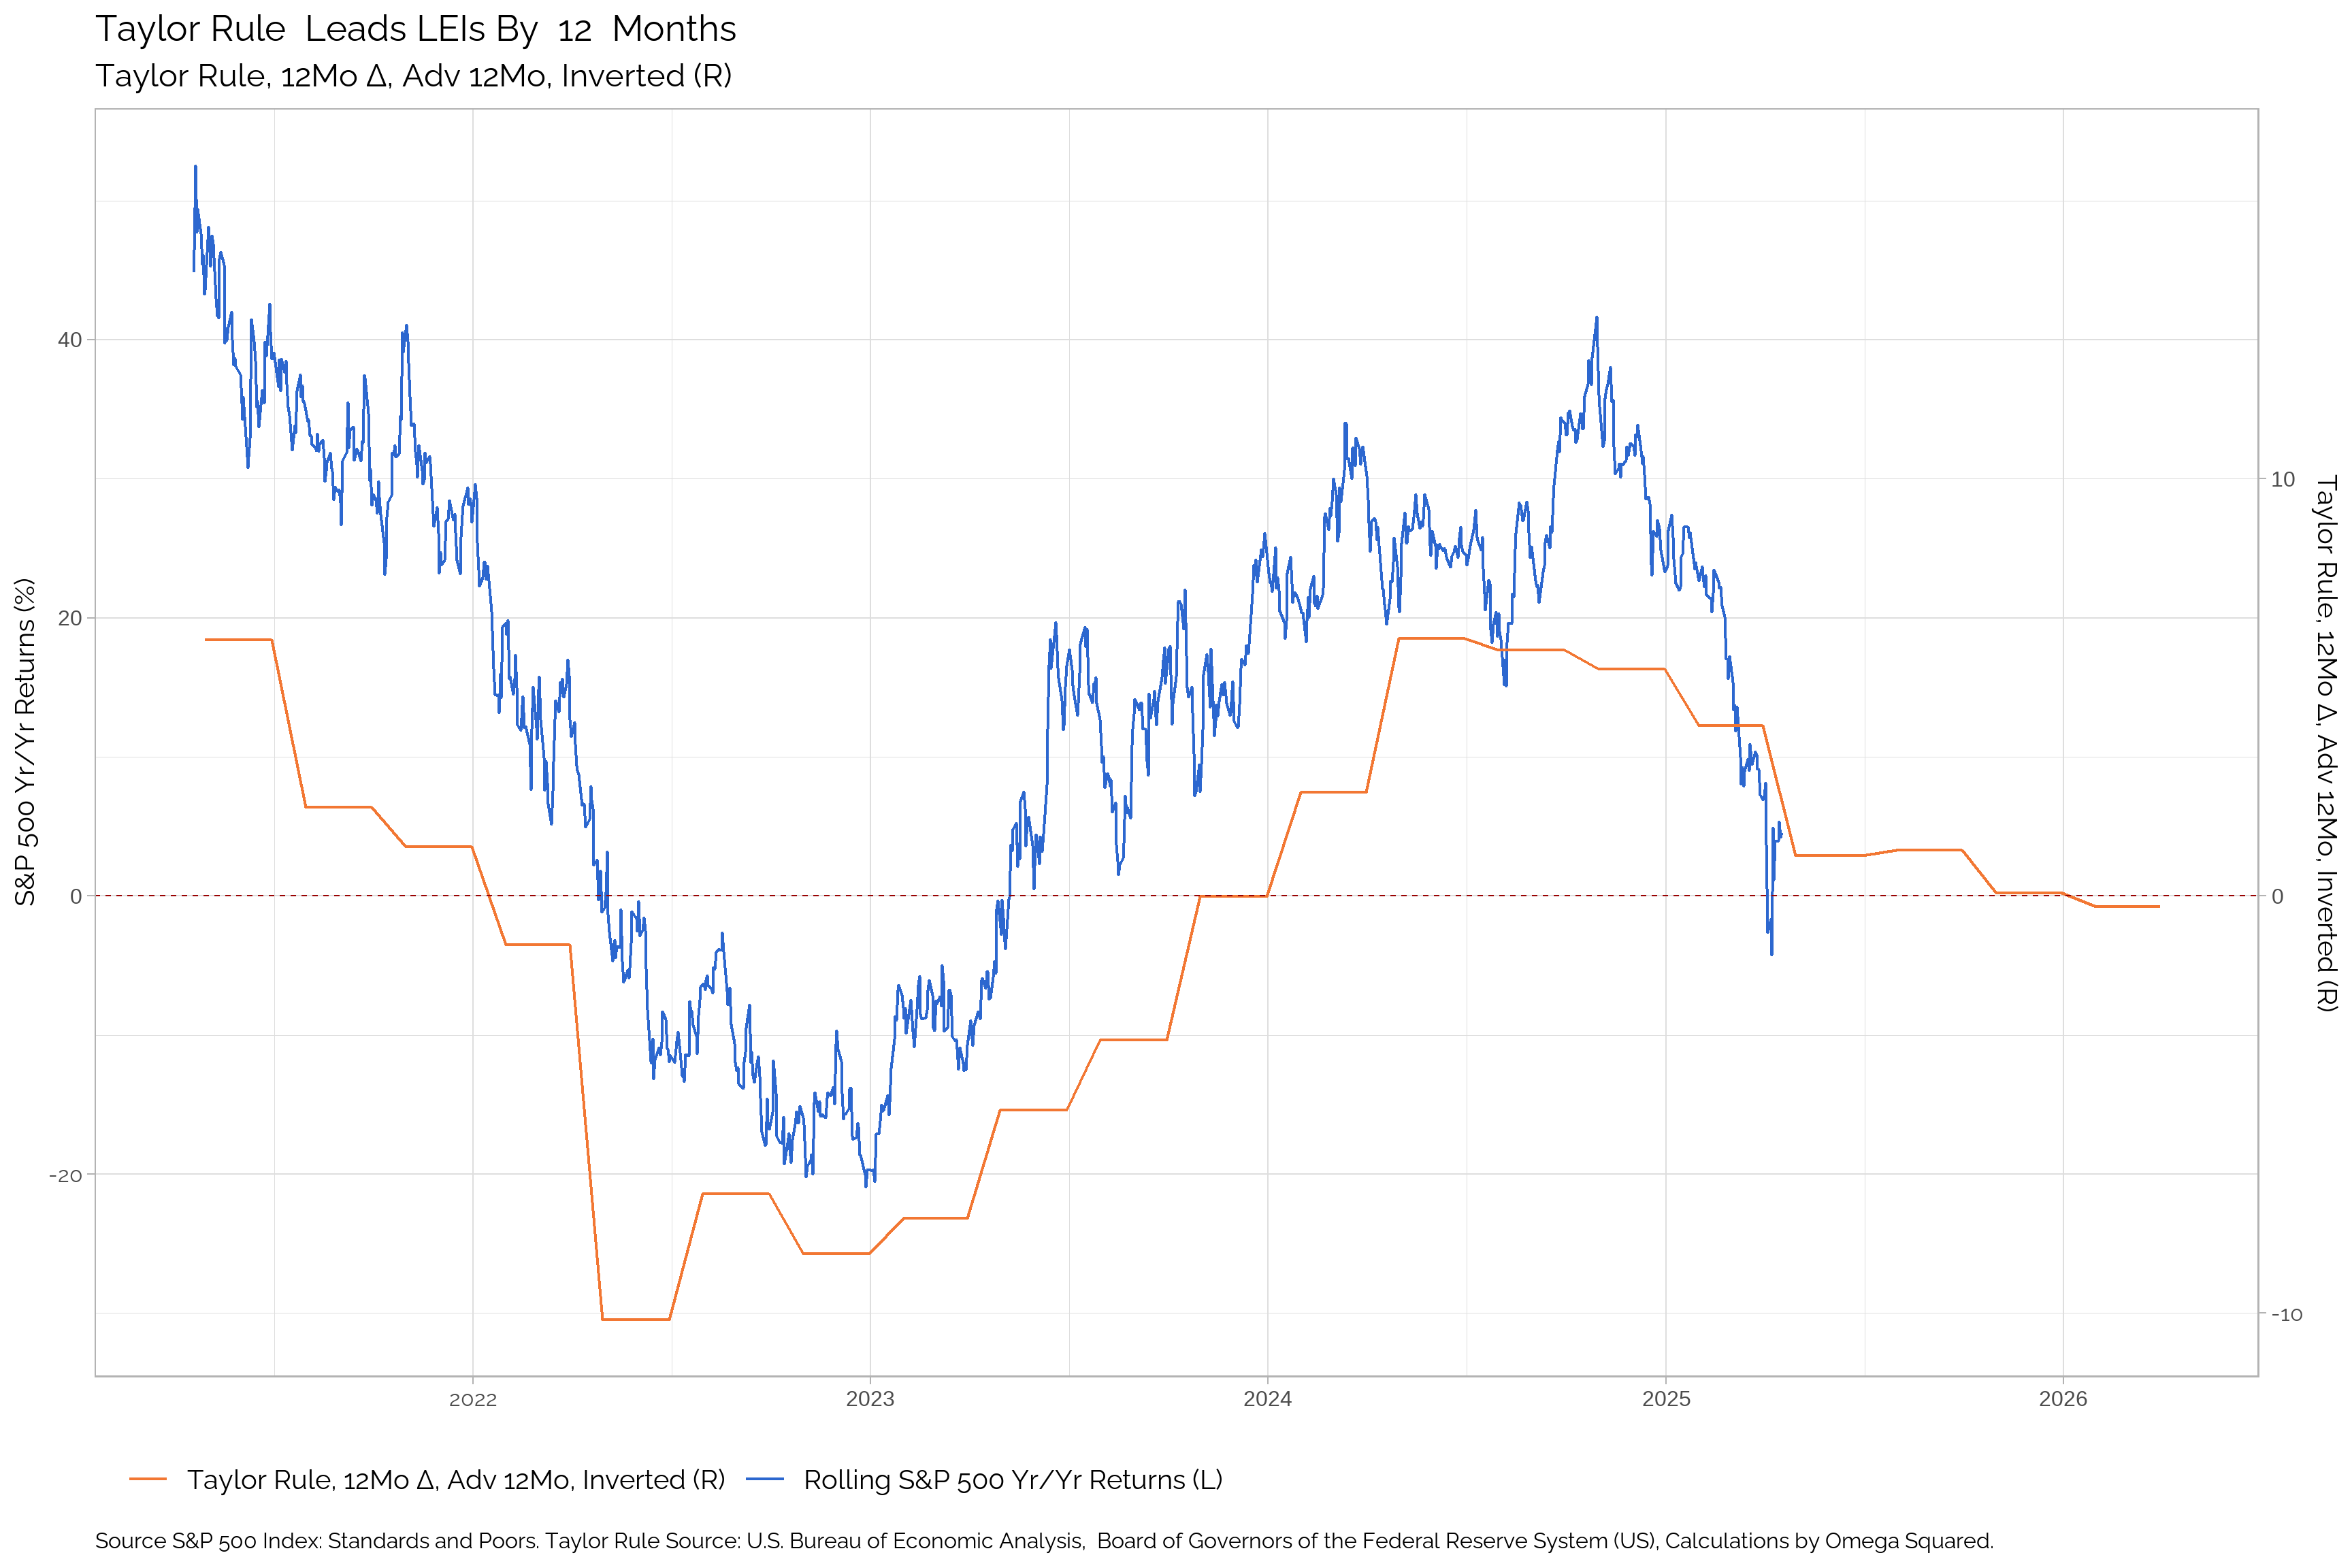
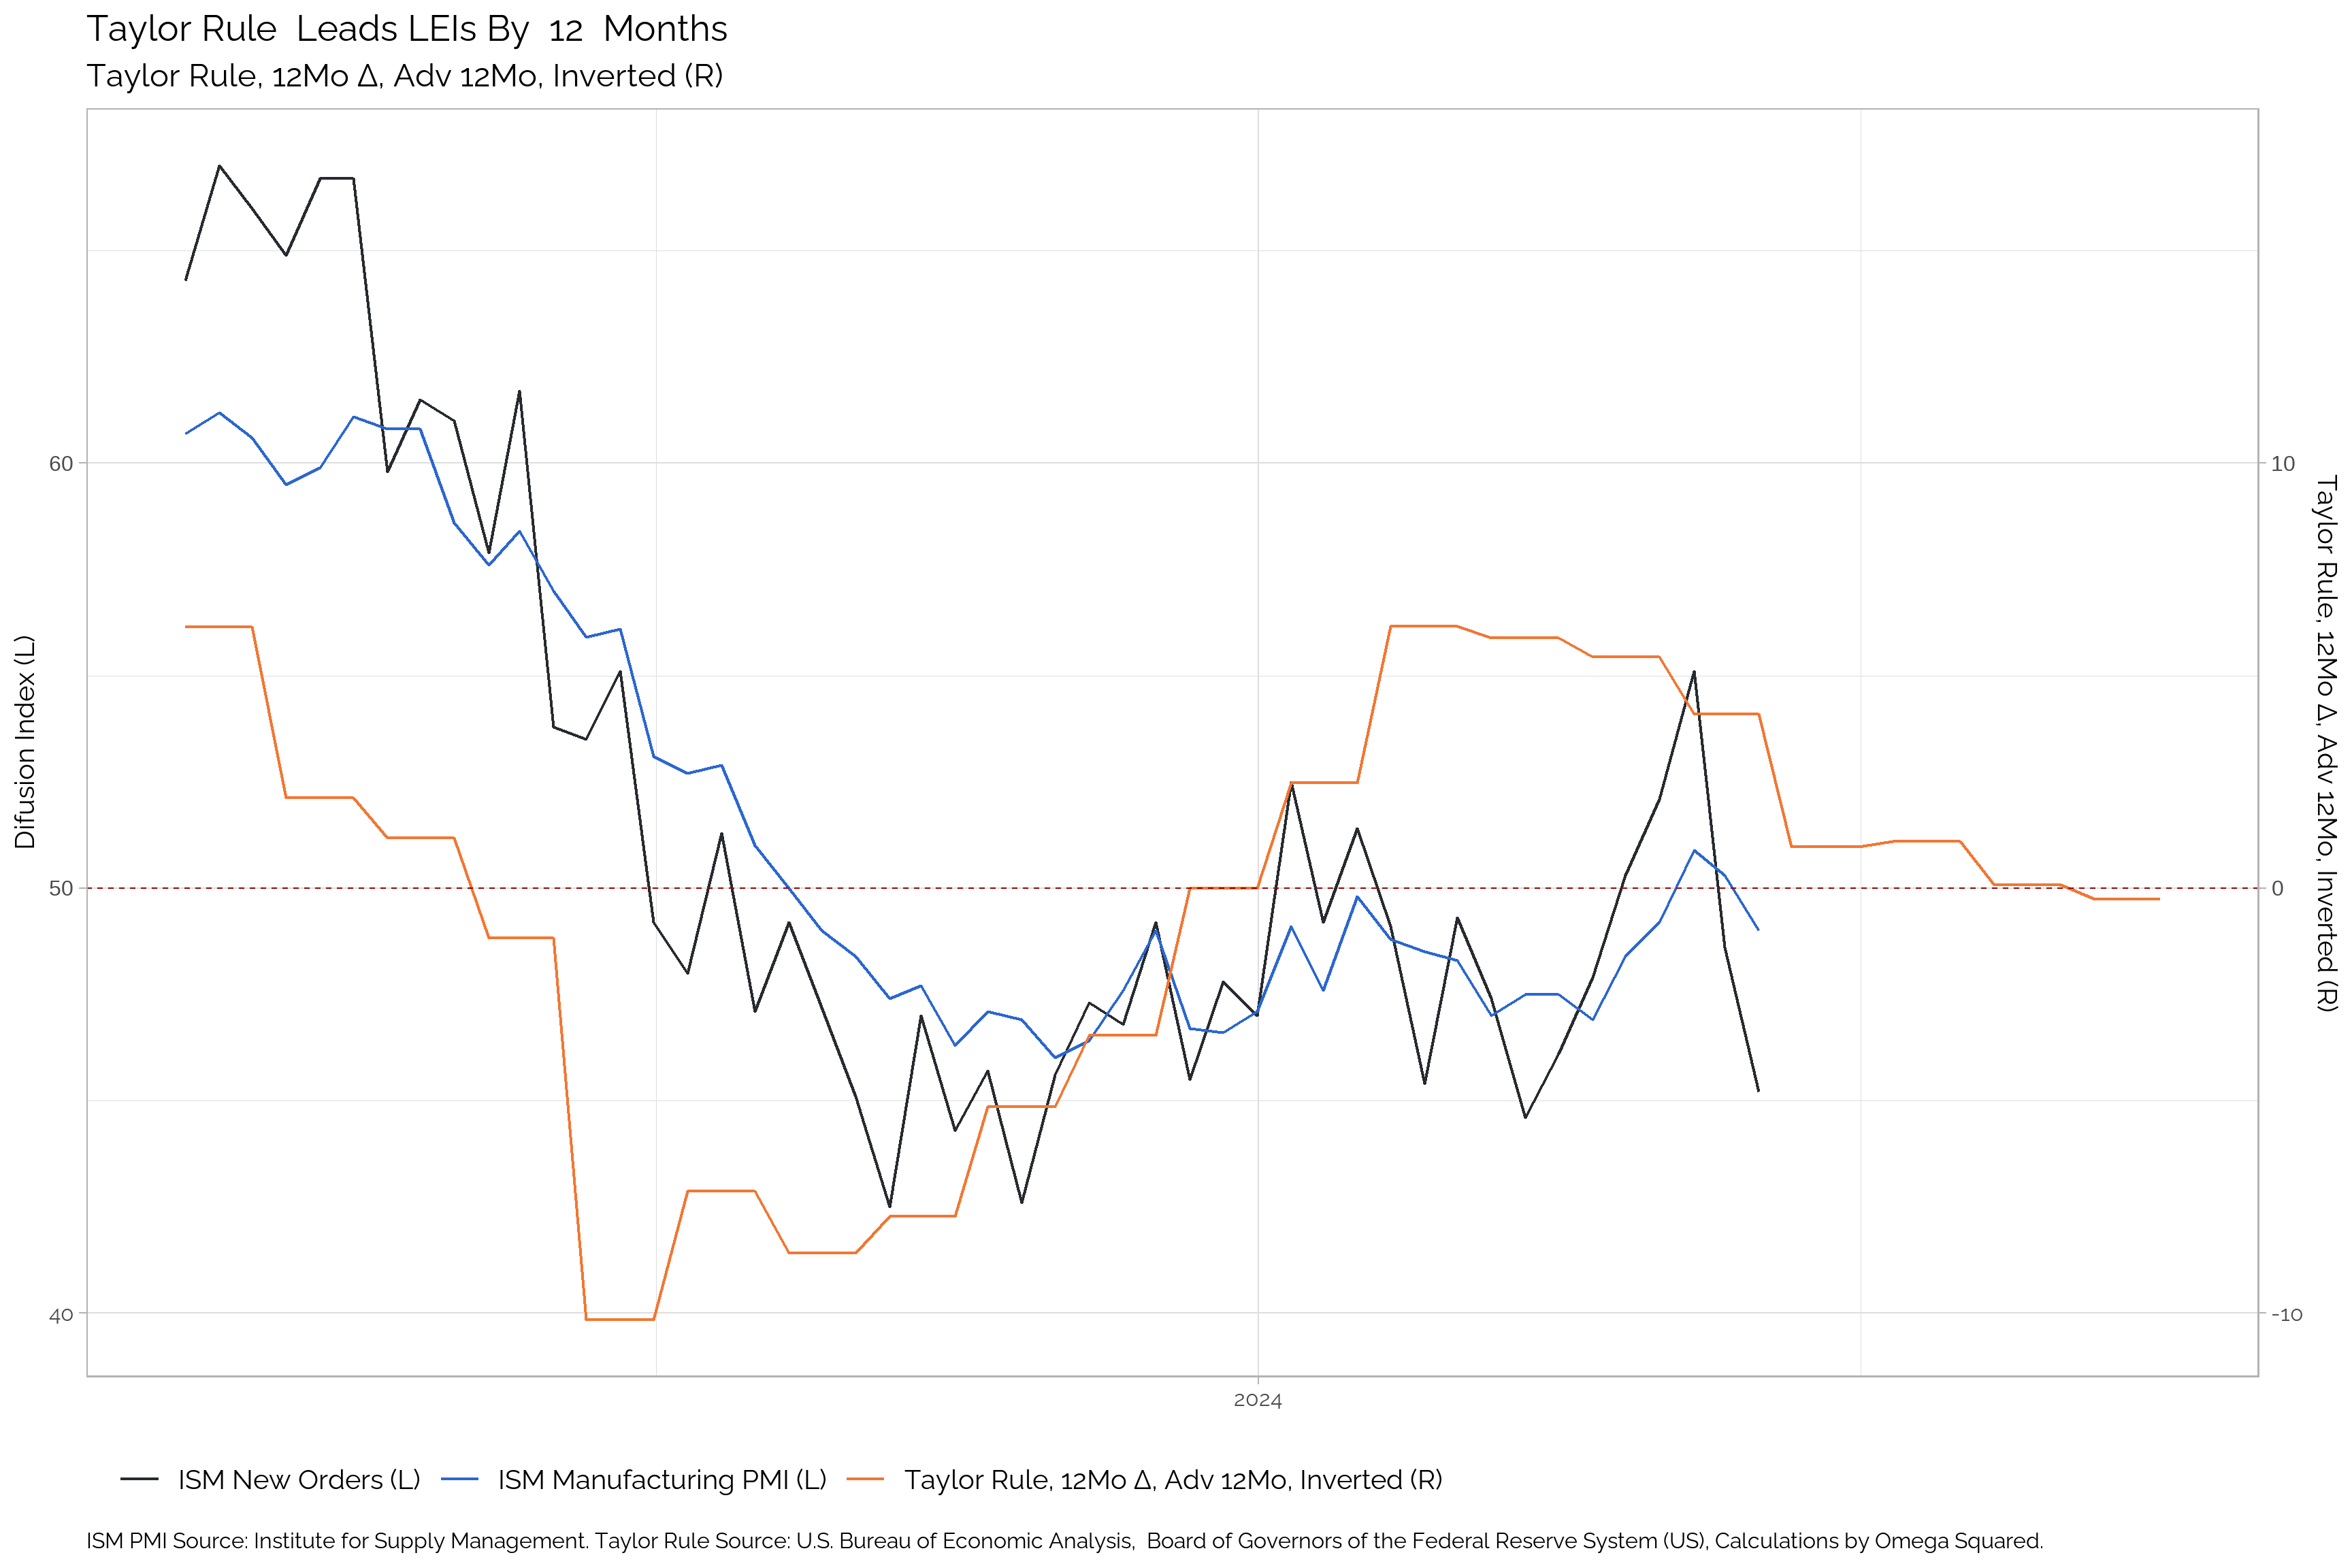
Taylor Rule
The Taylor Rule approximates the Fed’s policy reaction function. While the Taylor Rule has lost credibility in the financial industry, it remains a helpful tool for forecasting LEIs.
| Apr-25 | Mar-25 | Feb-25 | Jan-25 | Dec-24 | Nov-24 | Oct-24 | Sep-24 | Aug-24 | Jul-24 | Jun-24 | May-24 | |
|---|---|---|---|---|---|---|---|---|---|---|---|---|
| Taylor Rule | 5.6 | 5.6 | 5.6 | 5.6 | 5.6 | 5.6 | 5.29 | 5.29 | 5.29 | 5.68 | 5.68 | 5.68 |
| Δ in Taylor Rule | 0 | 0 | 0 | 0 | 0 | 0.31 | 0 | 0 | -0.4 | 0 | 0 | 0.34 |
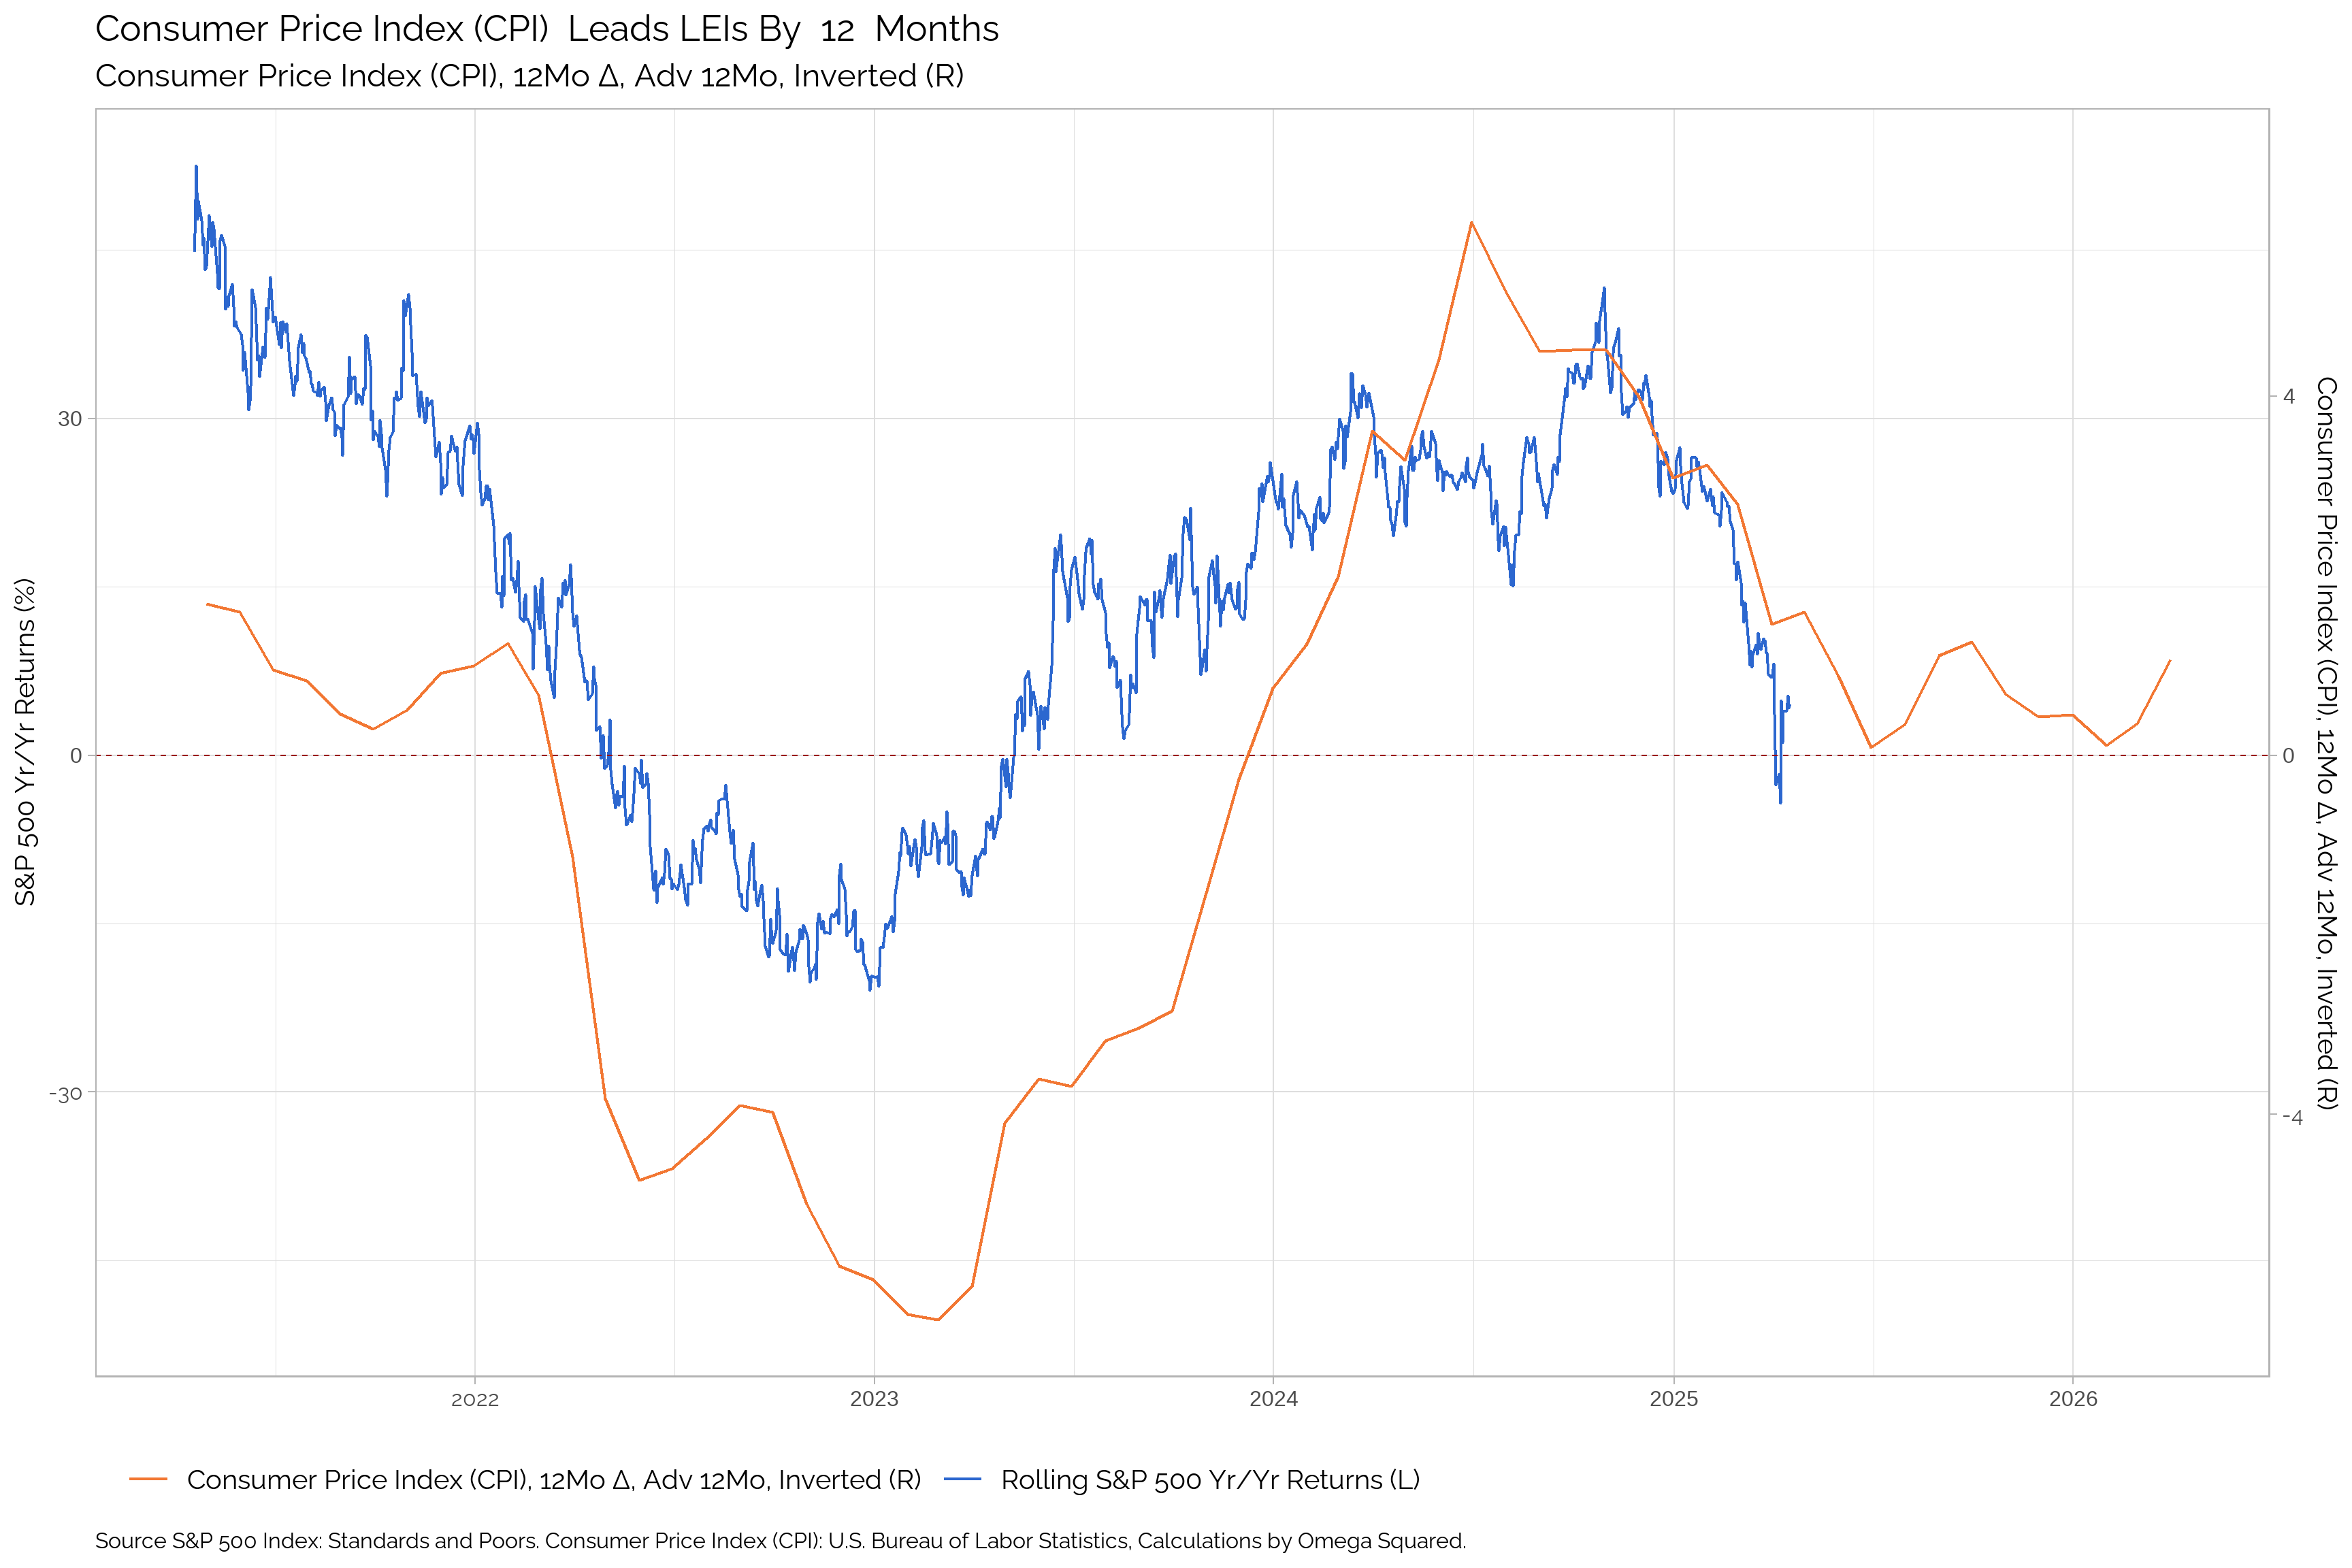
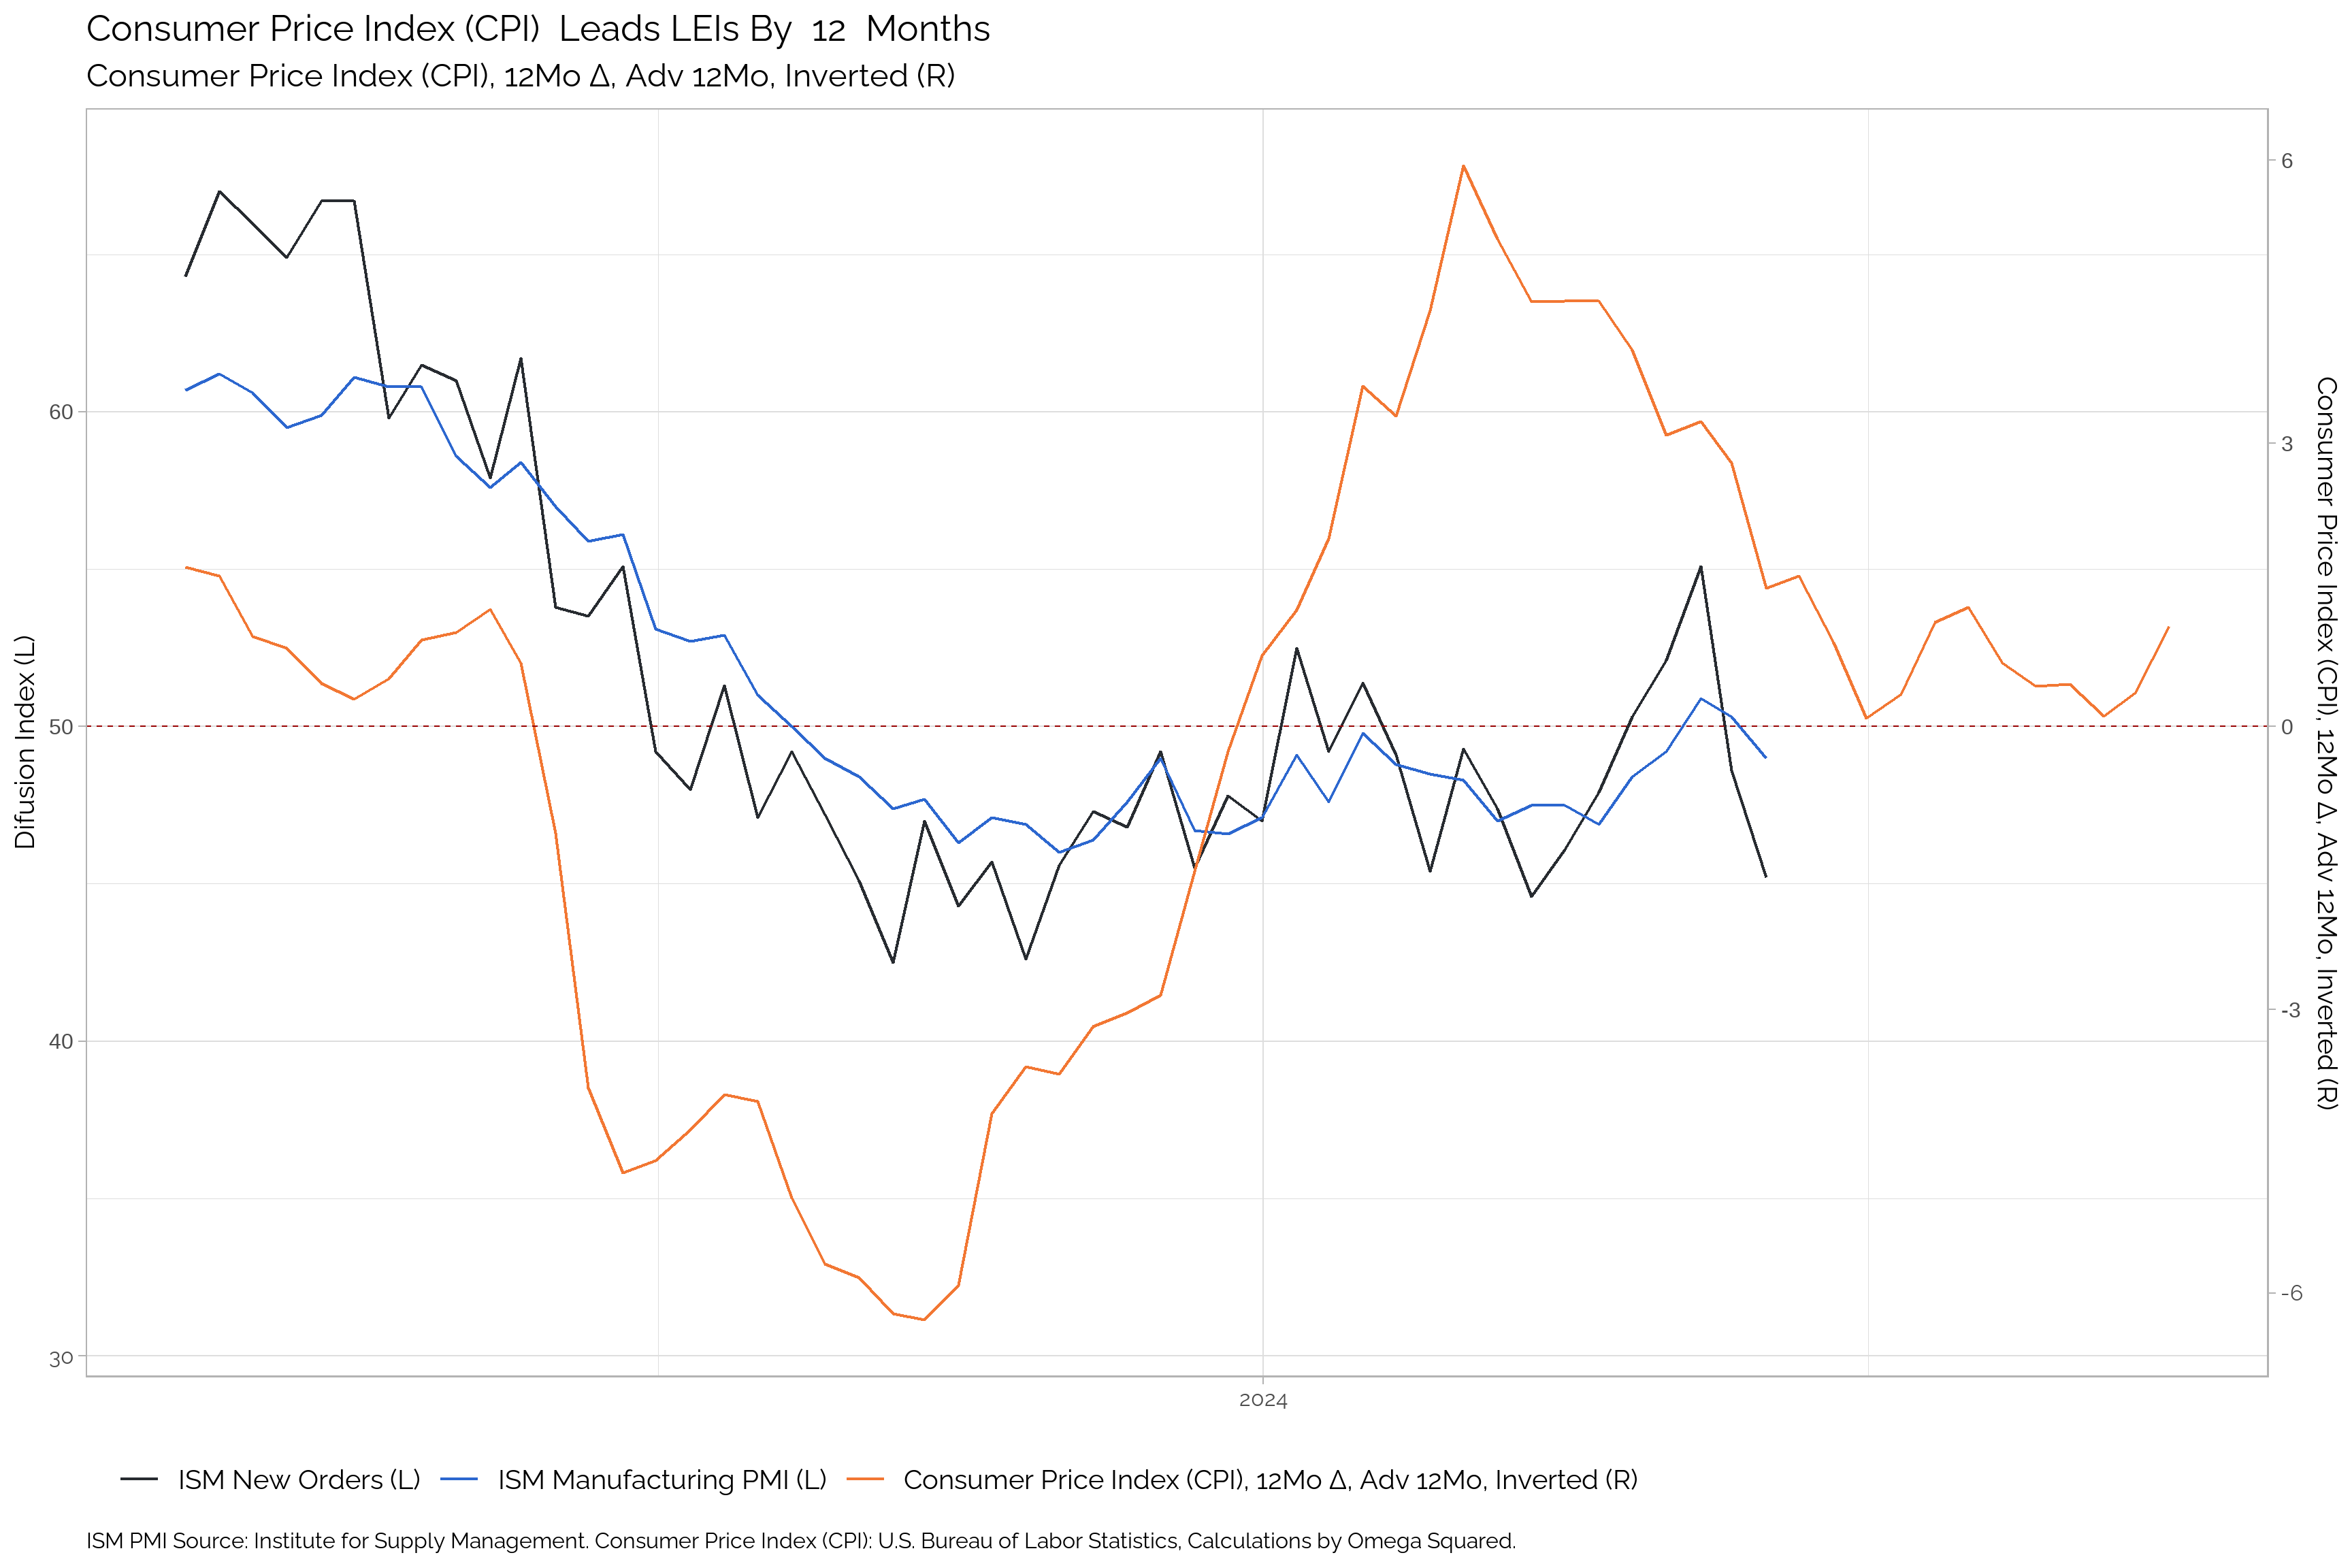
Headline Inflation
| Apr-25 | Mar-25 | Feb-25 | Jan-25 | Dec-24 | Nov-24 | Oct-24 | Sep-24 | Aug-24 | Jul-24 | Jun-24 | May-24 | |
|---|---|---|---|---|---|---|---|---|---|---|---|---|
| Headline CPI | 2.41 | 2.81 | 3 | 2.87 | 2.71 | 2.57 | 2.43 | 2.61 | 2.94 | 2.97 | 3.24 | 3.35 |
| Δ in Headline CPI | -0.41 | -0.19 | 0.13 | 0.16 | 0.14 | 0.14 | -0.18 | -0.33 | -0.03 | -0.27 | -0.12 | -0.11 |
Core Inflation
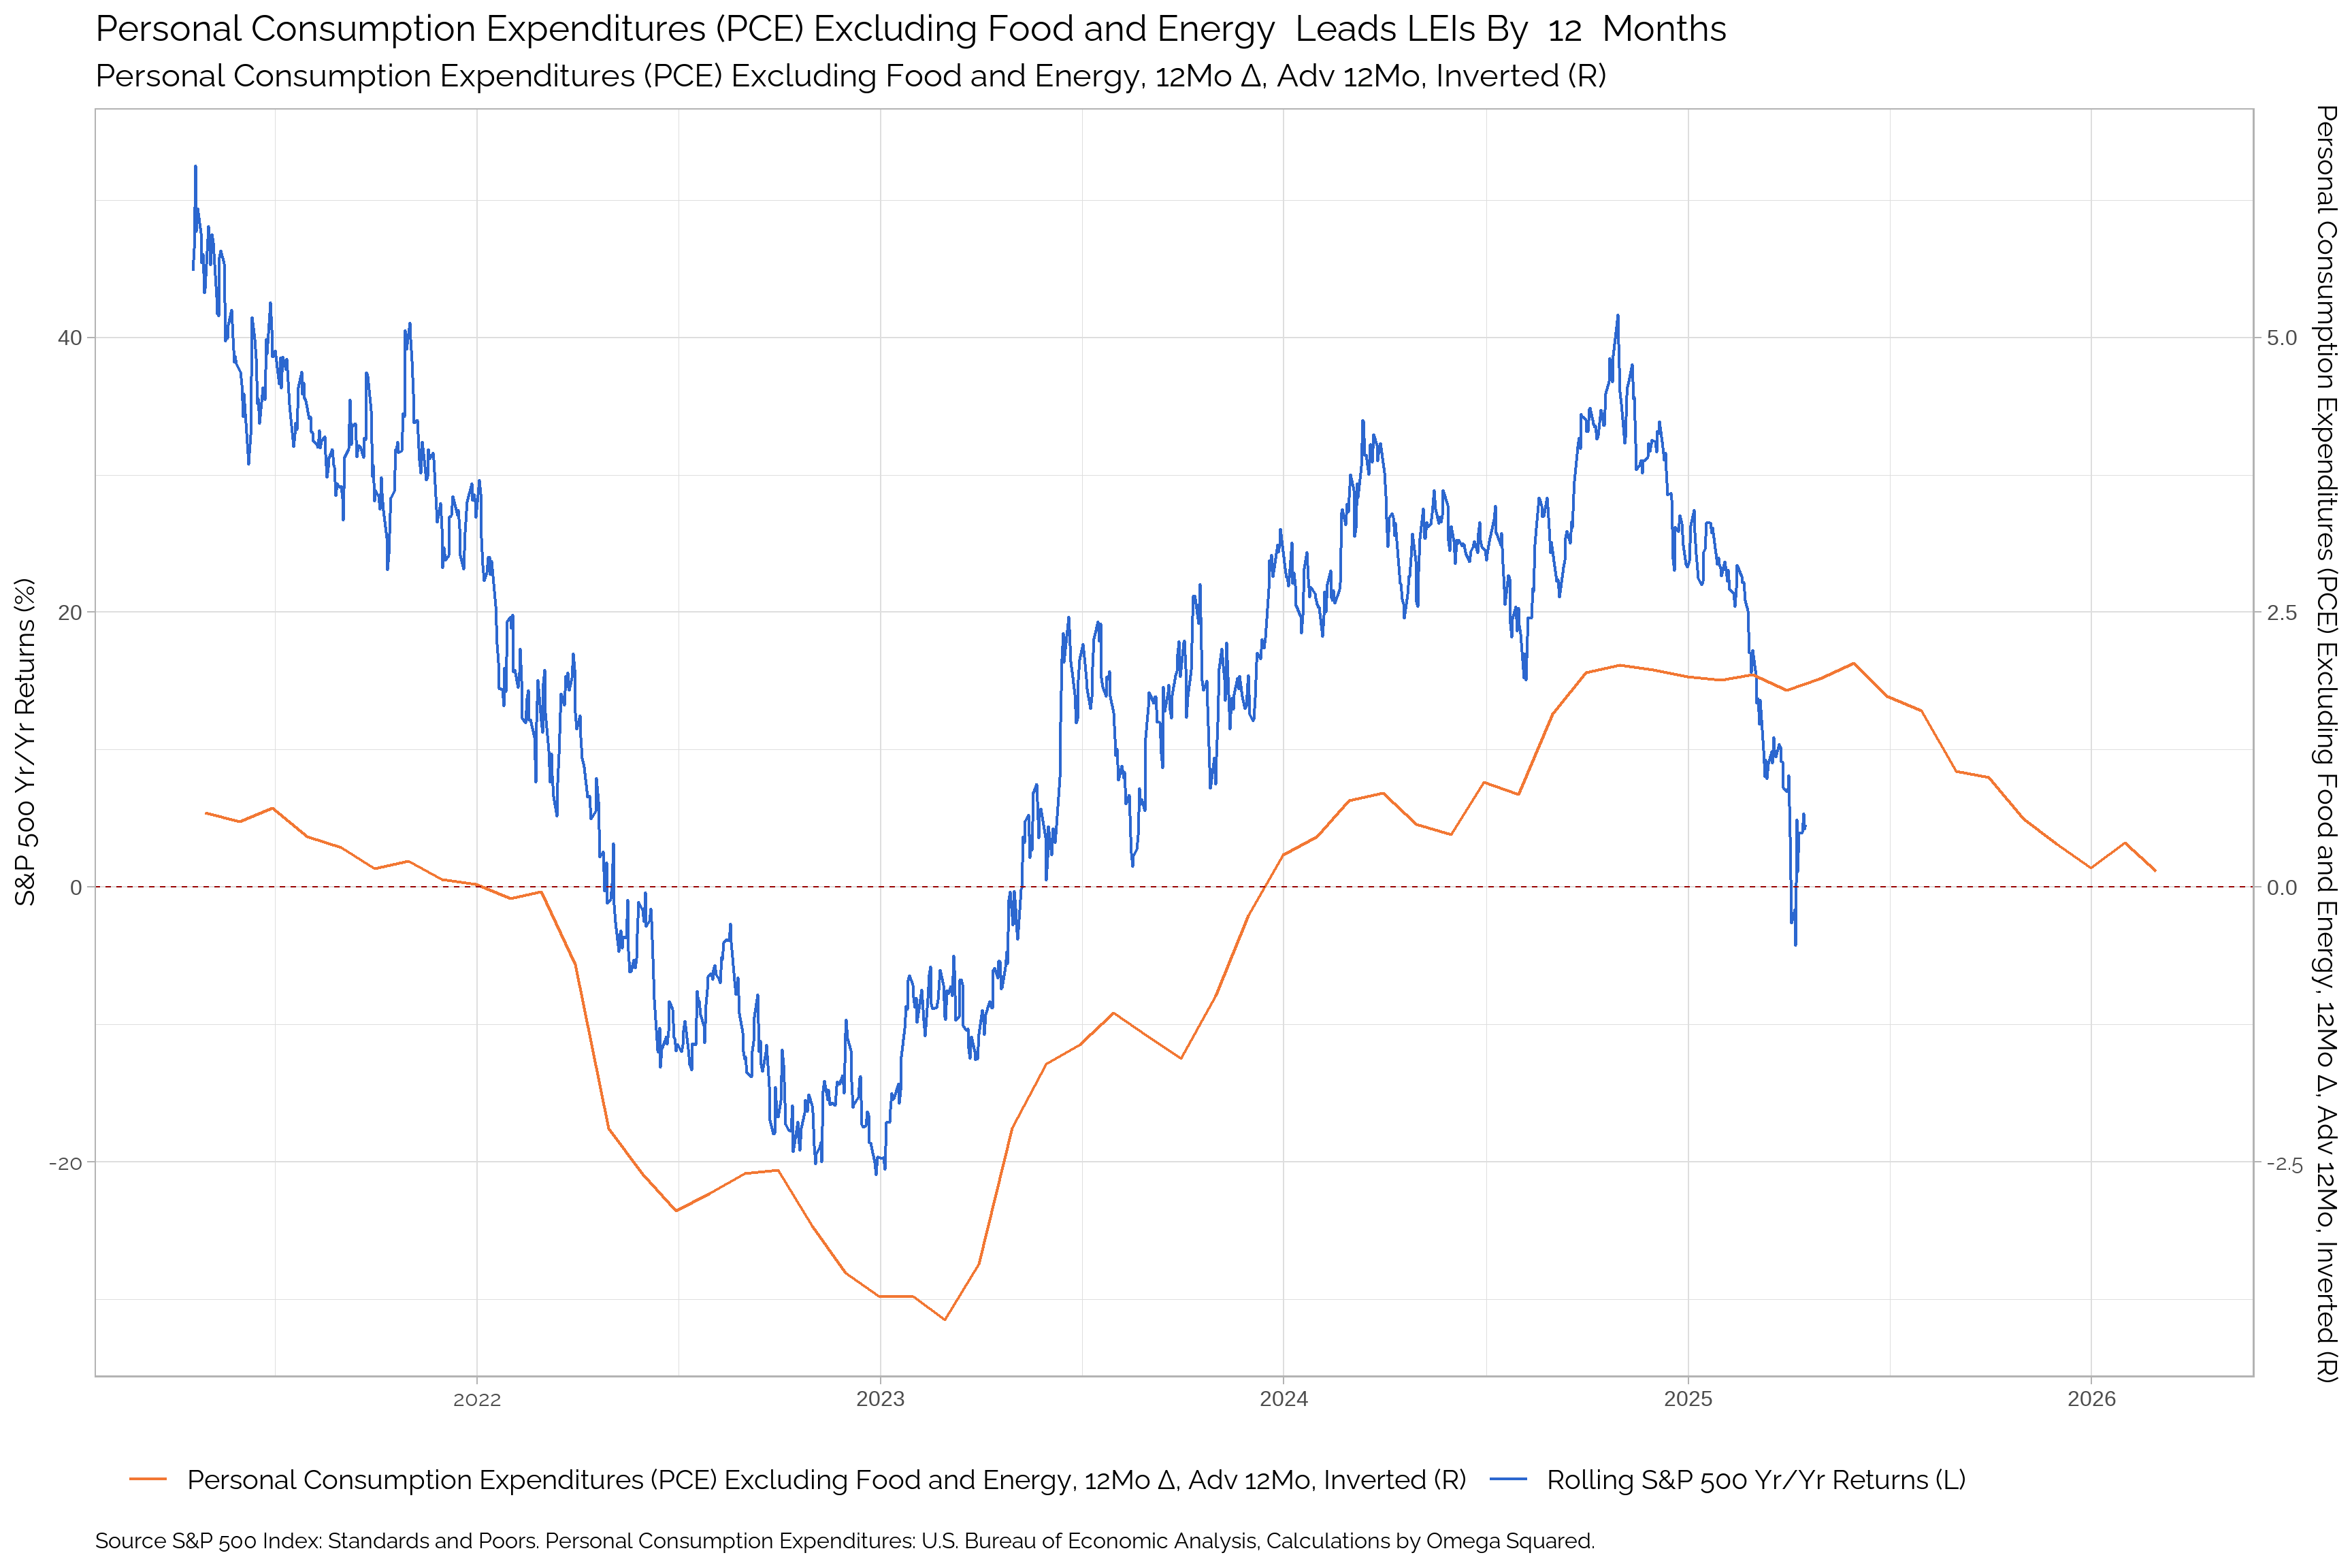
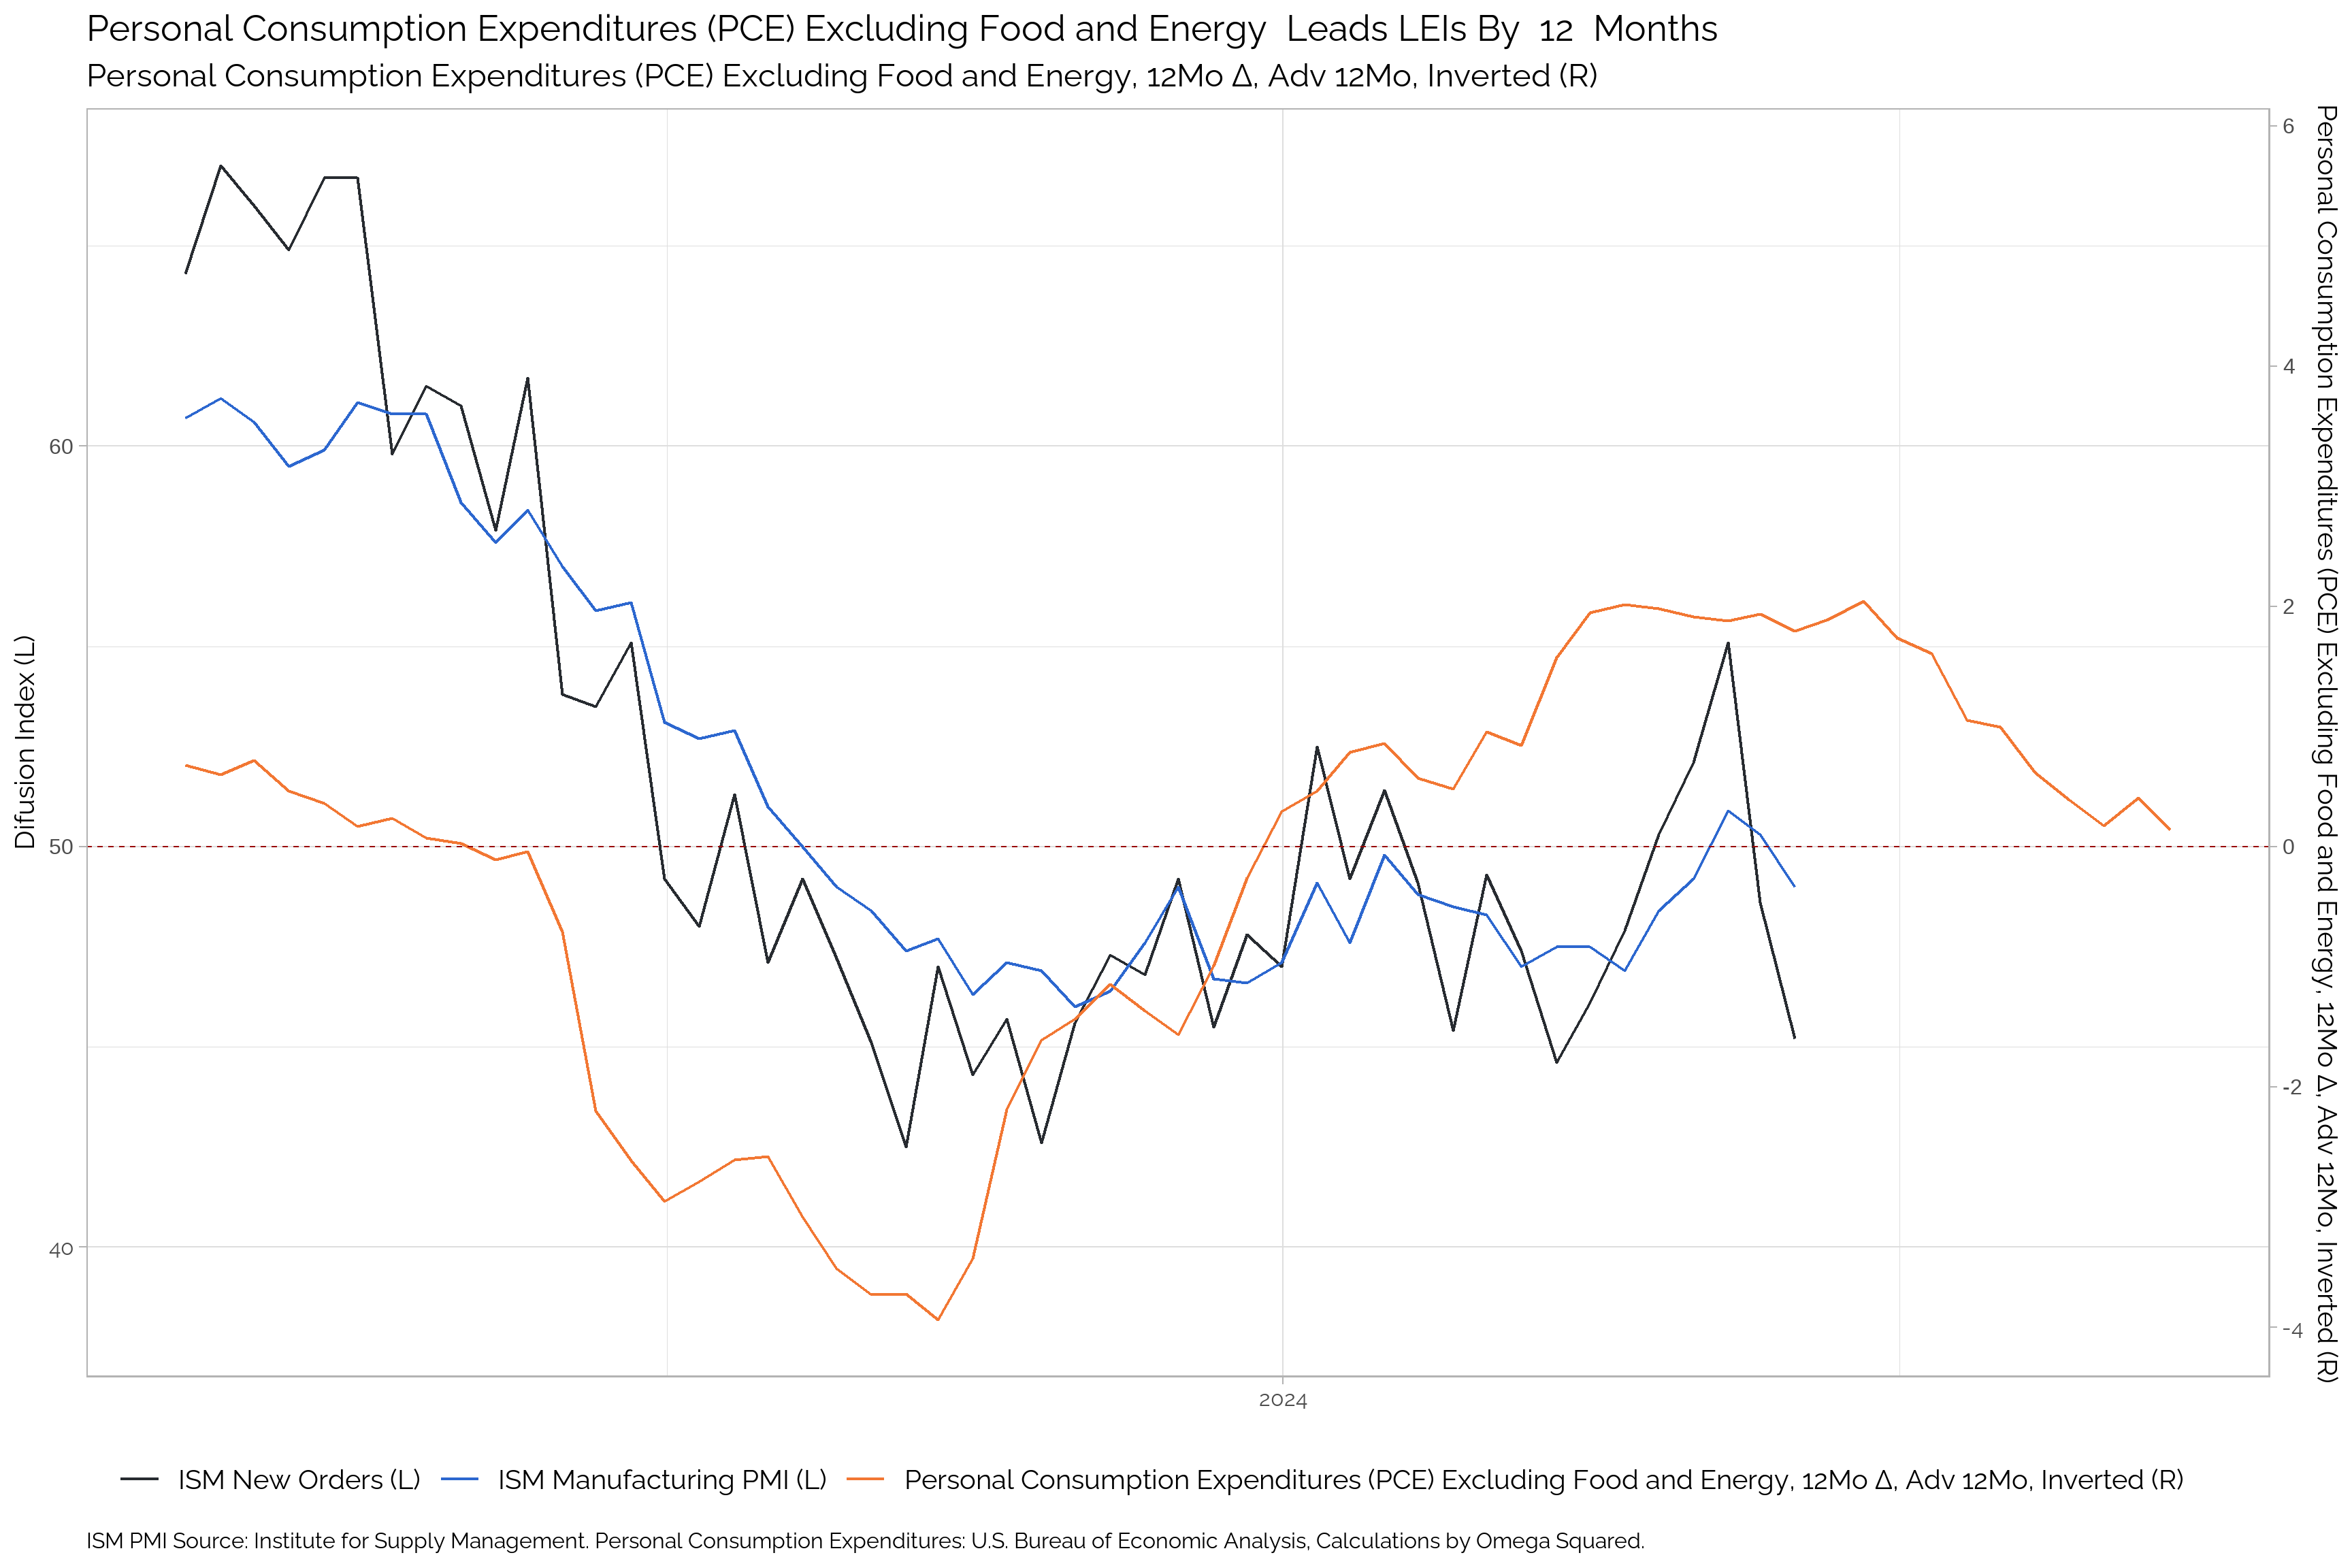
| Apr-25 | Mar-25 | Feb-25 | Jan-25 | Dec-24 | Nov-24 | Oct-24 | Sep-24 | Aug-24 | Jul-24 | Jun-24 | May-24 | |
|---|---|---|---|---|---|---|---|---|---|---|---|---|
| Core PCE | -- | 2.79 | 2.66 | 2.86 | 2.83 | 2.82 | 2.66 | 2.73 | 2.67 | 2.63 | 2.67 | 2.89 |
| Δ in Core PCE | -- | 0.13 | -0.2 | 0.03 | 0.01 | 0.16 | -0.07 | 0.07 | 0.03 | -0.04 | -0.22 | -0.09 |
Producer Price Index (PPI)
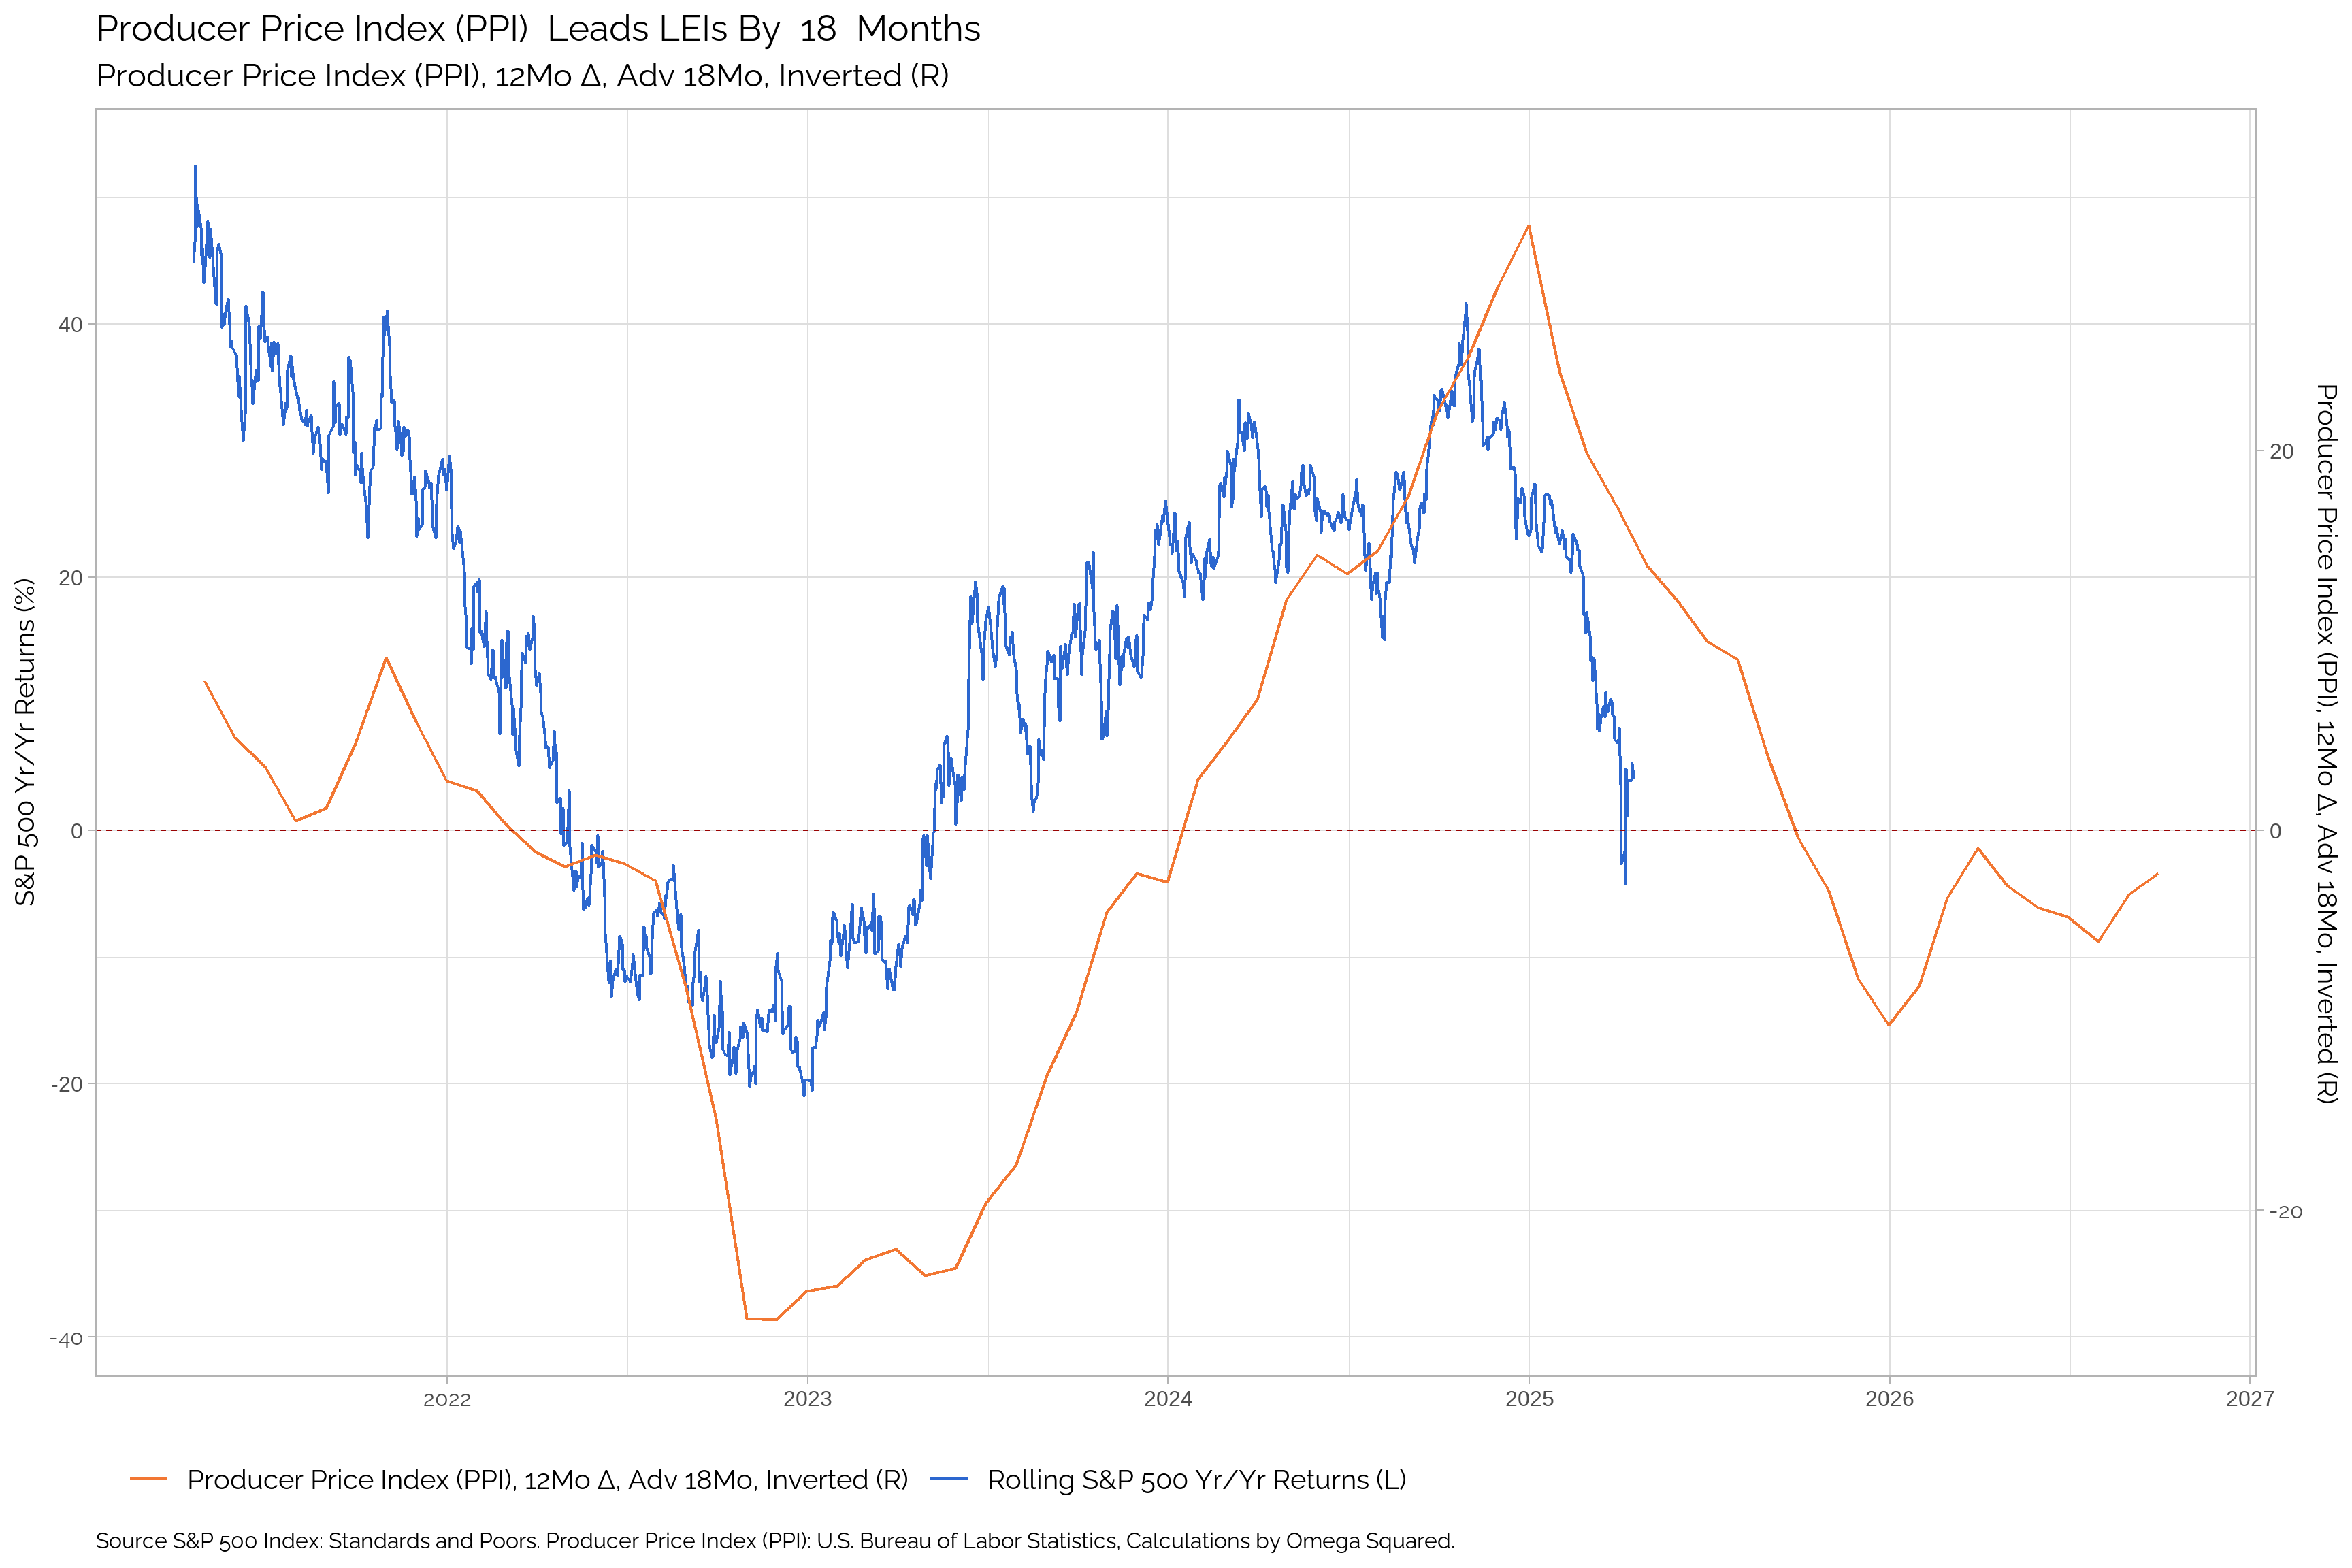
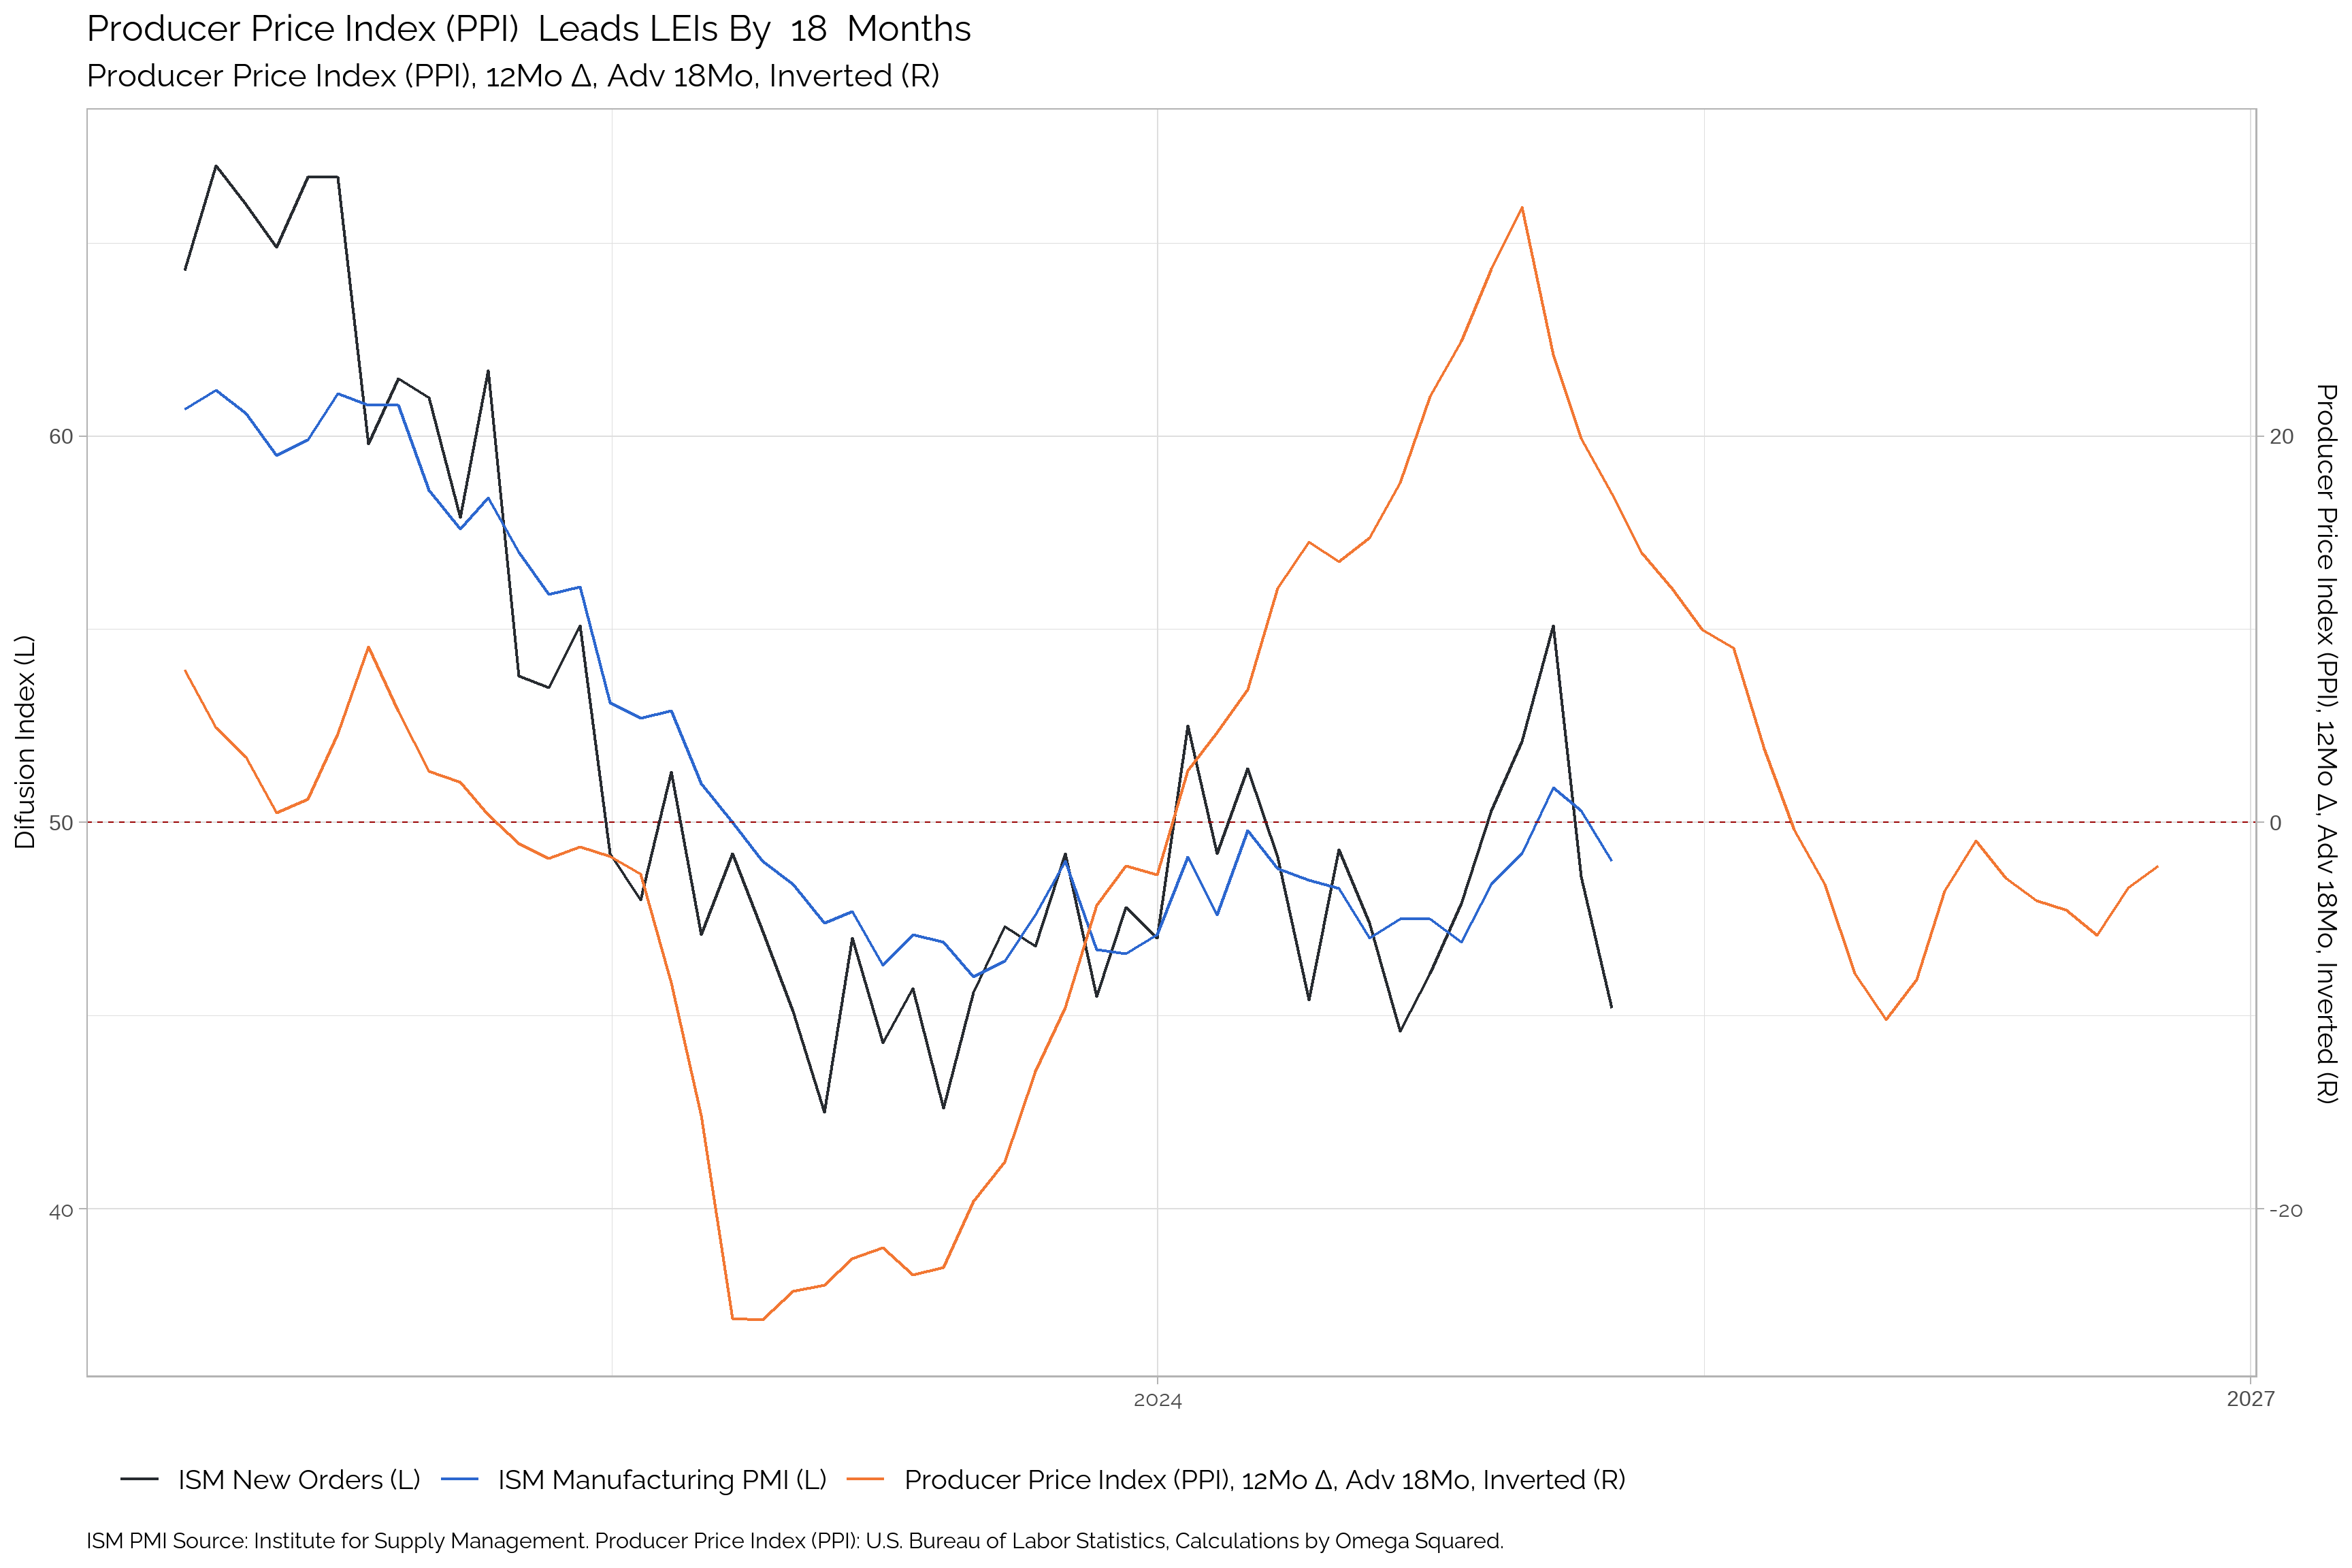
| Apr-25 | Mar-25 | Feb-25 | Jan-25 | Dec-24 | Nov-24 | Oct-24 | Sep-24 | Aug-24 | Jul-24 | Jun-24 | May-24 | |
|---|---|---|---|---|---|---|---|---|---|---|---|---|
| Producer Price Index (PPI) | 1.47 | 1.91 | 2.42 | 1.43 | 0.14 | -0.83 | -2.41 | -0.86 | 1.37 | 0.81 | 0.65 | 0.03 |
| Δ in Producer Price Index (PPI) | -0.45 | -0.51 | 0.99 | 1.29 | 0.97 | 1.59 | -1.55 | -2.23 | 0.56 | 0.16 | 0.62 | 0.79 |
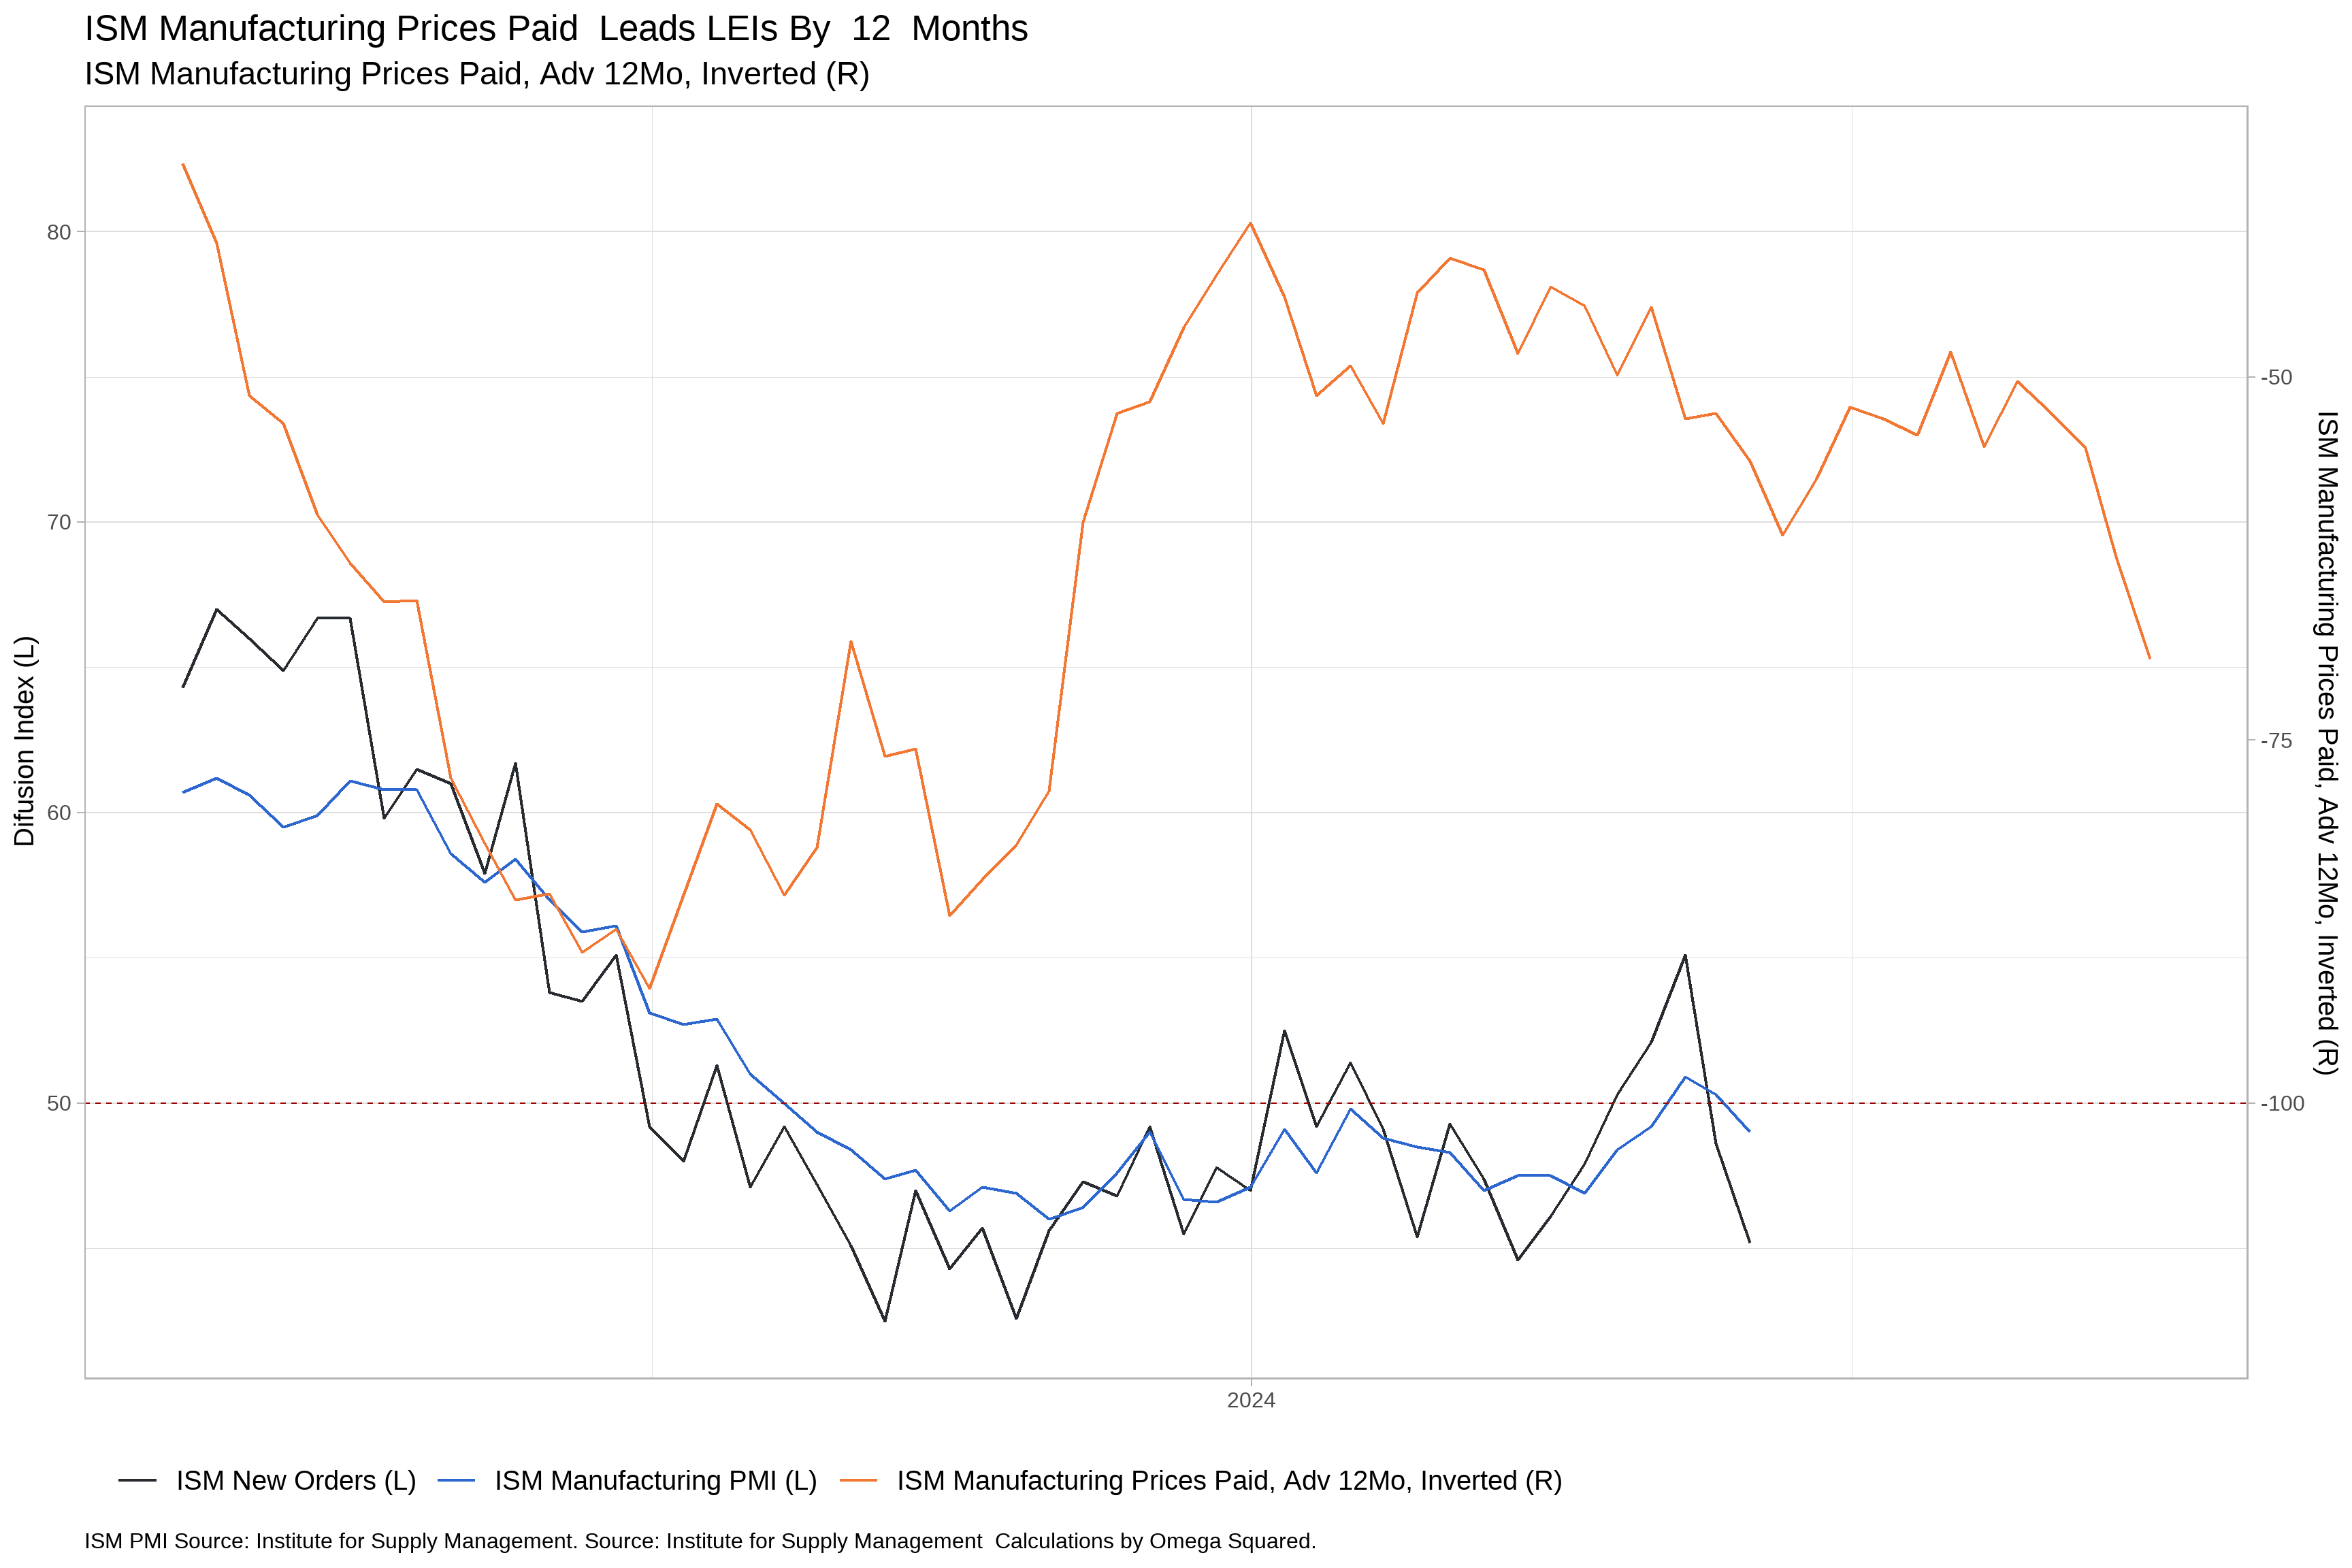
ISM Prices Paid
The ISM Prices Paid Index is a measure of the prices paid by manufacturers for raw materials and components. It is a leading indicator of inflation.
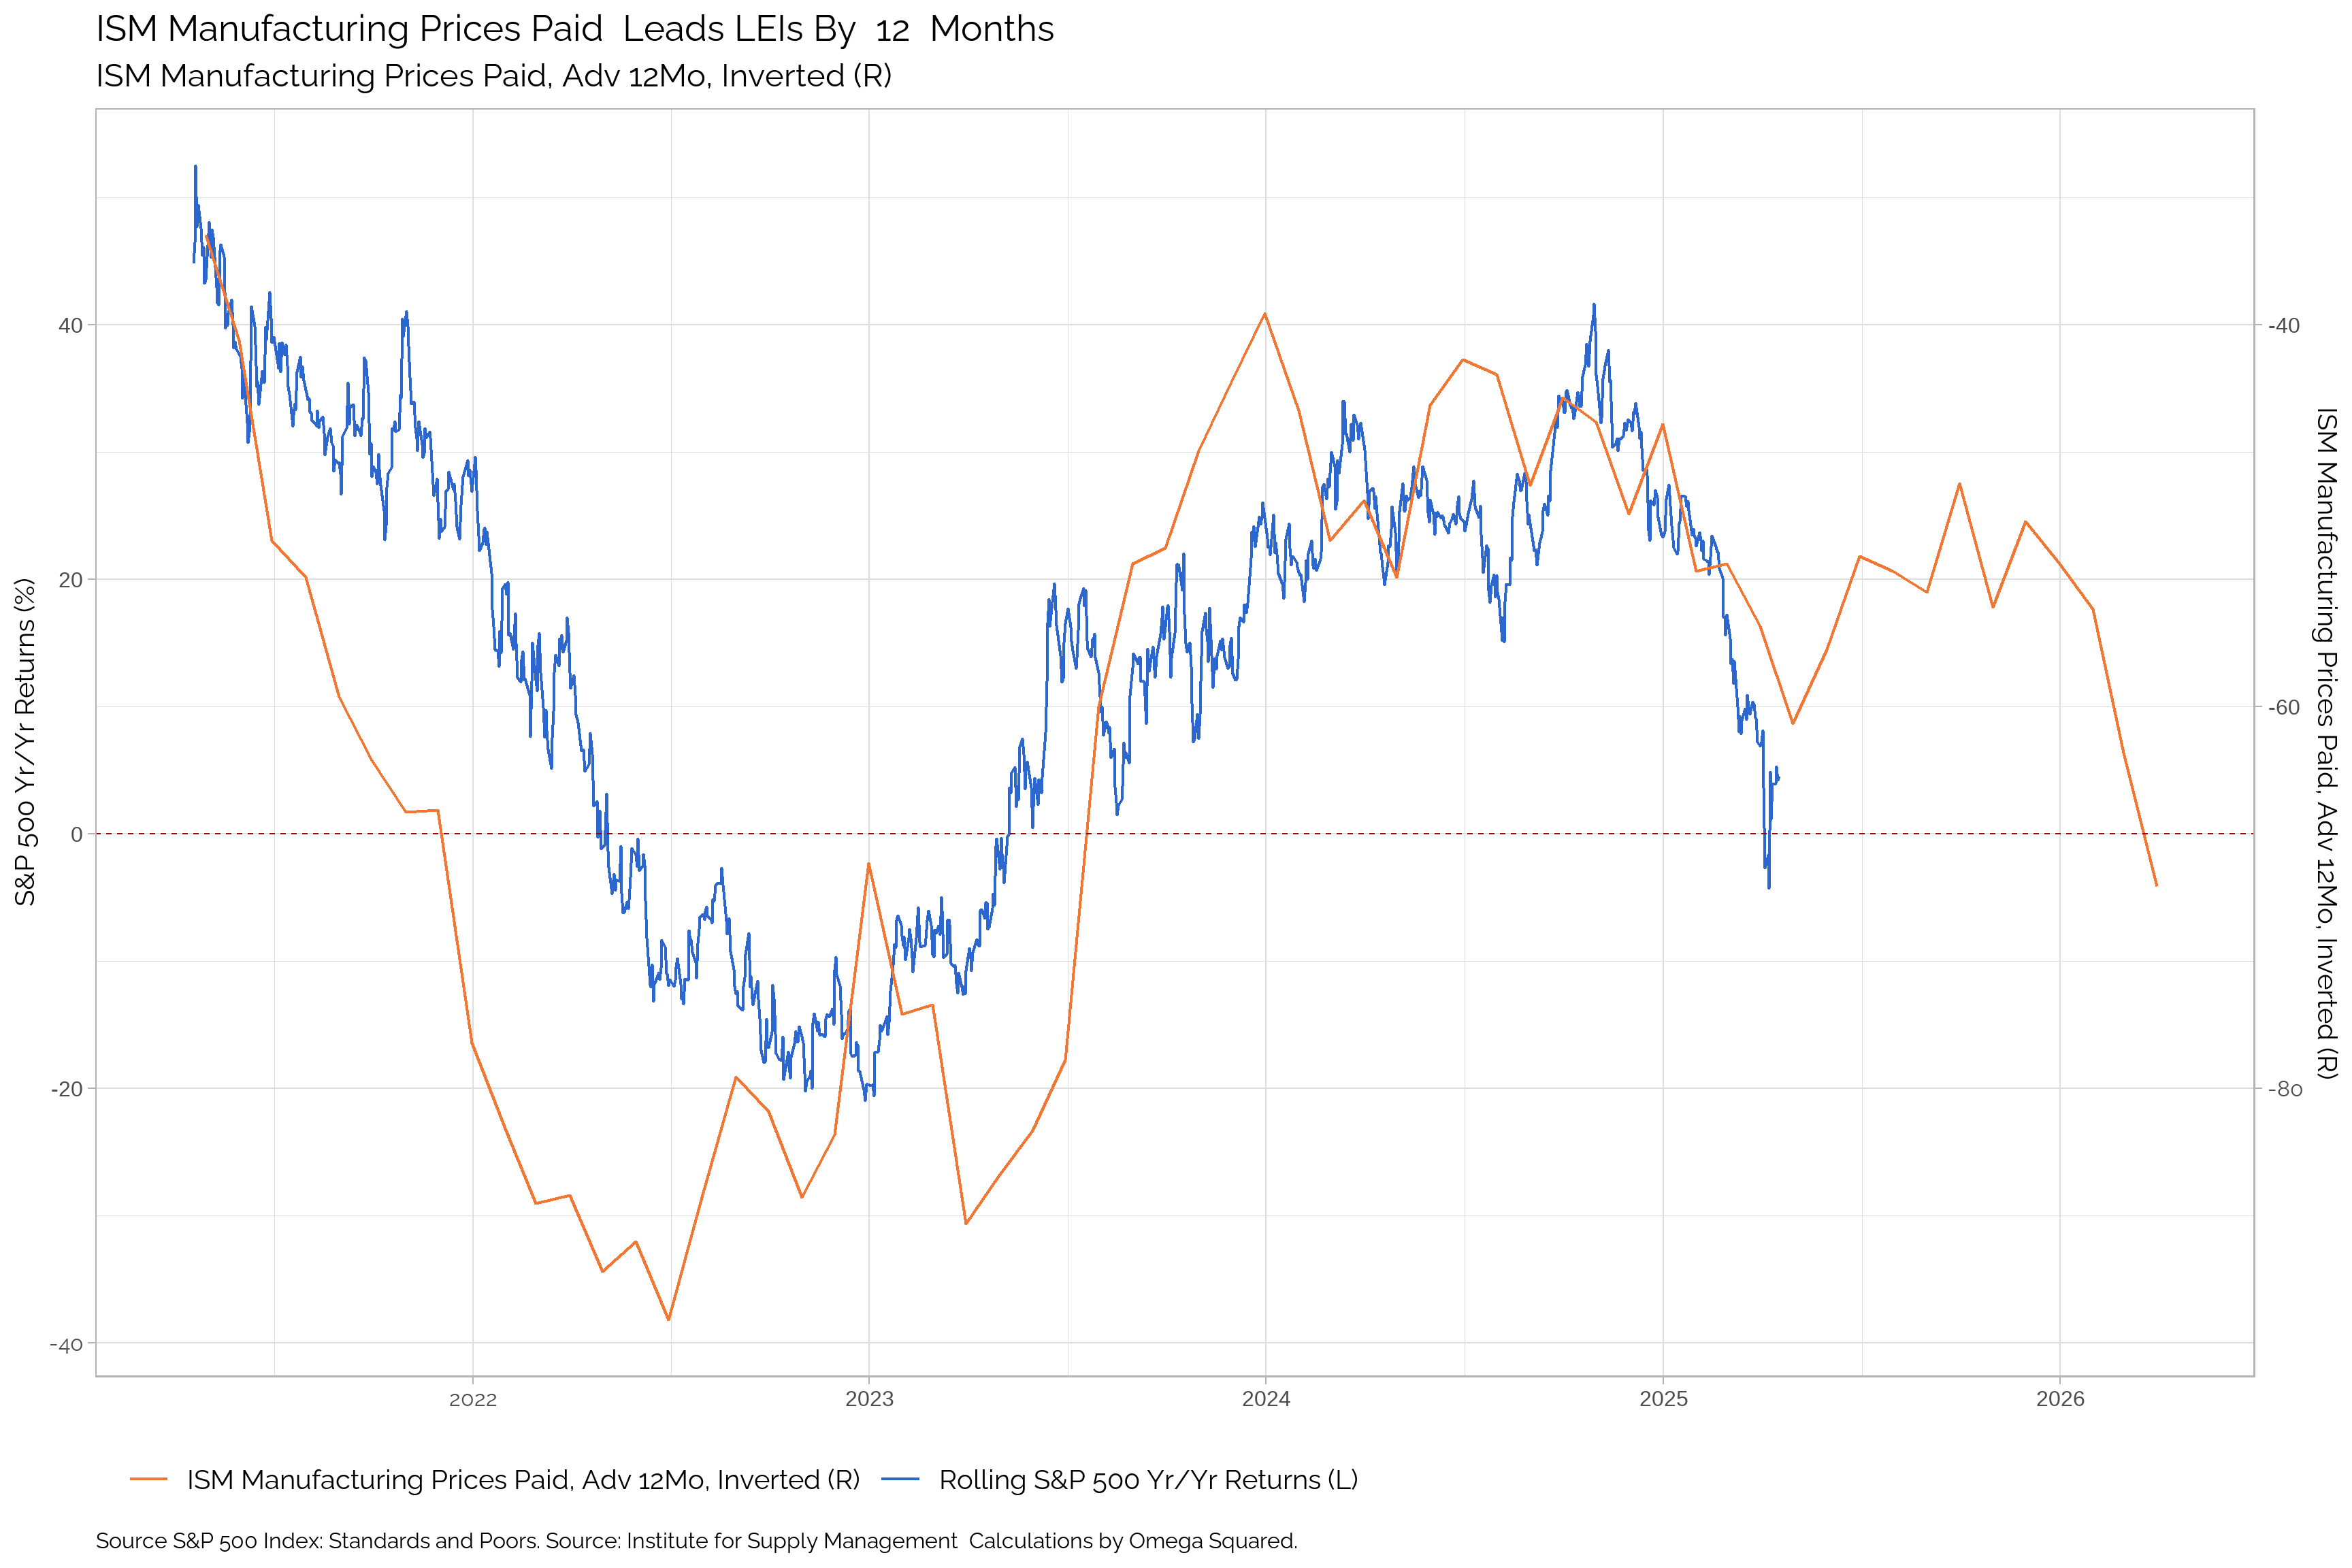
| Apr-25 | Mar-25 | Feb-25 | Jan-25 | Dec-24 | Nov-24 | Oct-24 | Sep-24 | Aug-24 | Jul-24 | Jun-24 | May-24 | |
|---|---|---|---|---|---|---|---|---|---|---|---|---|
| ISM Prices Paid | 69.4 | 62.4 | 54.9 | 52.5 | 50.3 | 54.8 | 48.3 | 54 | 52.9 | 52.1 | 57 | 60.9 |
| Δ in ISM Prices Paid | 7 | 7.5 | 2.4 | 2.2 | -4.5 | 6.5 | -5.7 | 1.1 | 0.8 | -4.9 | -3.9 | 5.1 |
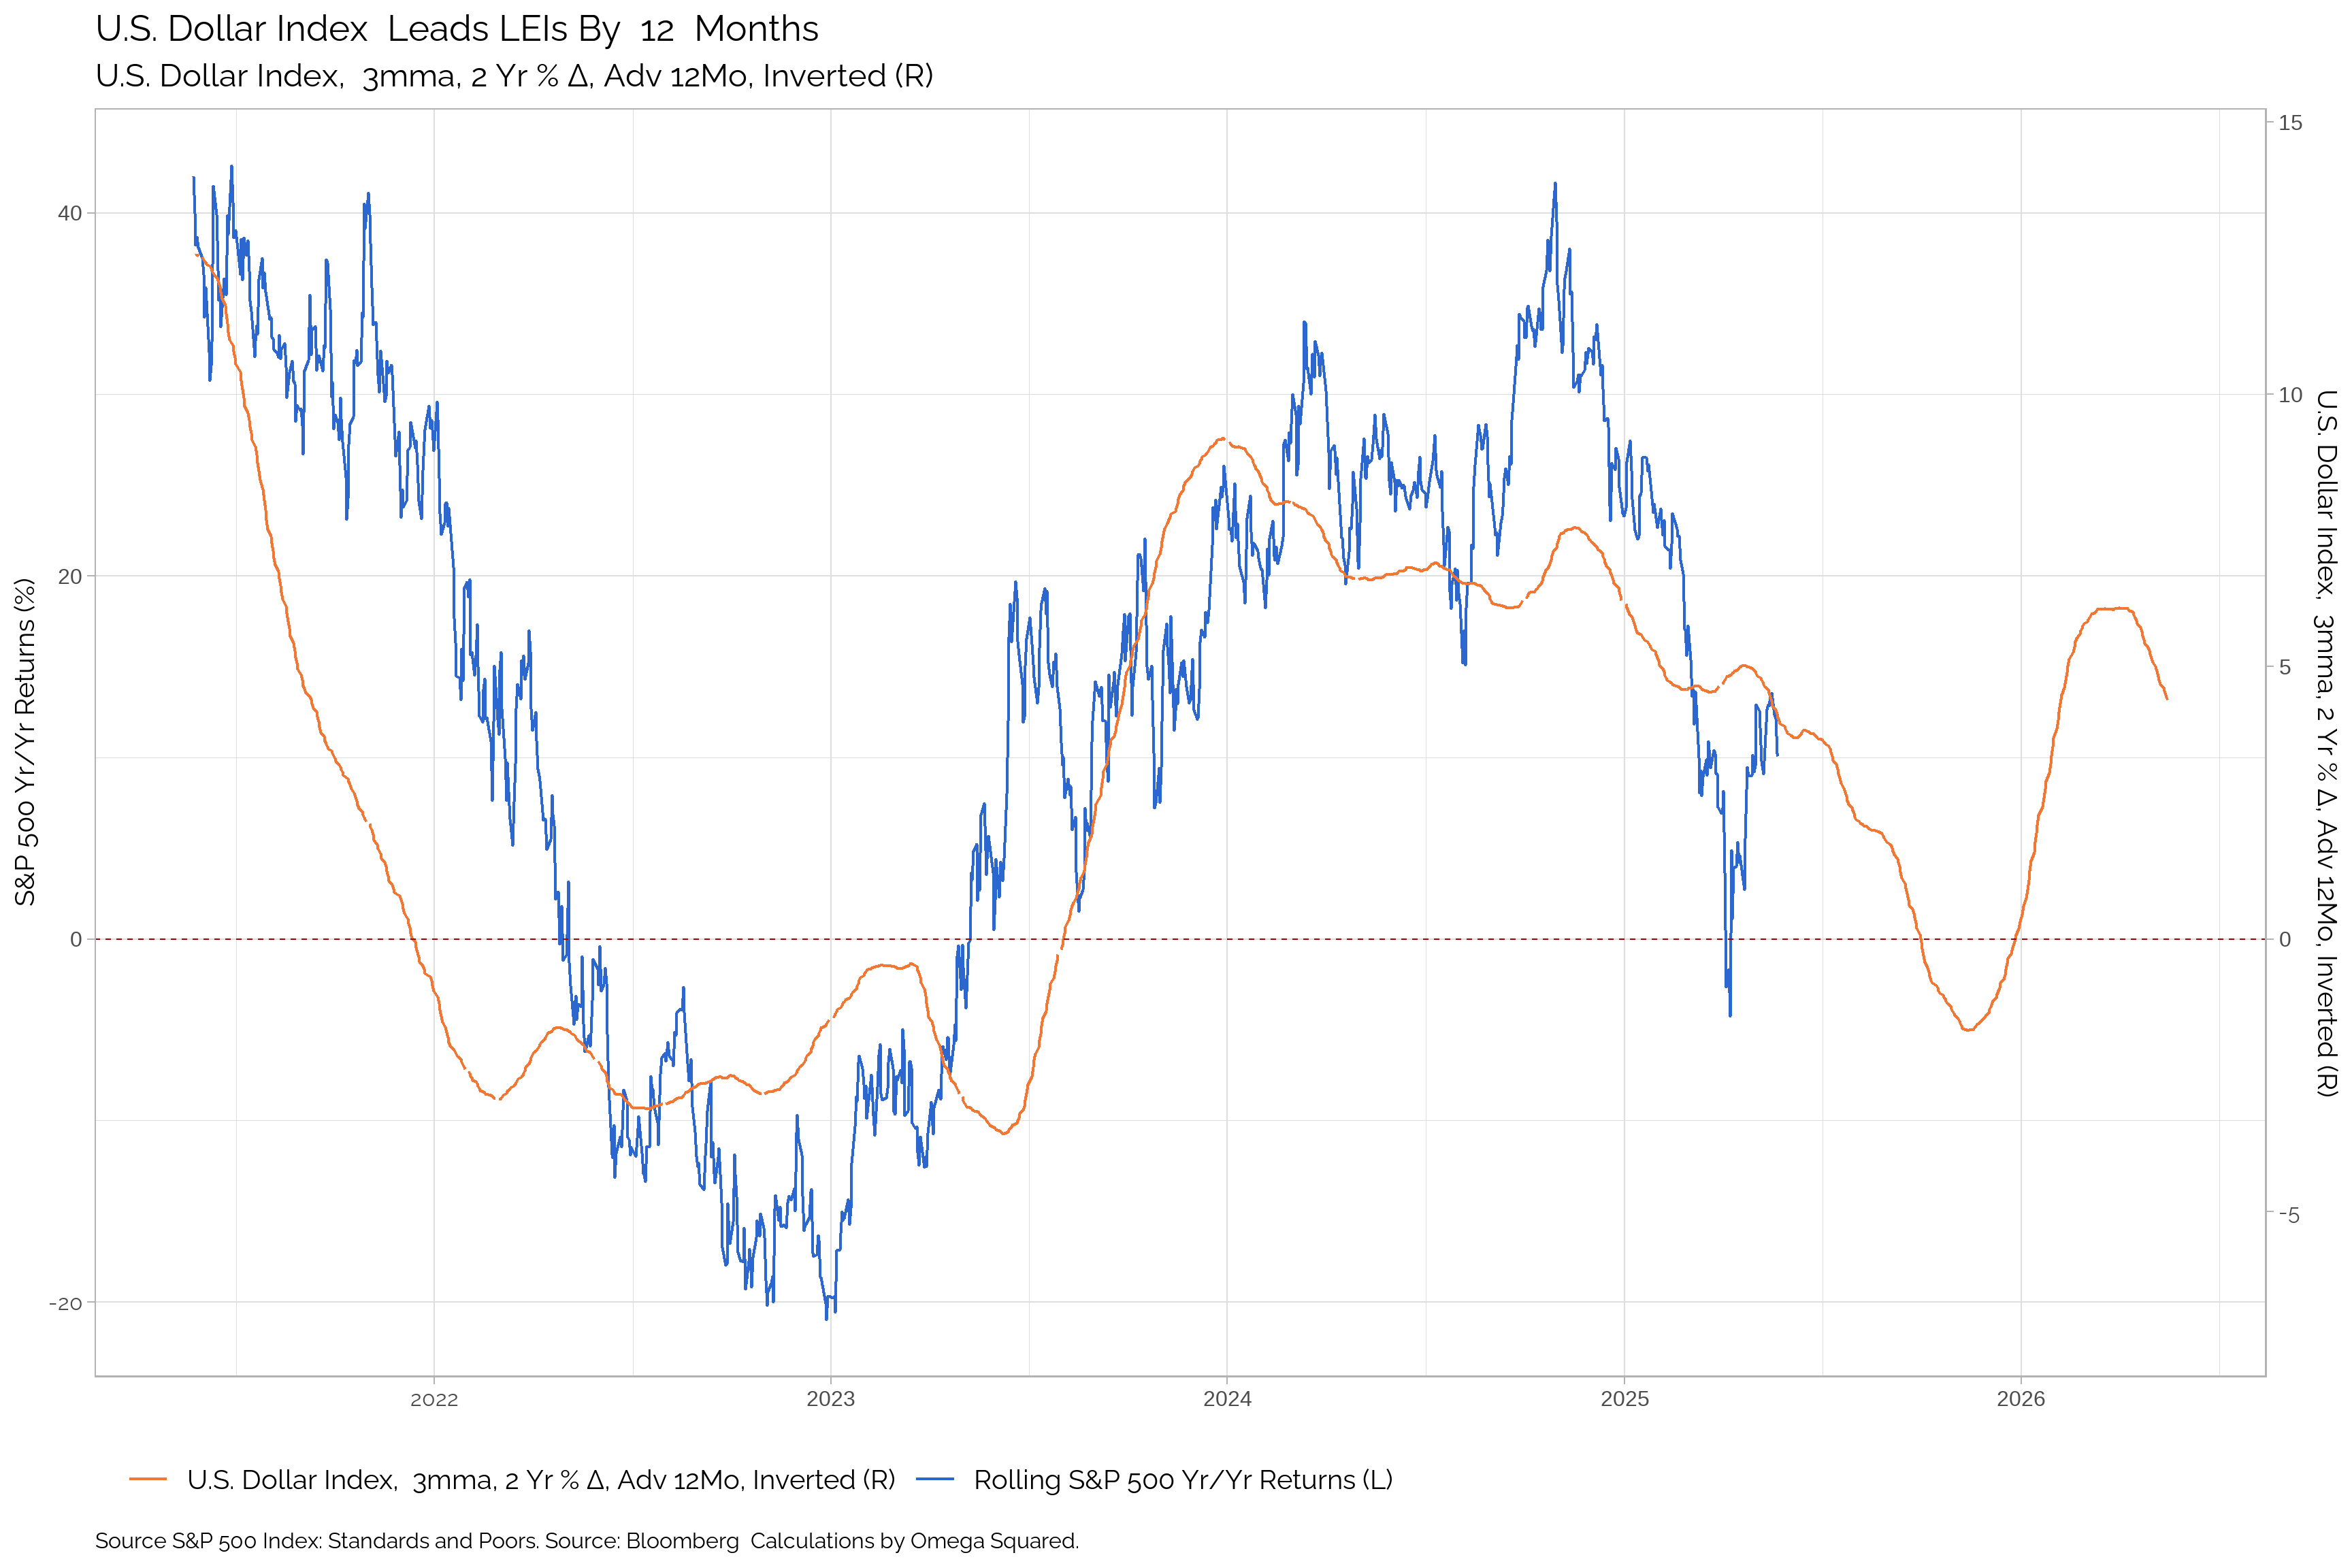
U.S. Dollar Index
| Apr-25 | Mar-25 | Feb-25 | Jan-25 | Dec-24 | Nov-24 | Oct-24 | Sep-24 | Aug-24 | Jul-24 | Jun-24 | May-24 | |
|---|---|---|---|---|---|---|---|---|---|---|---|---|
| Dollar | 127.94 | 128.24 | 127.62 | 125.73 | 123.97 | 123.01 | 122.98 | 123.47 | 123.29 | 122.81 | 121.94 | 121.64 |
| Δ in Dollar | -0.28 | 0.78 | 2.01 | 1.84 | 1.01 | 0.03 | -0.47 | 0.18 | 0.48 | 0.92 | 0.3 | 0.76 |
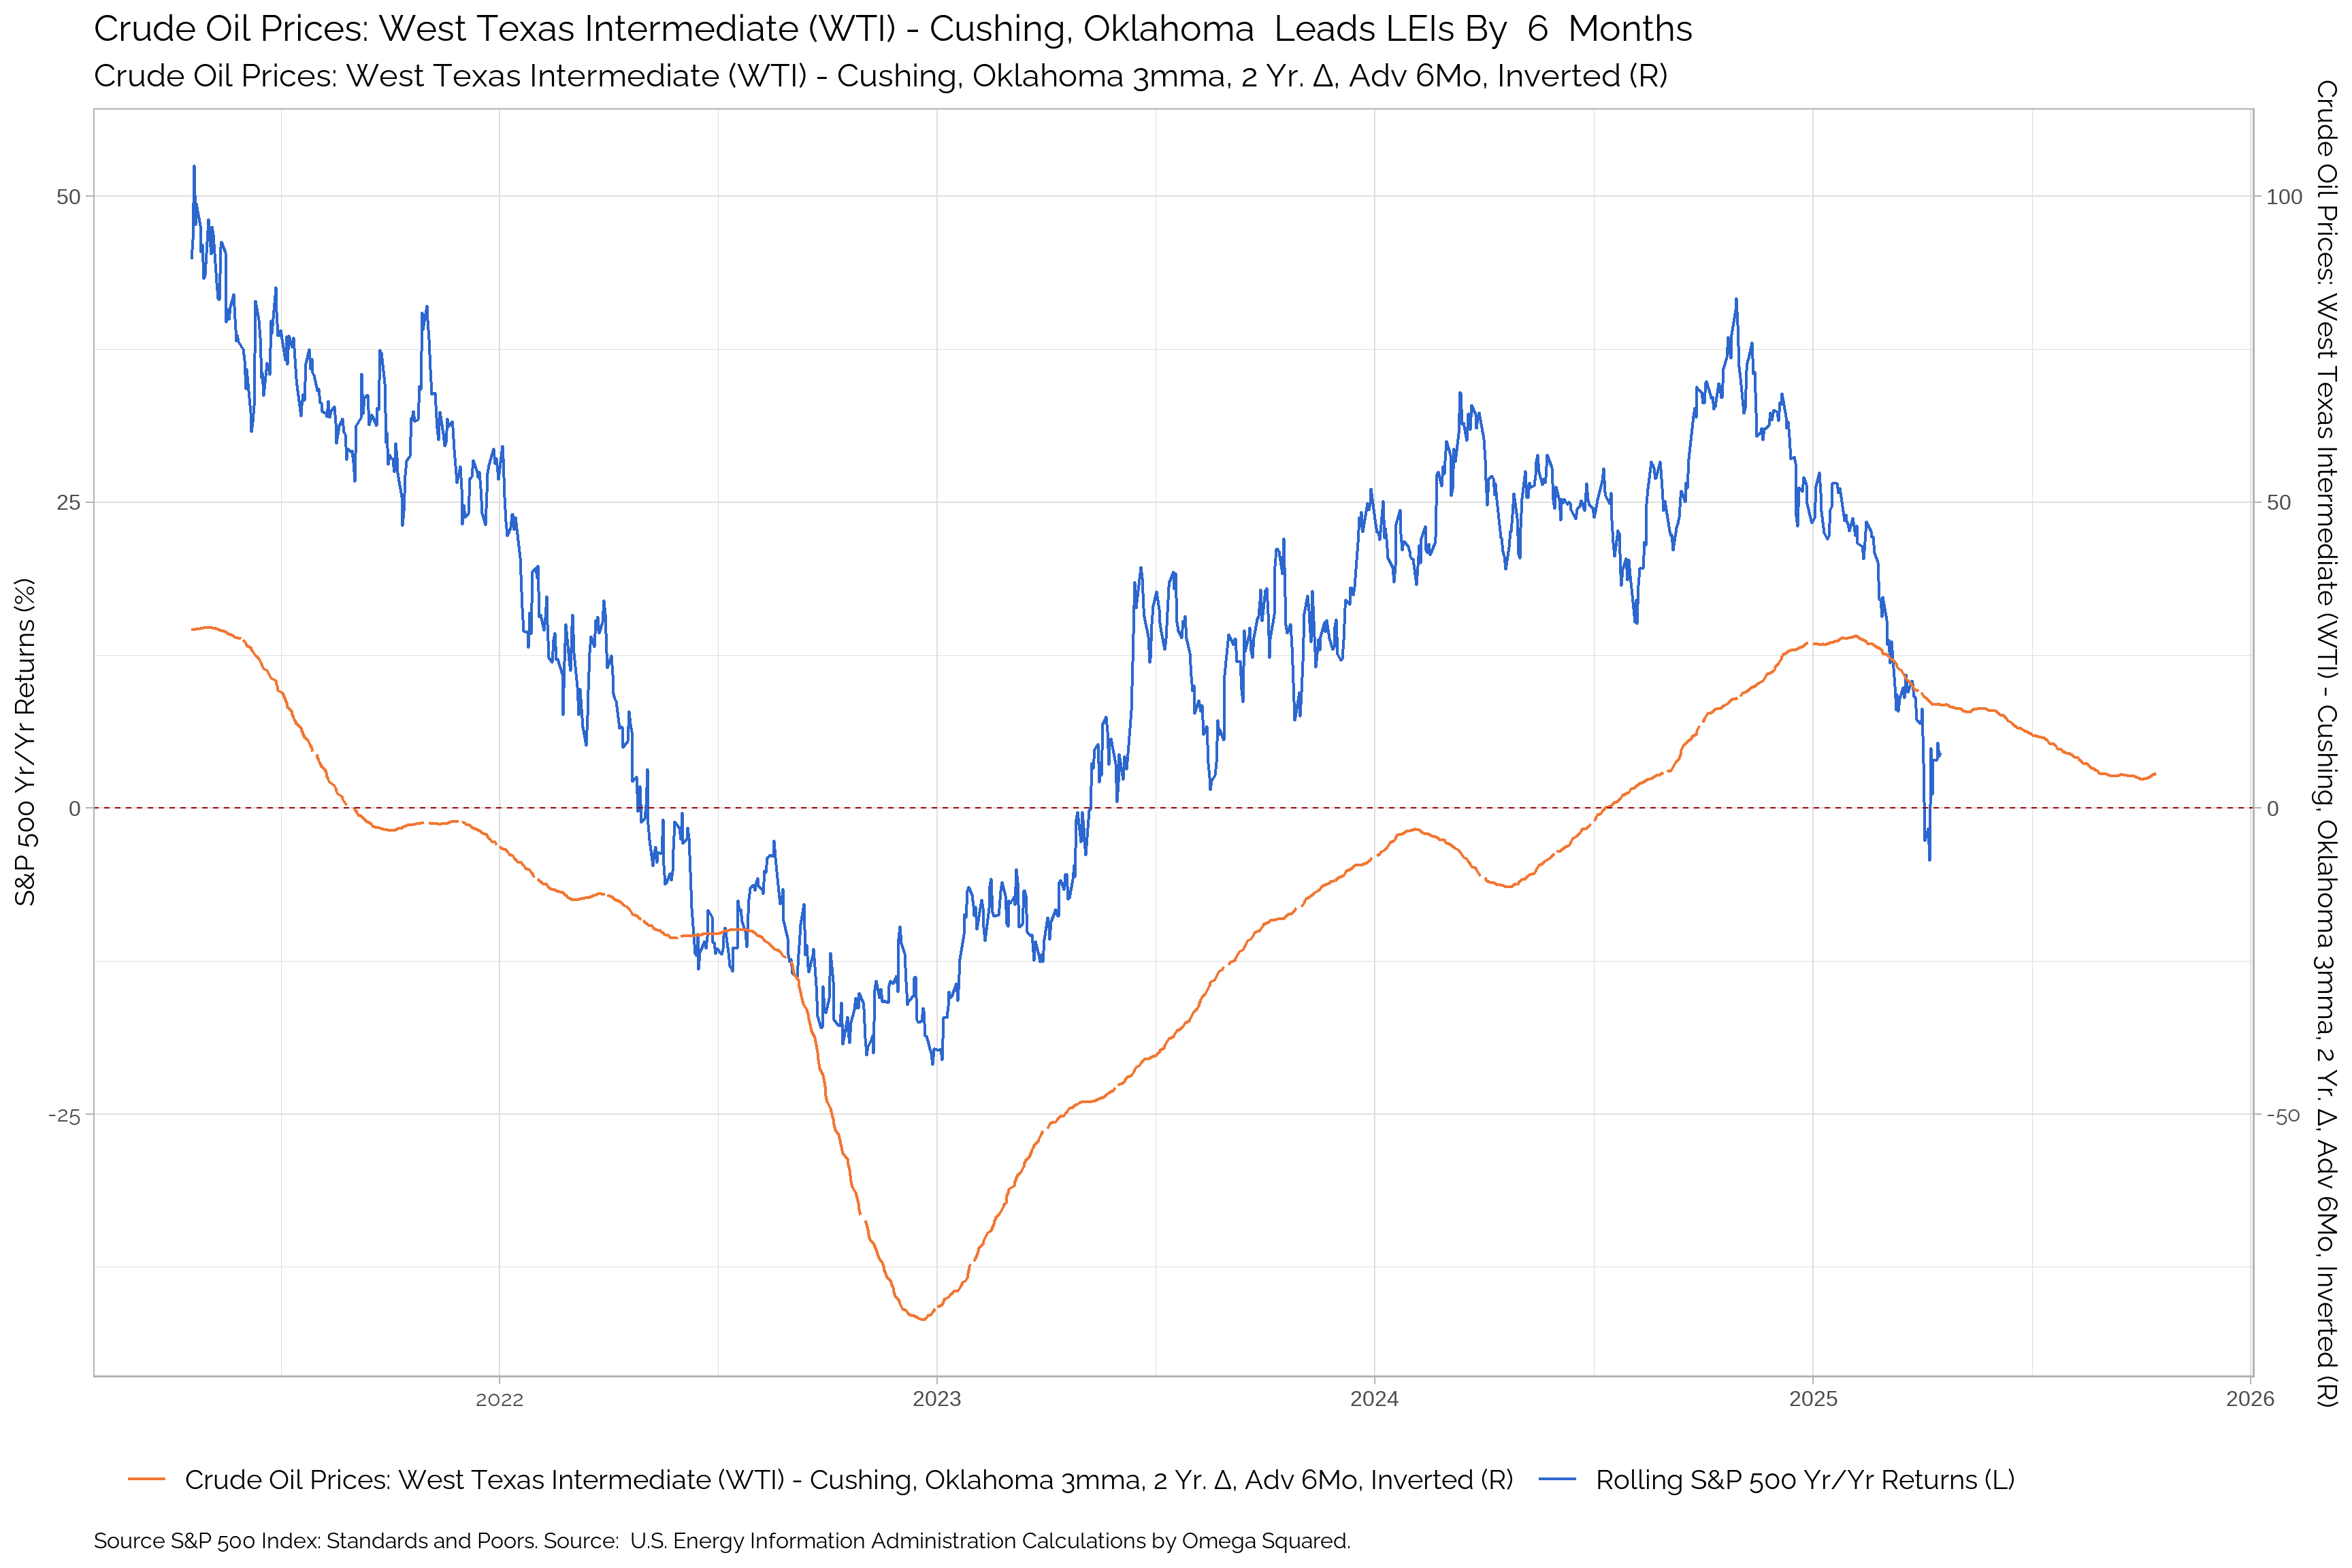
Oil (WTI Crude Oil)
| Apr-25 | Mar-25 | Feb-25 | Jan-25 | Dec-24 | Nov-24 | Oct-24 | Sep-24 | Aug-24 | Jul-24 | Jun-24 | May-24 | |
|---|---|---|---|---|---|---|---|---|---|---|---|---|
| WTI Crude Oil | 71.72 | 72.19 | 71.71 | 70.63 | 71.2 | 73.2 | 76.62 | 79.38 | 80.74 | 81.85 | 82.16 | 81.19 |
| Δ in WTI Crude Oil | -0.46 | 0.53 | 1.09 | -0.69 | -2.44 | -3.43 | -2.88 | -1.36 | -1.11 | -0.29 | 0.97 | 3.99 |
Gasoline Prices
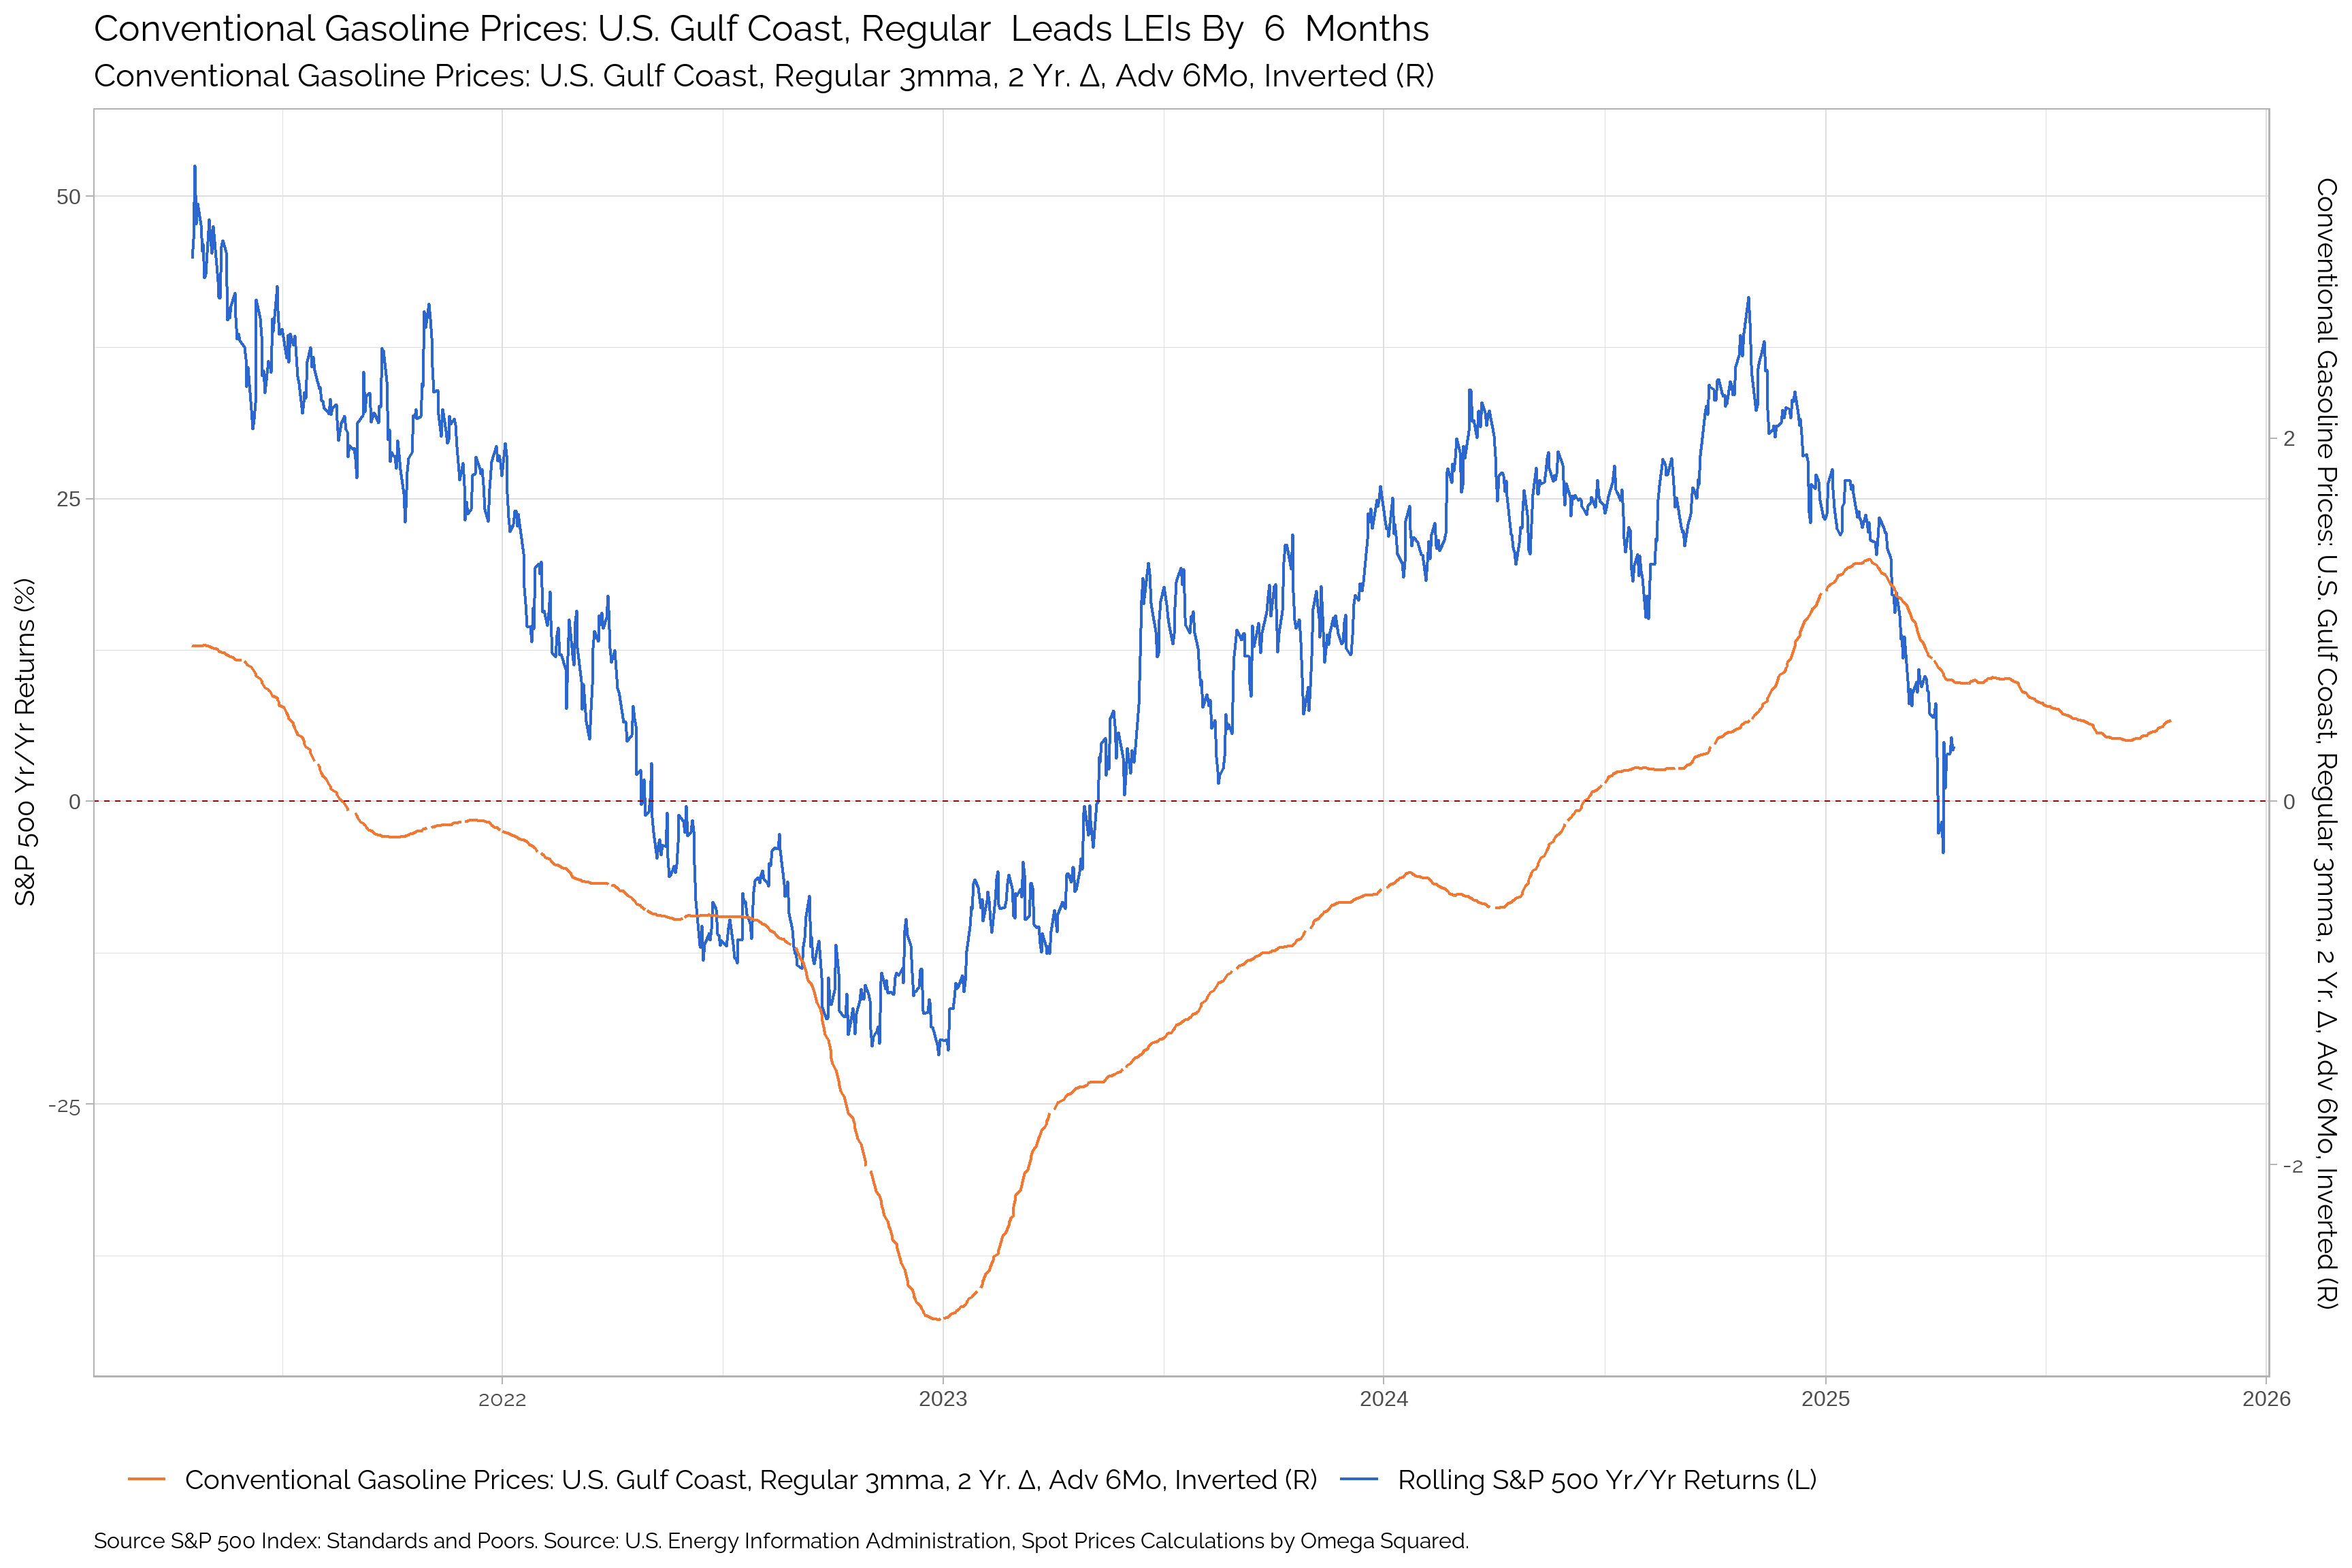
| Apr-25 | Mar-25 | Feb-25 | Jan-25 | Dec-24 | Nov-24 | Oct-24 | Sep-24 | Aug-24 | Jul-24 | Jun-24 | May-24 | |
|---|---|---|---|---|---|---|---|---|---|---|---|---|
| Gasoline Prices | 2.06 | 2.02 | 1.98 | 1.97 | 2 | 2.11 | 2.23 | 2.32 | 2.36 | 2.43 | 2.5 | 2.48 |
| Δ in Gasoline Prices | 0.04 | 0.04 | 0.01 | -0.04 | -0.13 | -0.12 | -0.09 | -0.04 | -0.07 | -0.08 | 0.03 | 0.16 |
Capacity Utilization
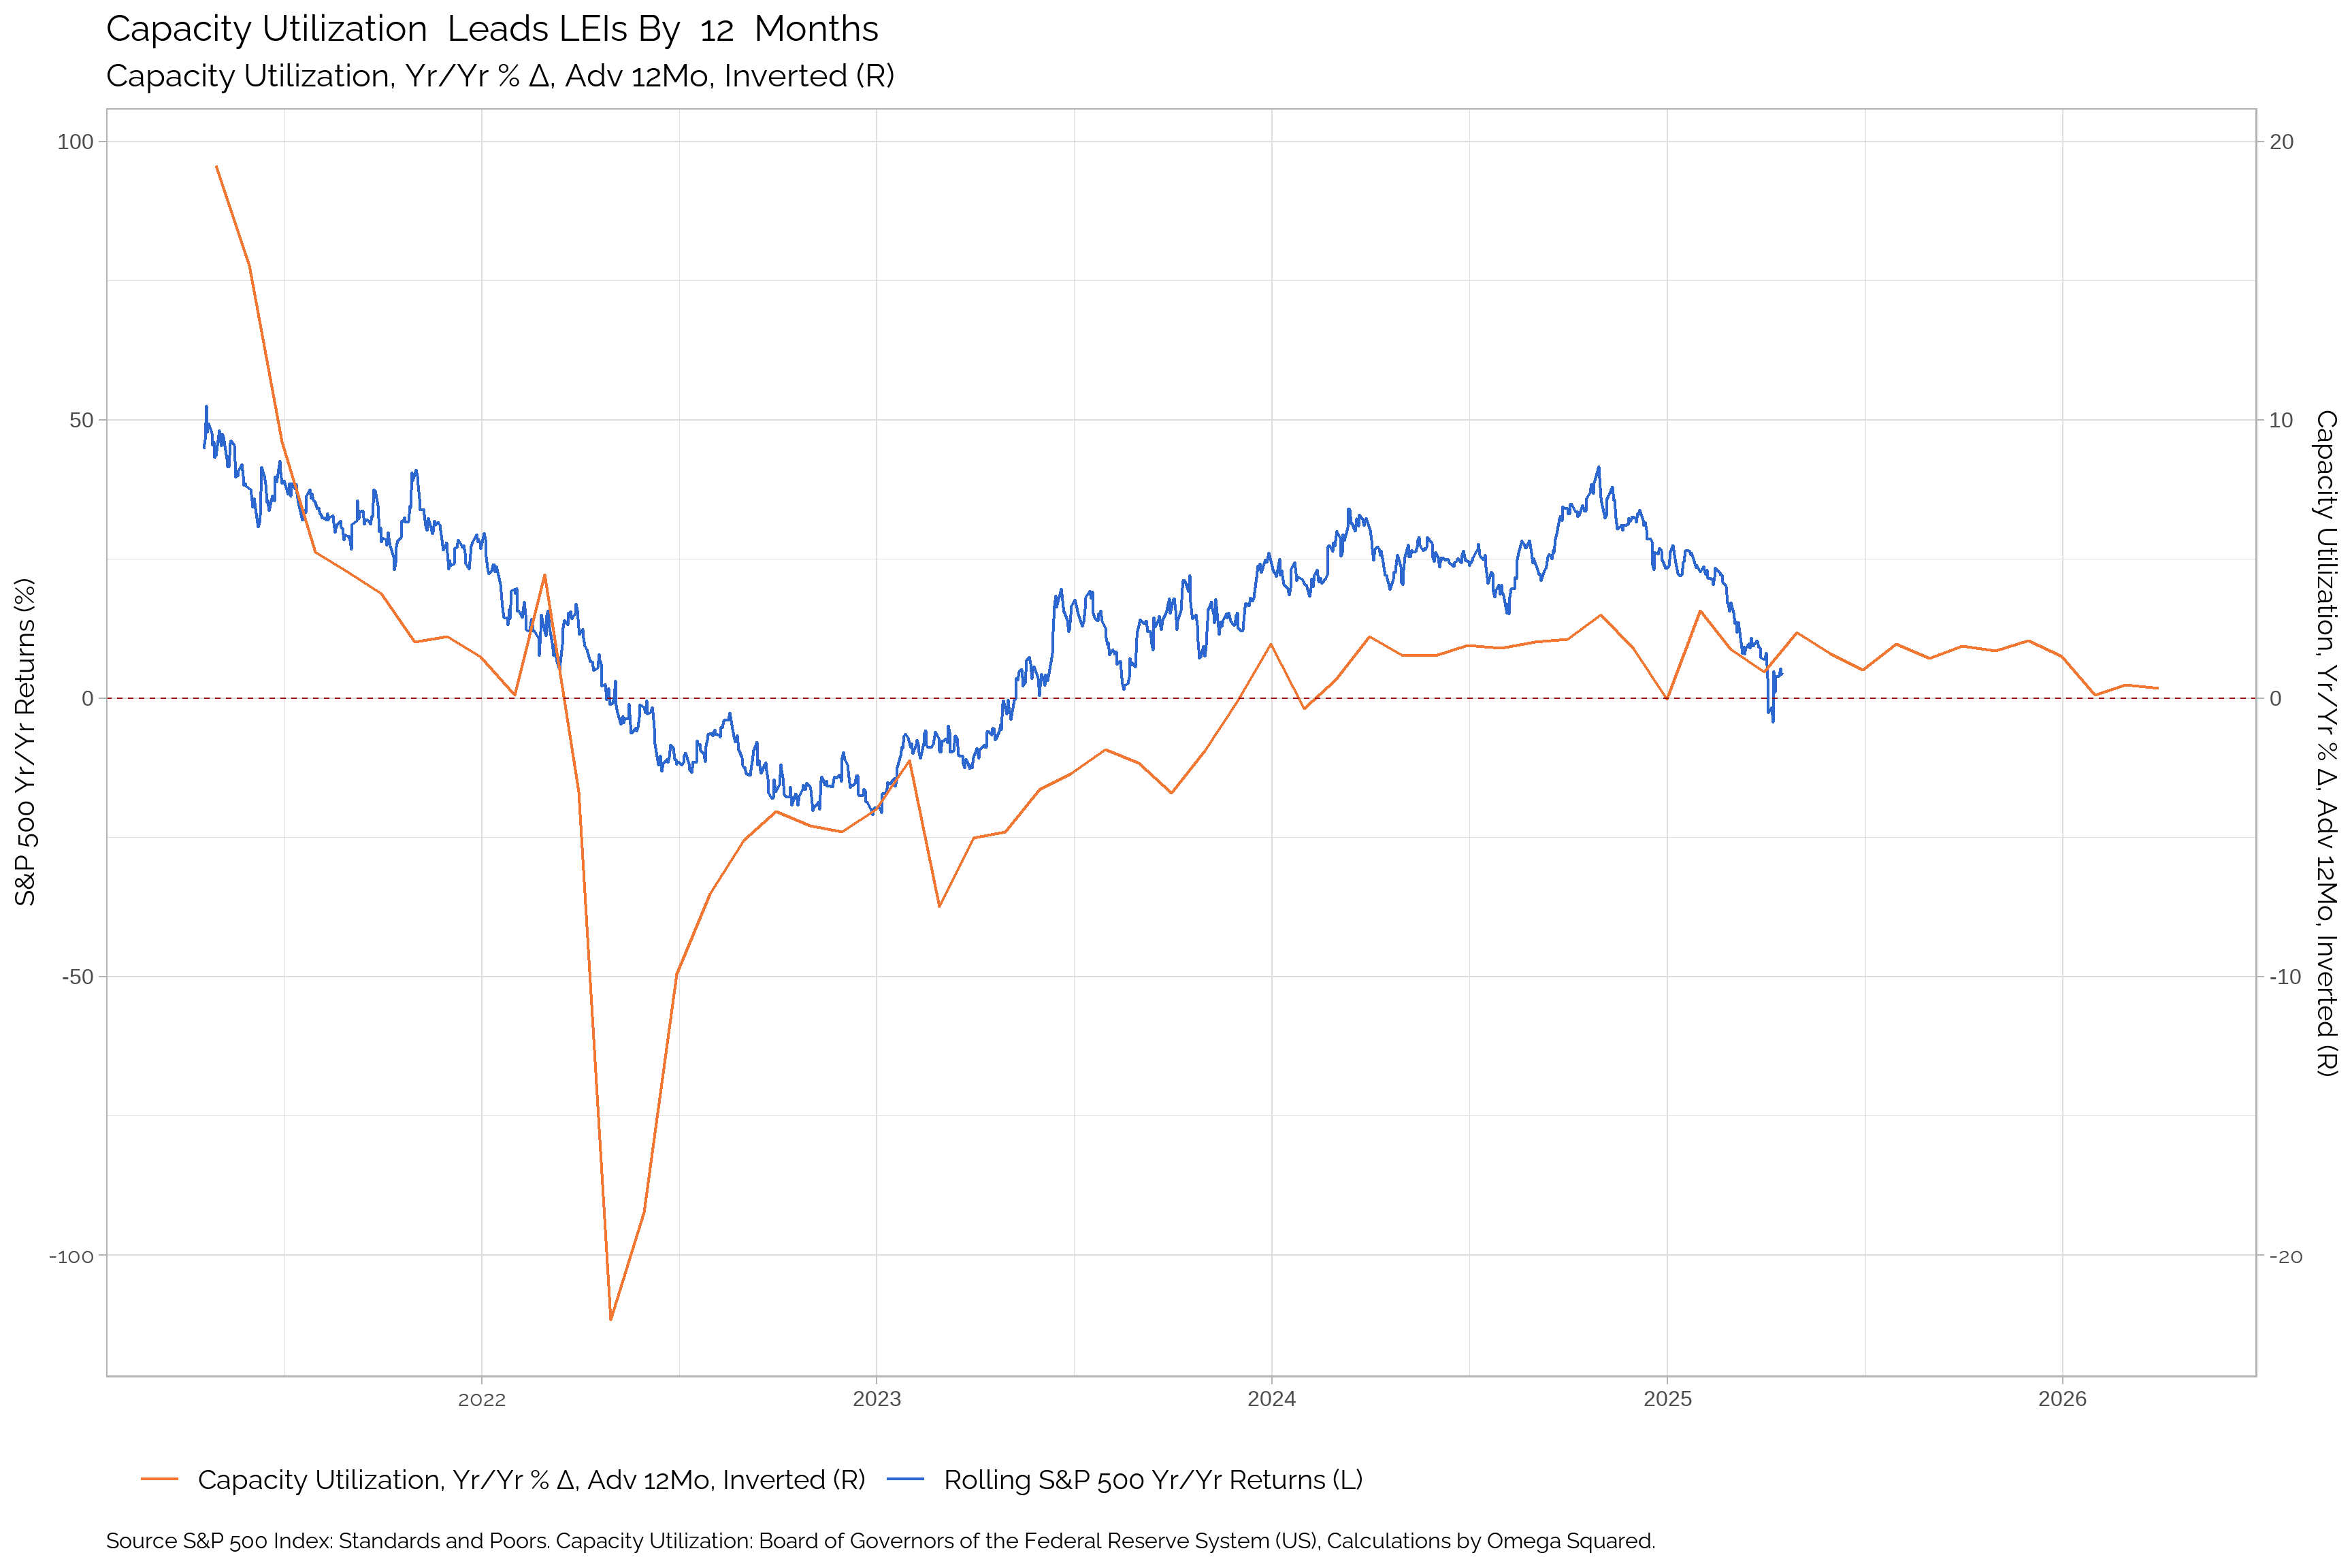
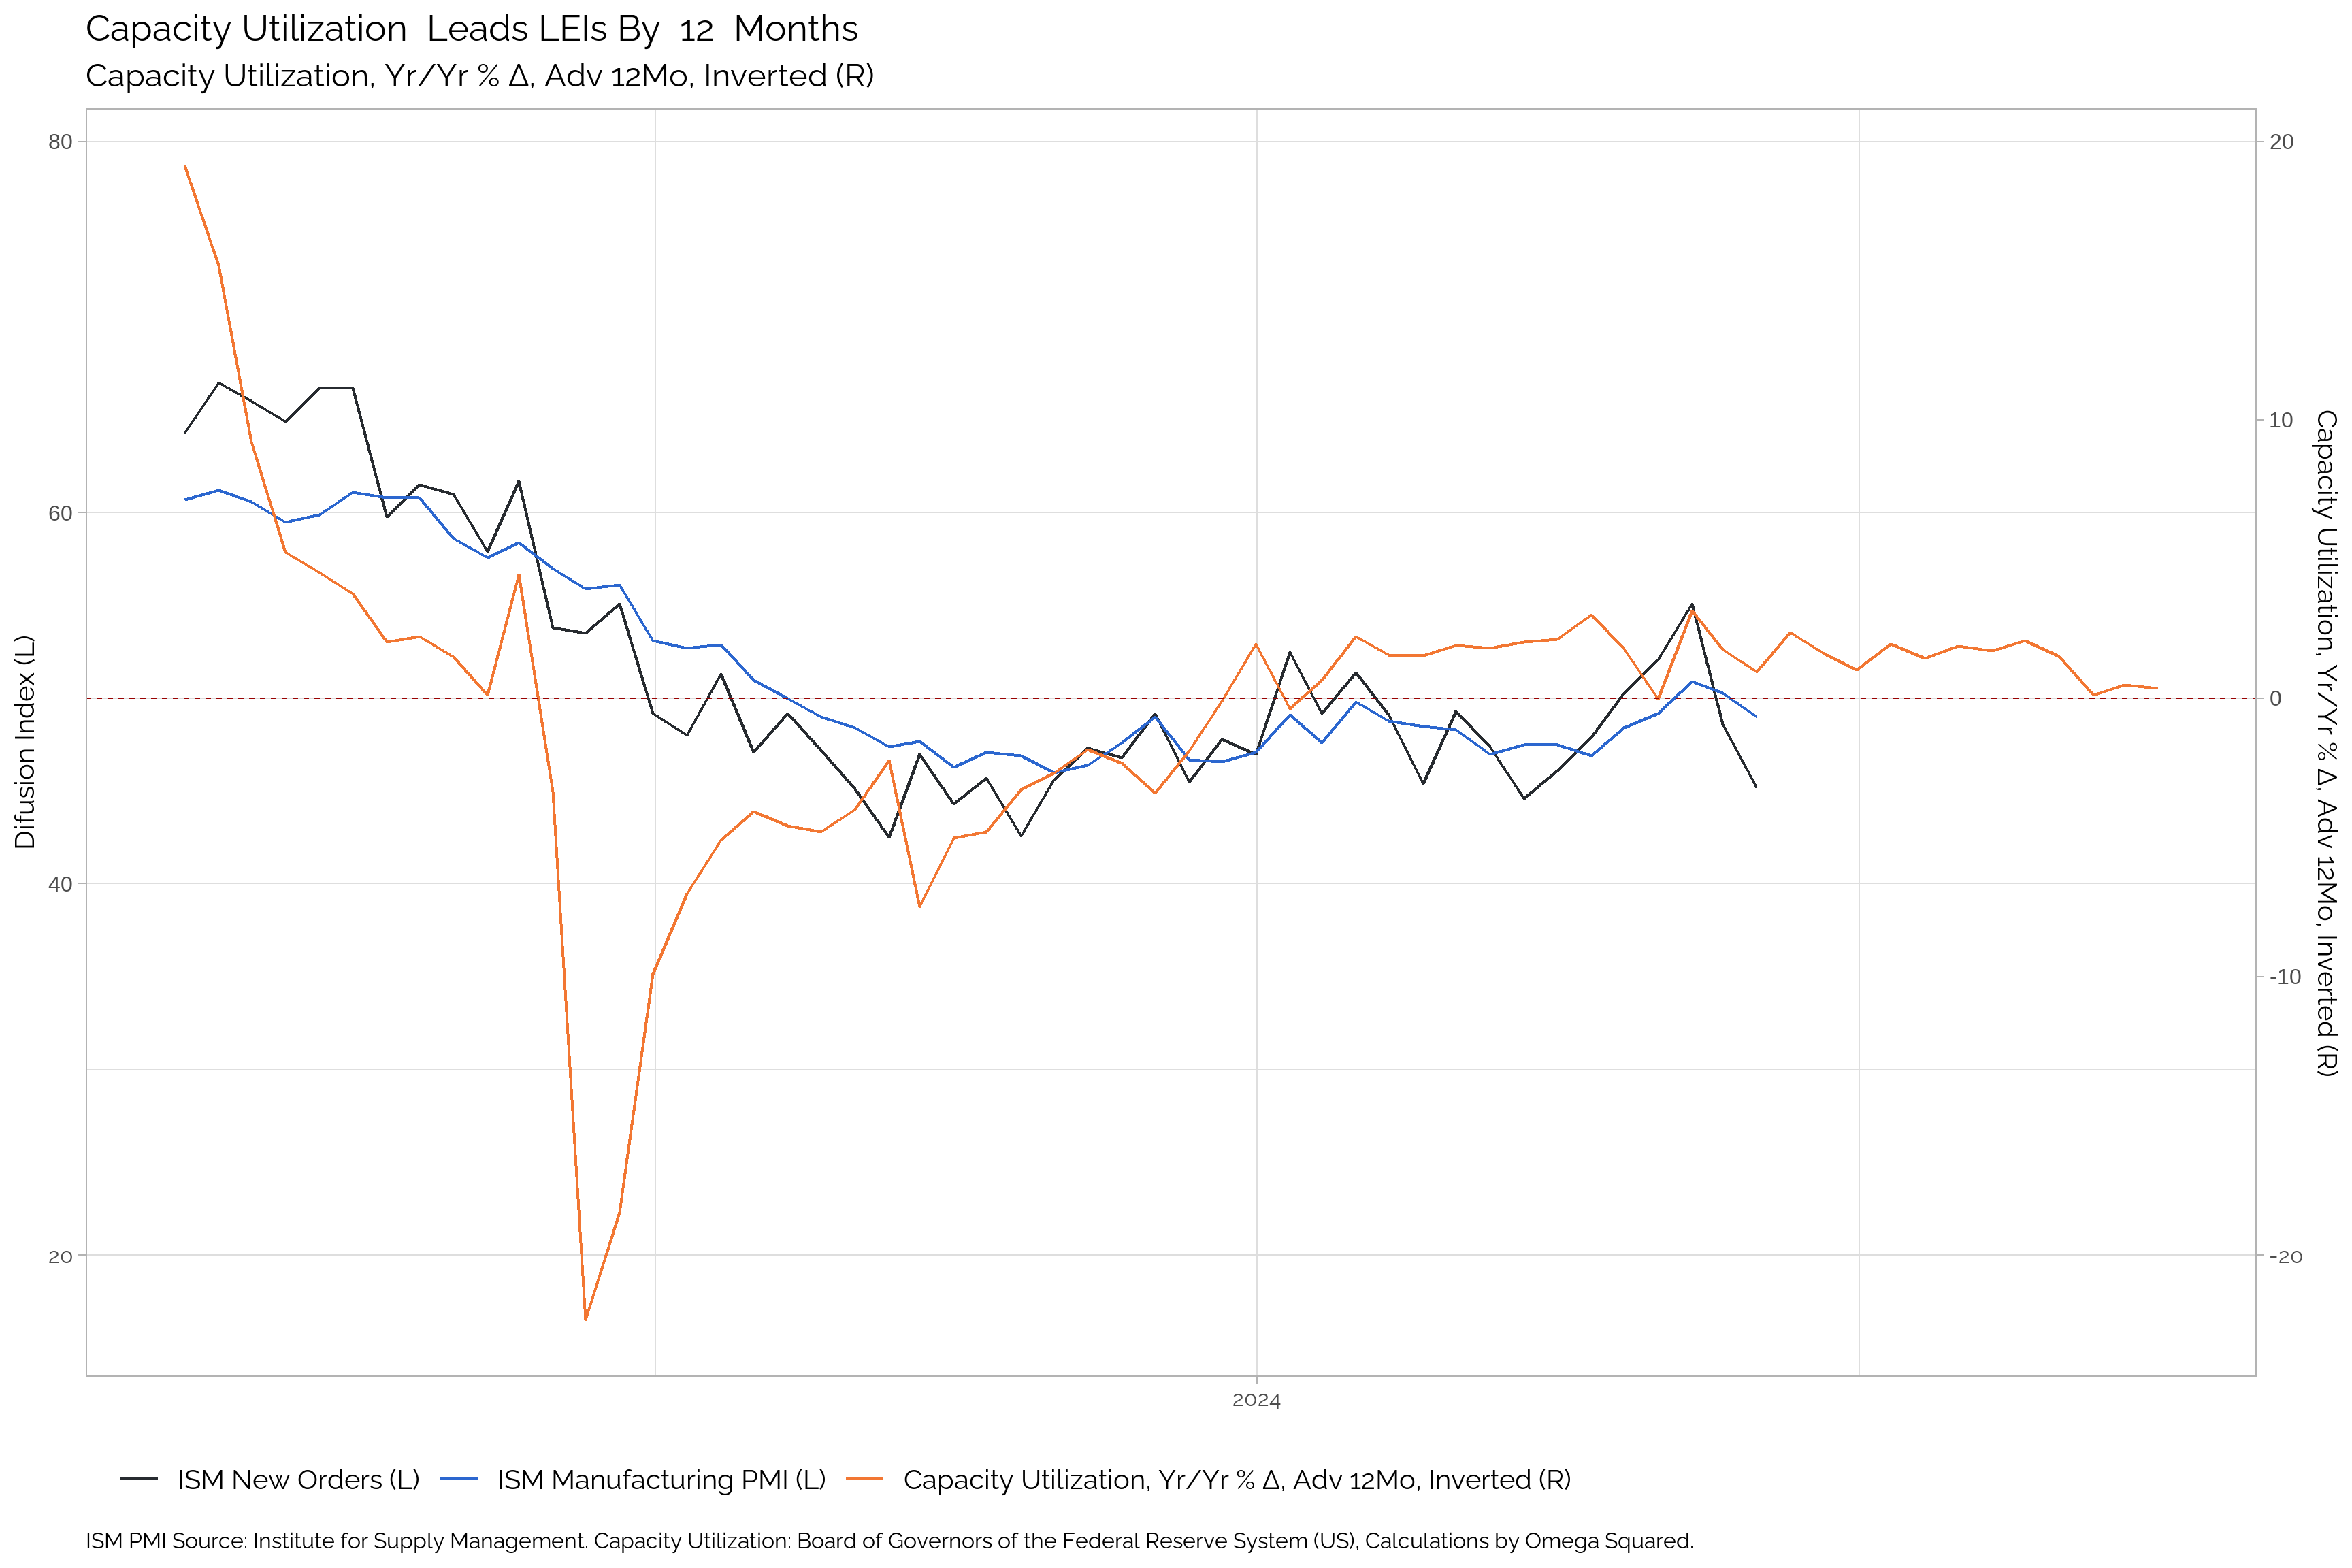
| Apr-25 | Mar-25 | Feb-25 | Jan-25 | Dec-24 | Nov-24 | Oct-24 | Sep-24 | Aug-24 | Jul-24 | Jun-24 | May-24 | |
|---|---|---|---|---|---|---|---|---|---|---|---|---|
| Capacity Utilization | -- | 76.92 | 76.33 | 76.39 | 76.09 | 76.06 | 76.57 | 76.91 | 76.56 | 77.14 | 77.27 | 76.84 |
| Δ in Capacity Utilization | -- | 0.59 | -0.06 | 0.3 | 0.03 | -0.51 | -0.34 | 0.34 | -0.58 | -0.13 | 0.43 | -0.62 |
Wage Inflation
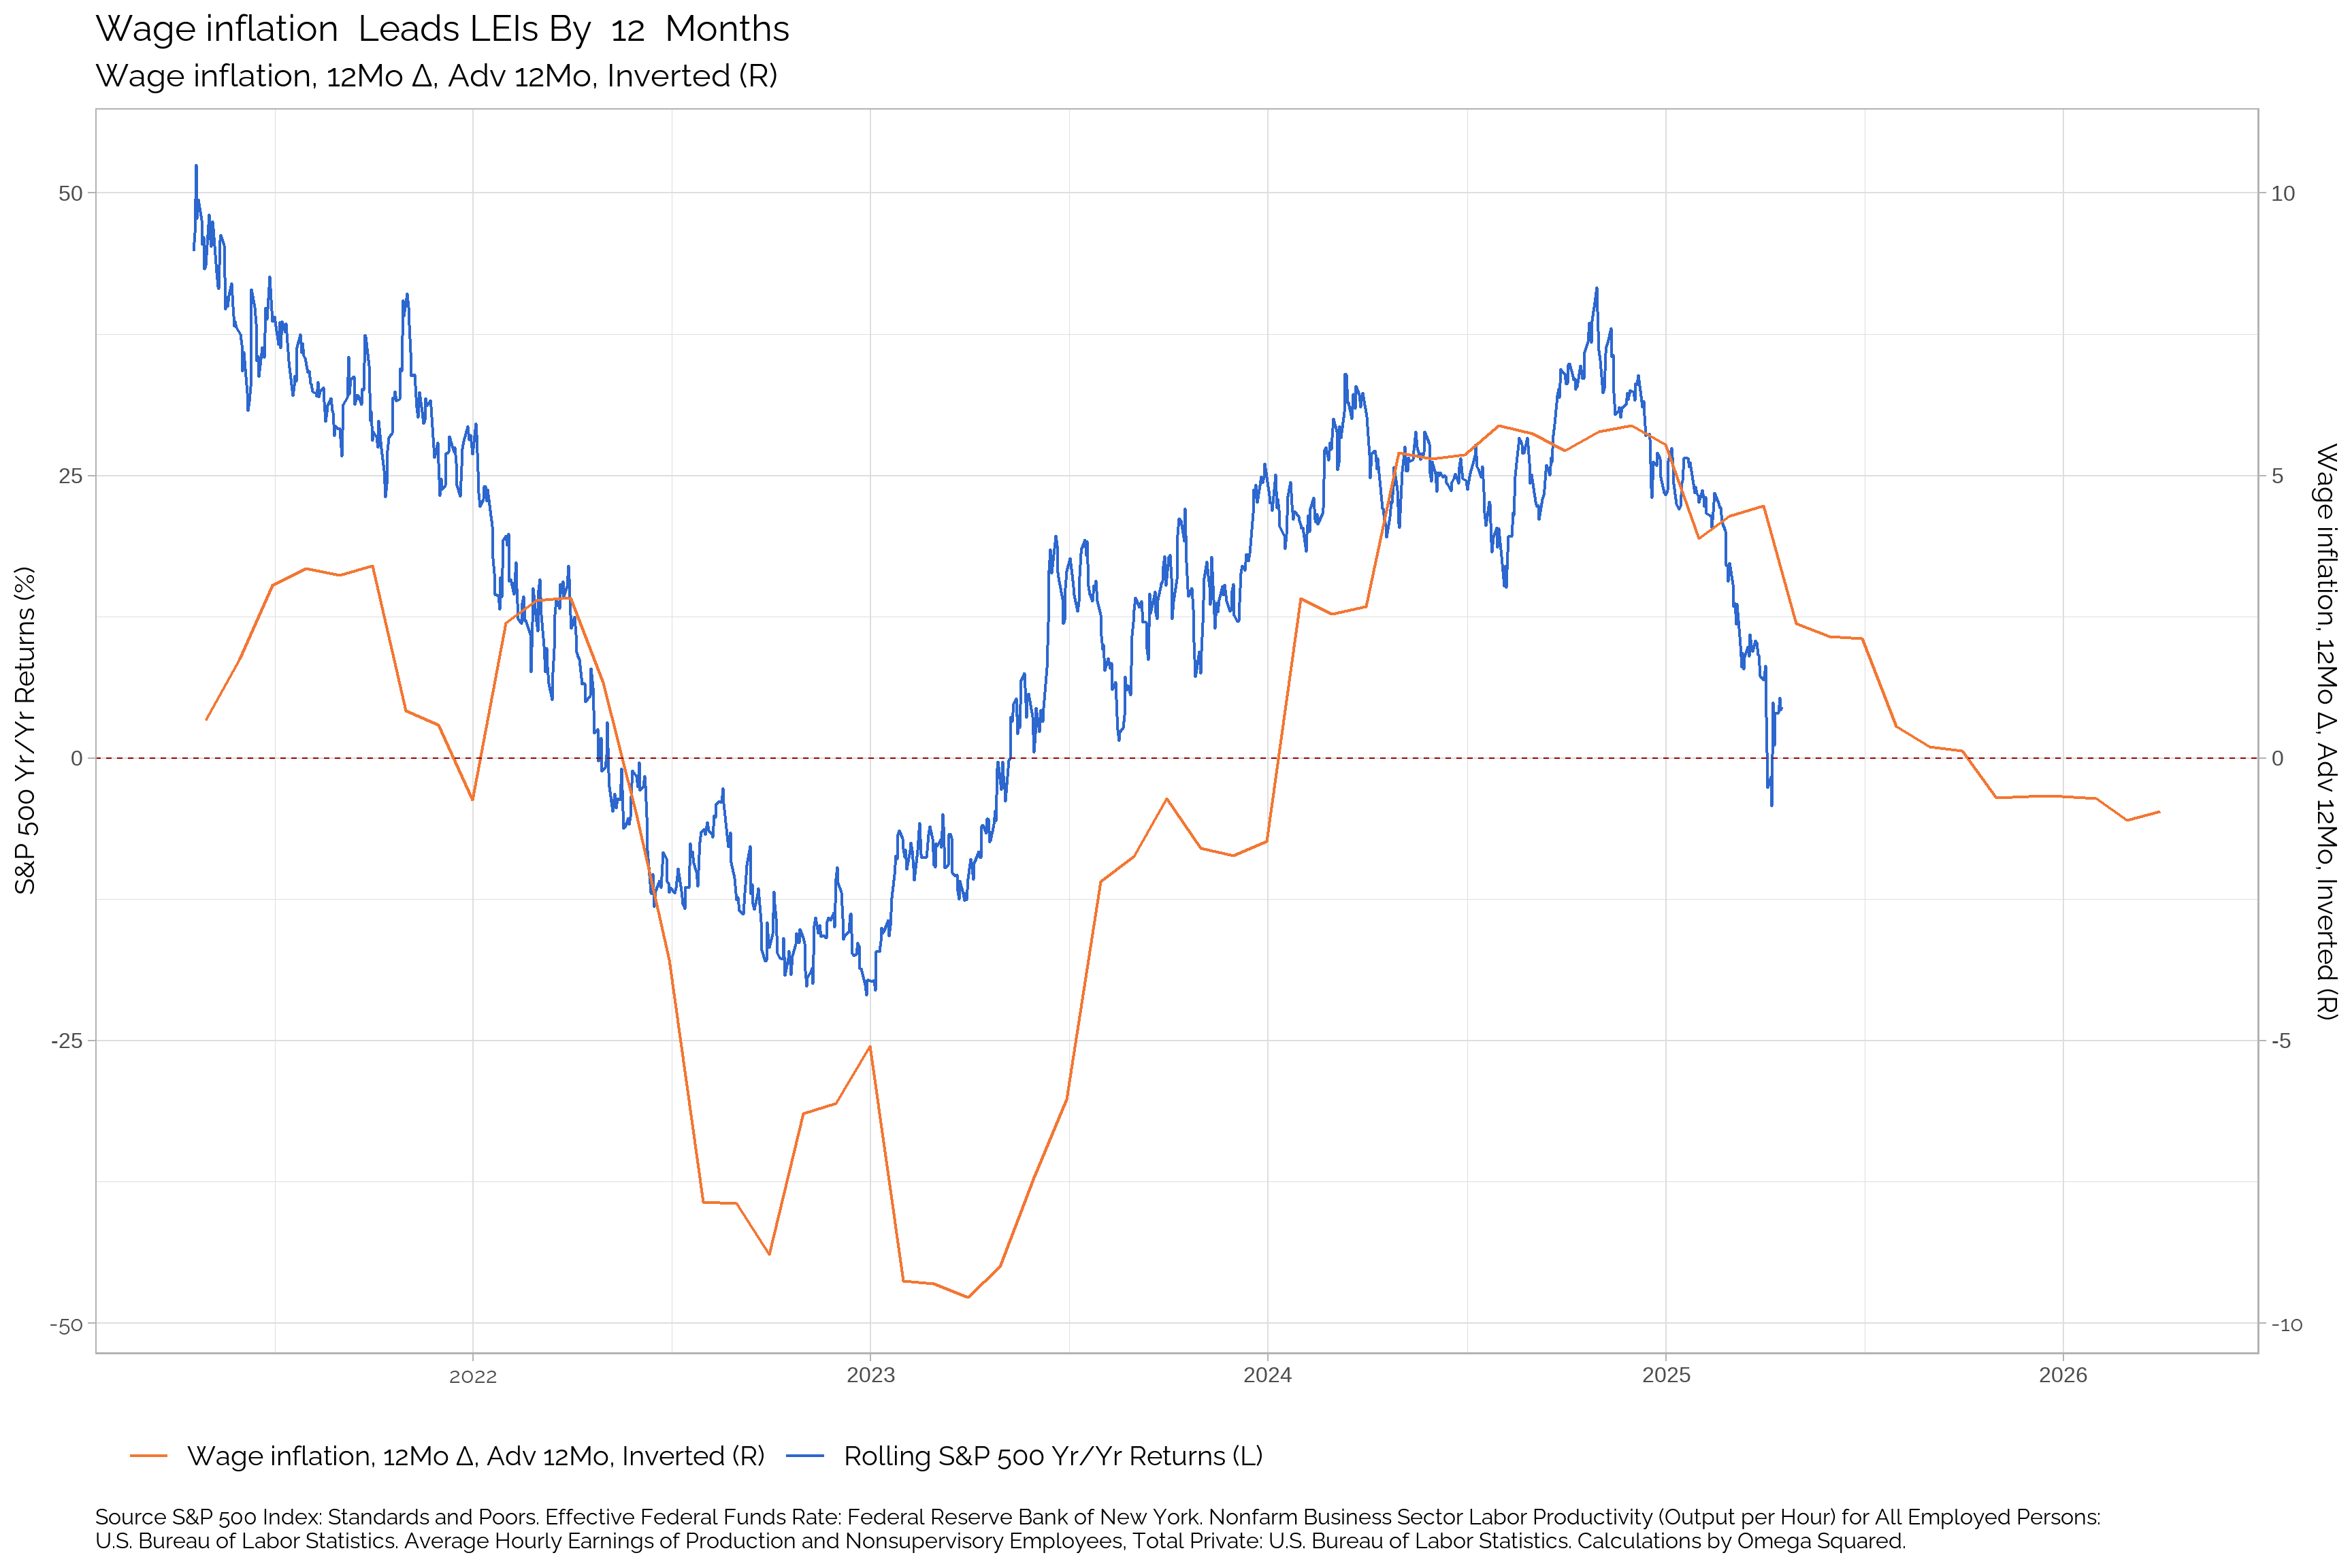
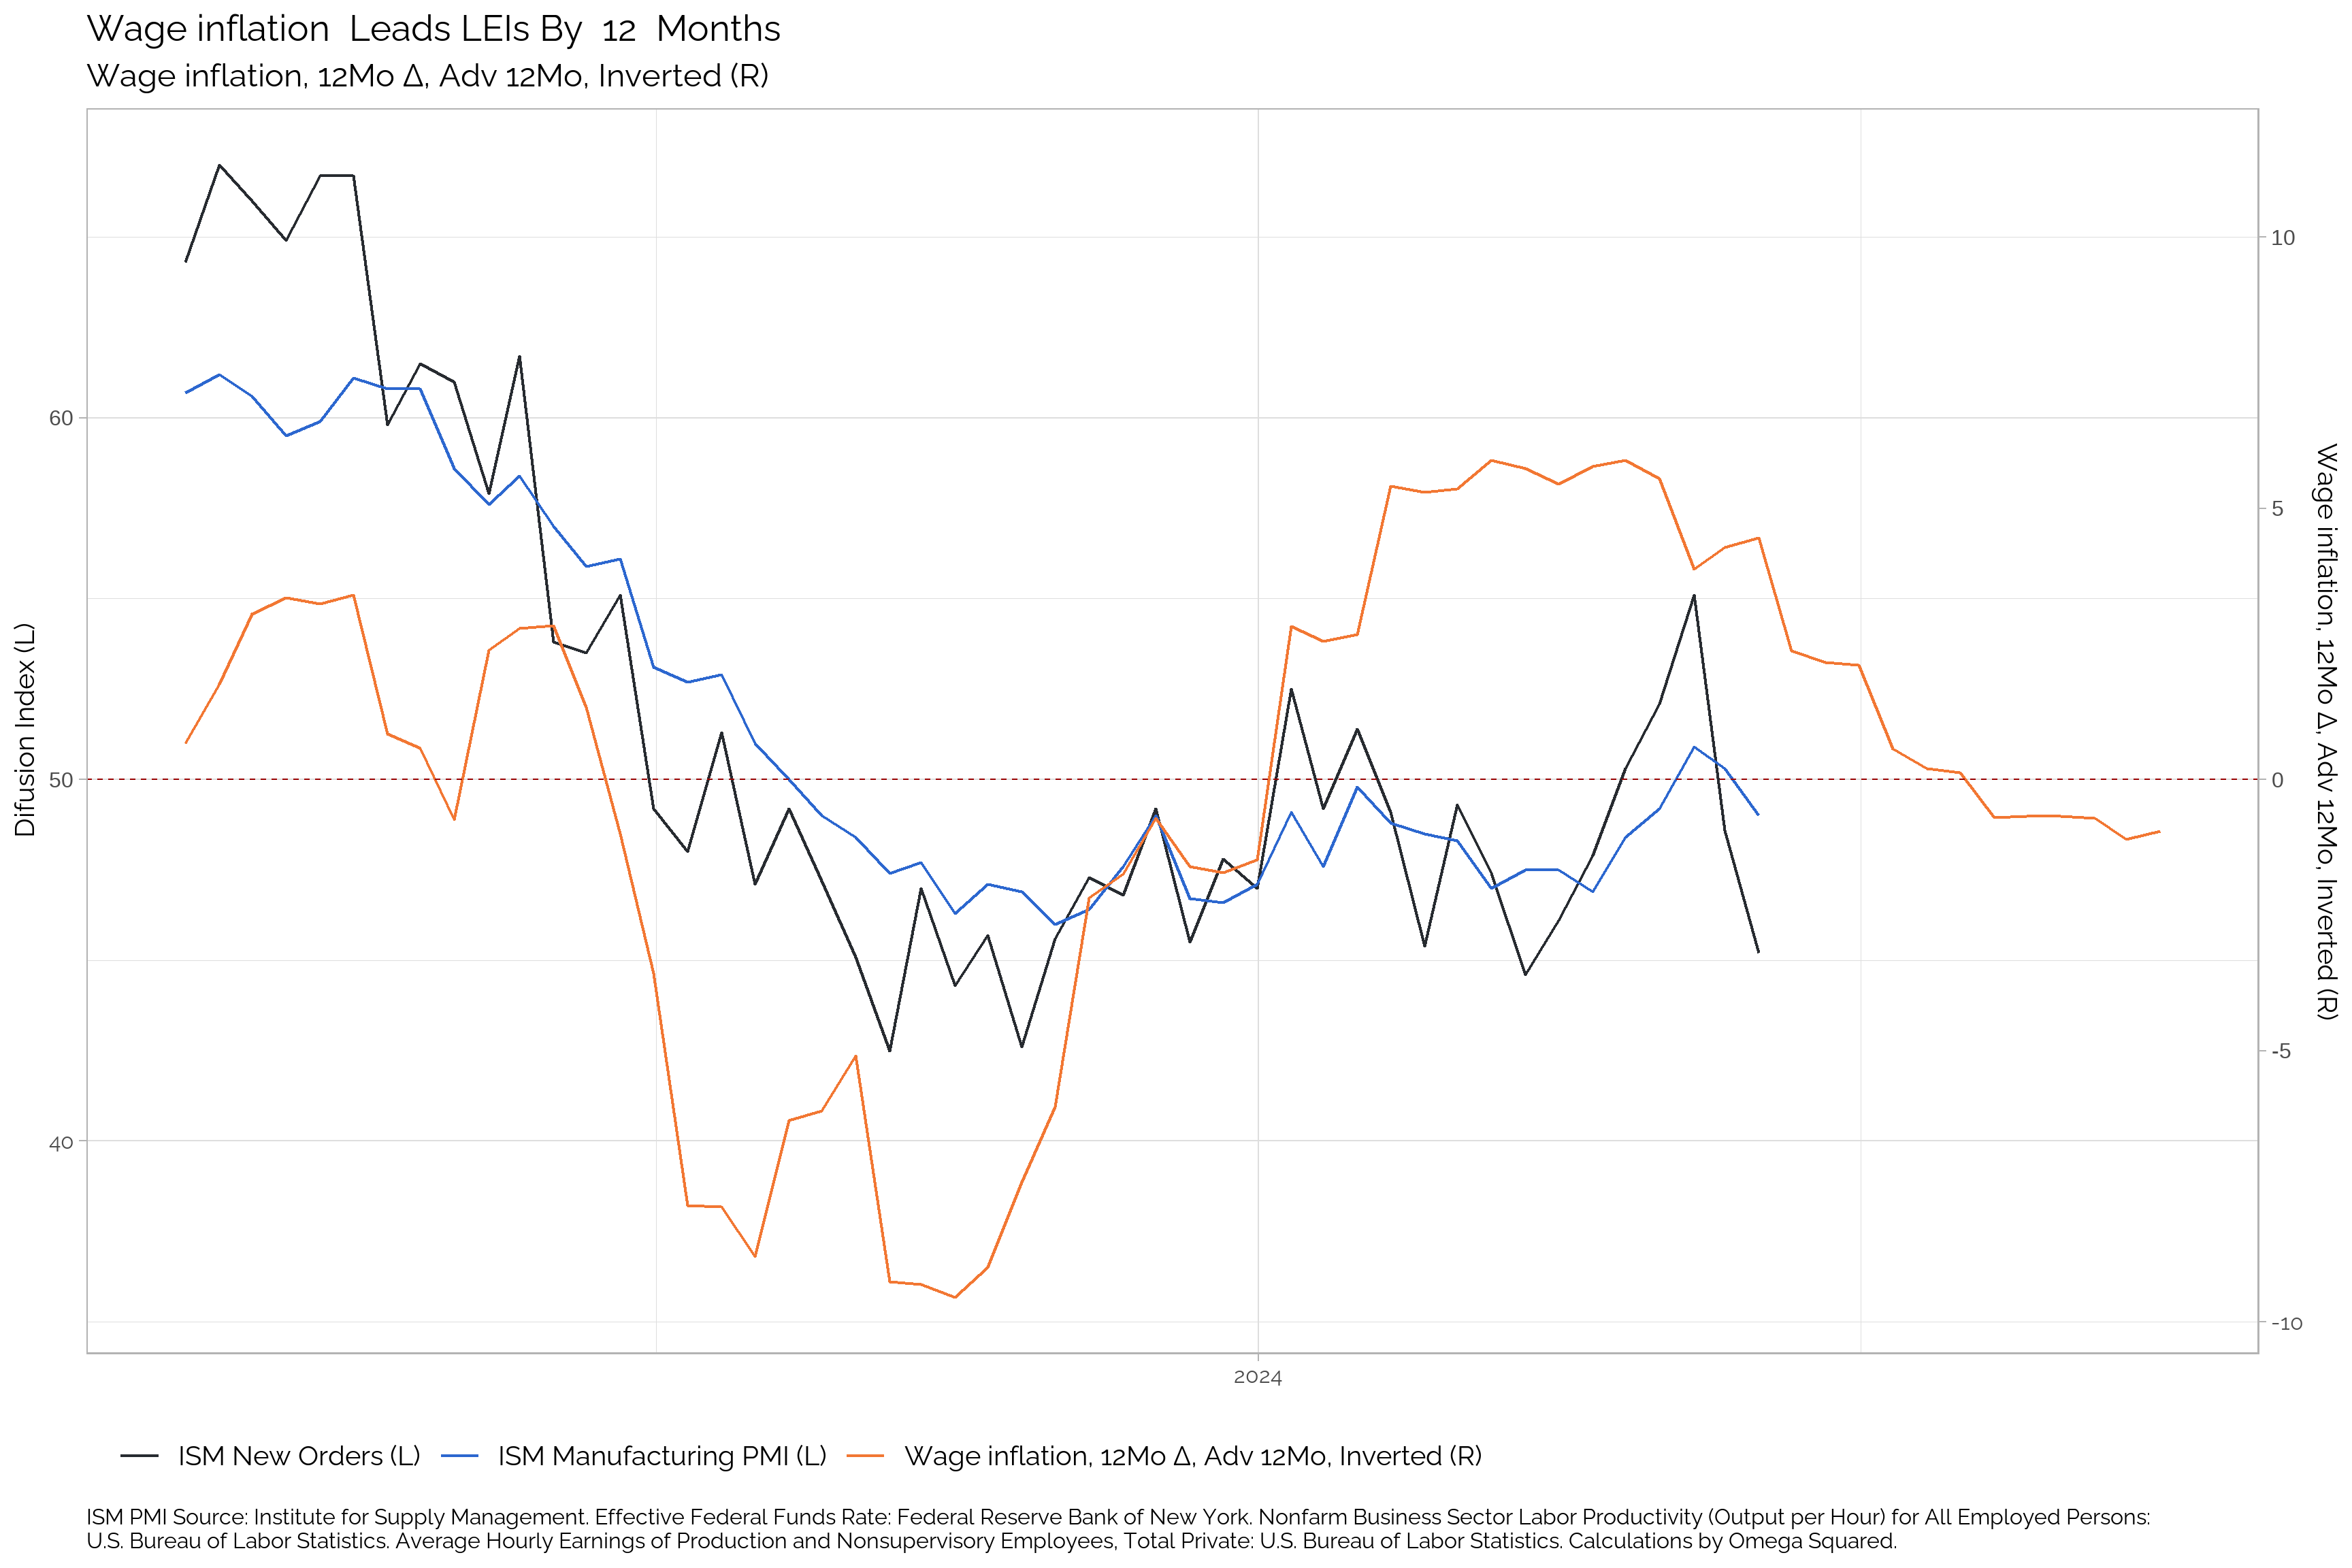
| Apr-25 | Mar-25 | Feb-25 | Jan-25 | Dec-24 | Nov-24 | Oct-24 | Sep-24 | Aug-24 | Jul-24 | Jun-24 | May-24 | |
|---|---|---|---|---|---|---|---|---|---|---|---|---|
| Wage Inflation | 1.89 | 2.18 | 2.02 | 2.04 | 2.09 | 2.17 | 1.7 | 1.68 | 1.47 | 1.13 | 1.18 | 1.09 |
| Δ in Wage Inflation | -0.29 | 0.16 | -0.02 | -0.05 | -0.08 | 0.47 | 0.02 | 0.2 | 0.34 | -0.05 | 0.09 | 0.15 |
Jobs Hard To Fill
The importance of employment in the Fed’s monetary policy function has resulted in a number of AEIs from unlikely sources. The NFIB Job Openings data is one of these. It has been a consistent indicator of future trends in the ISM for roughly 35 years.
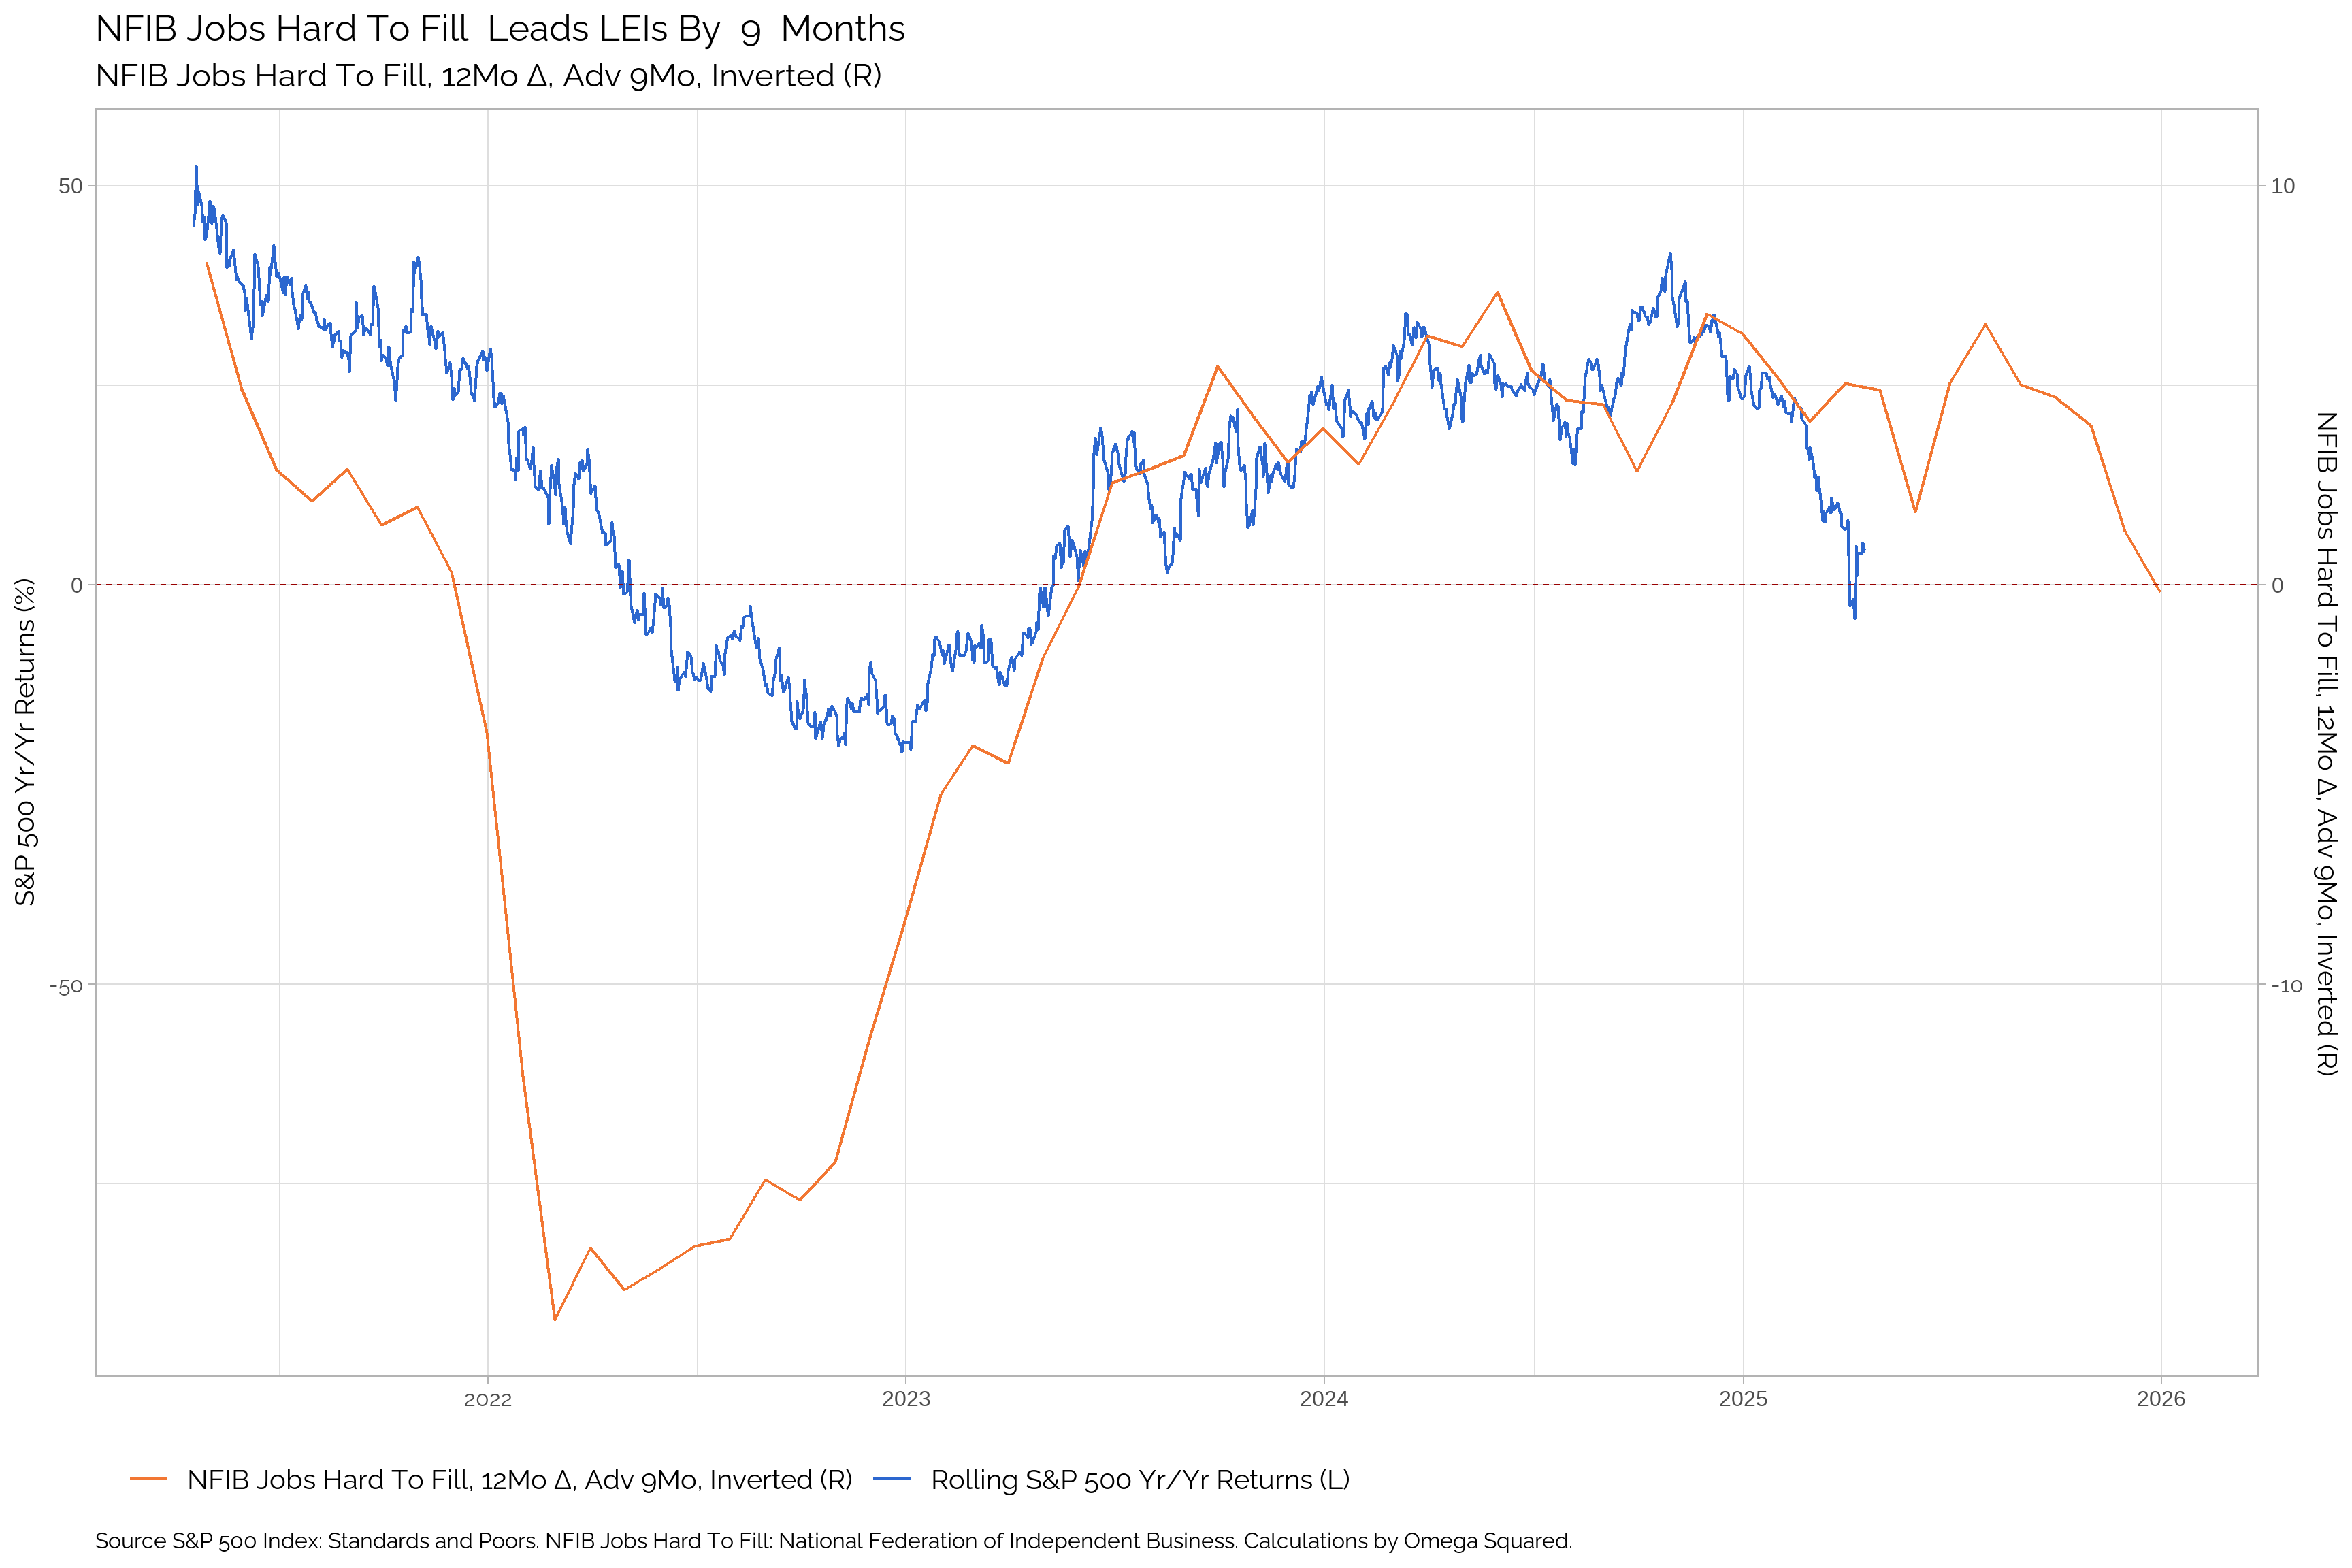
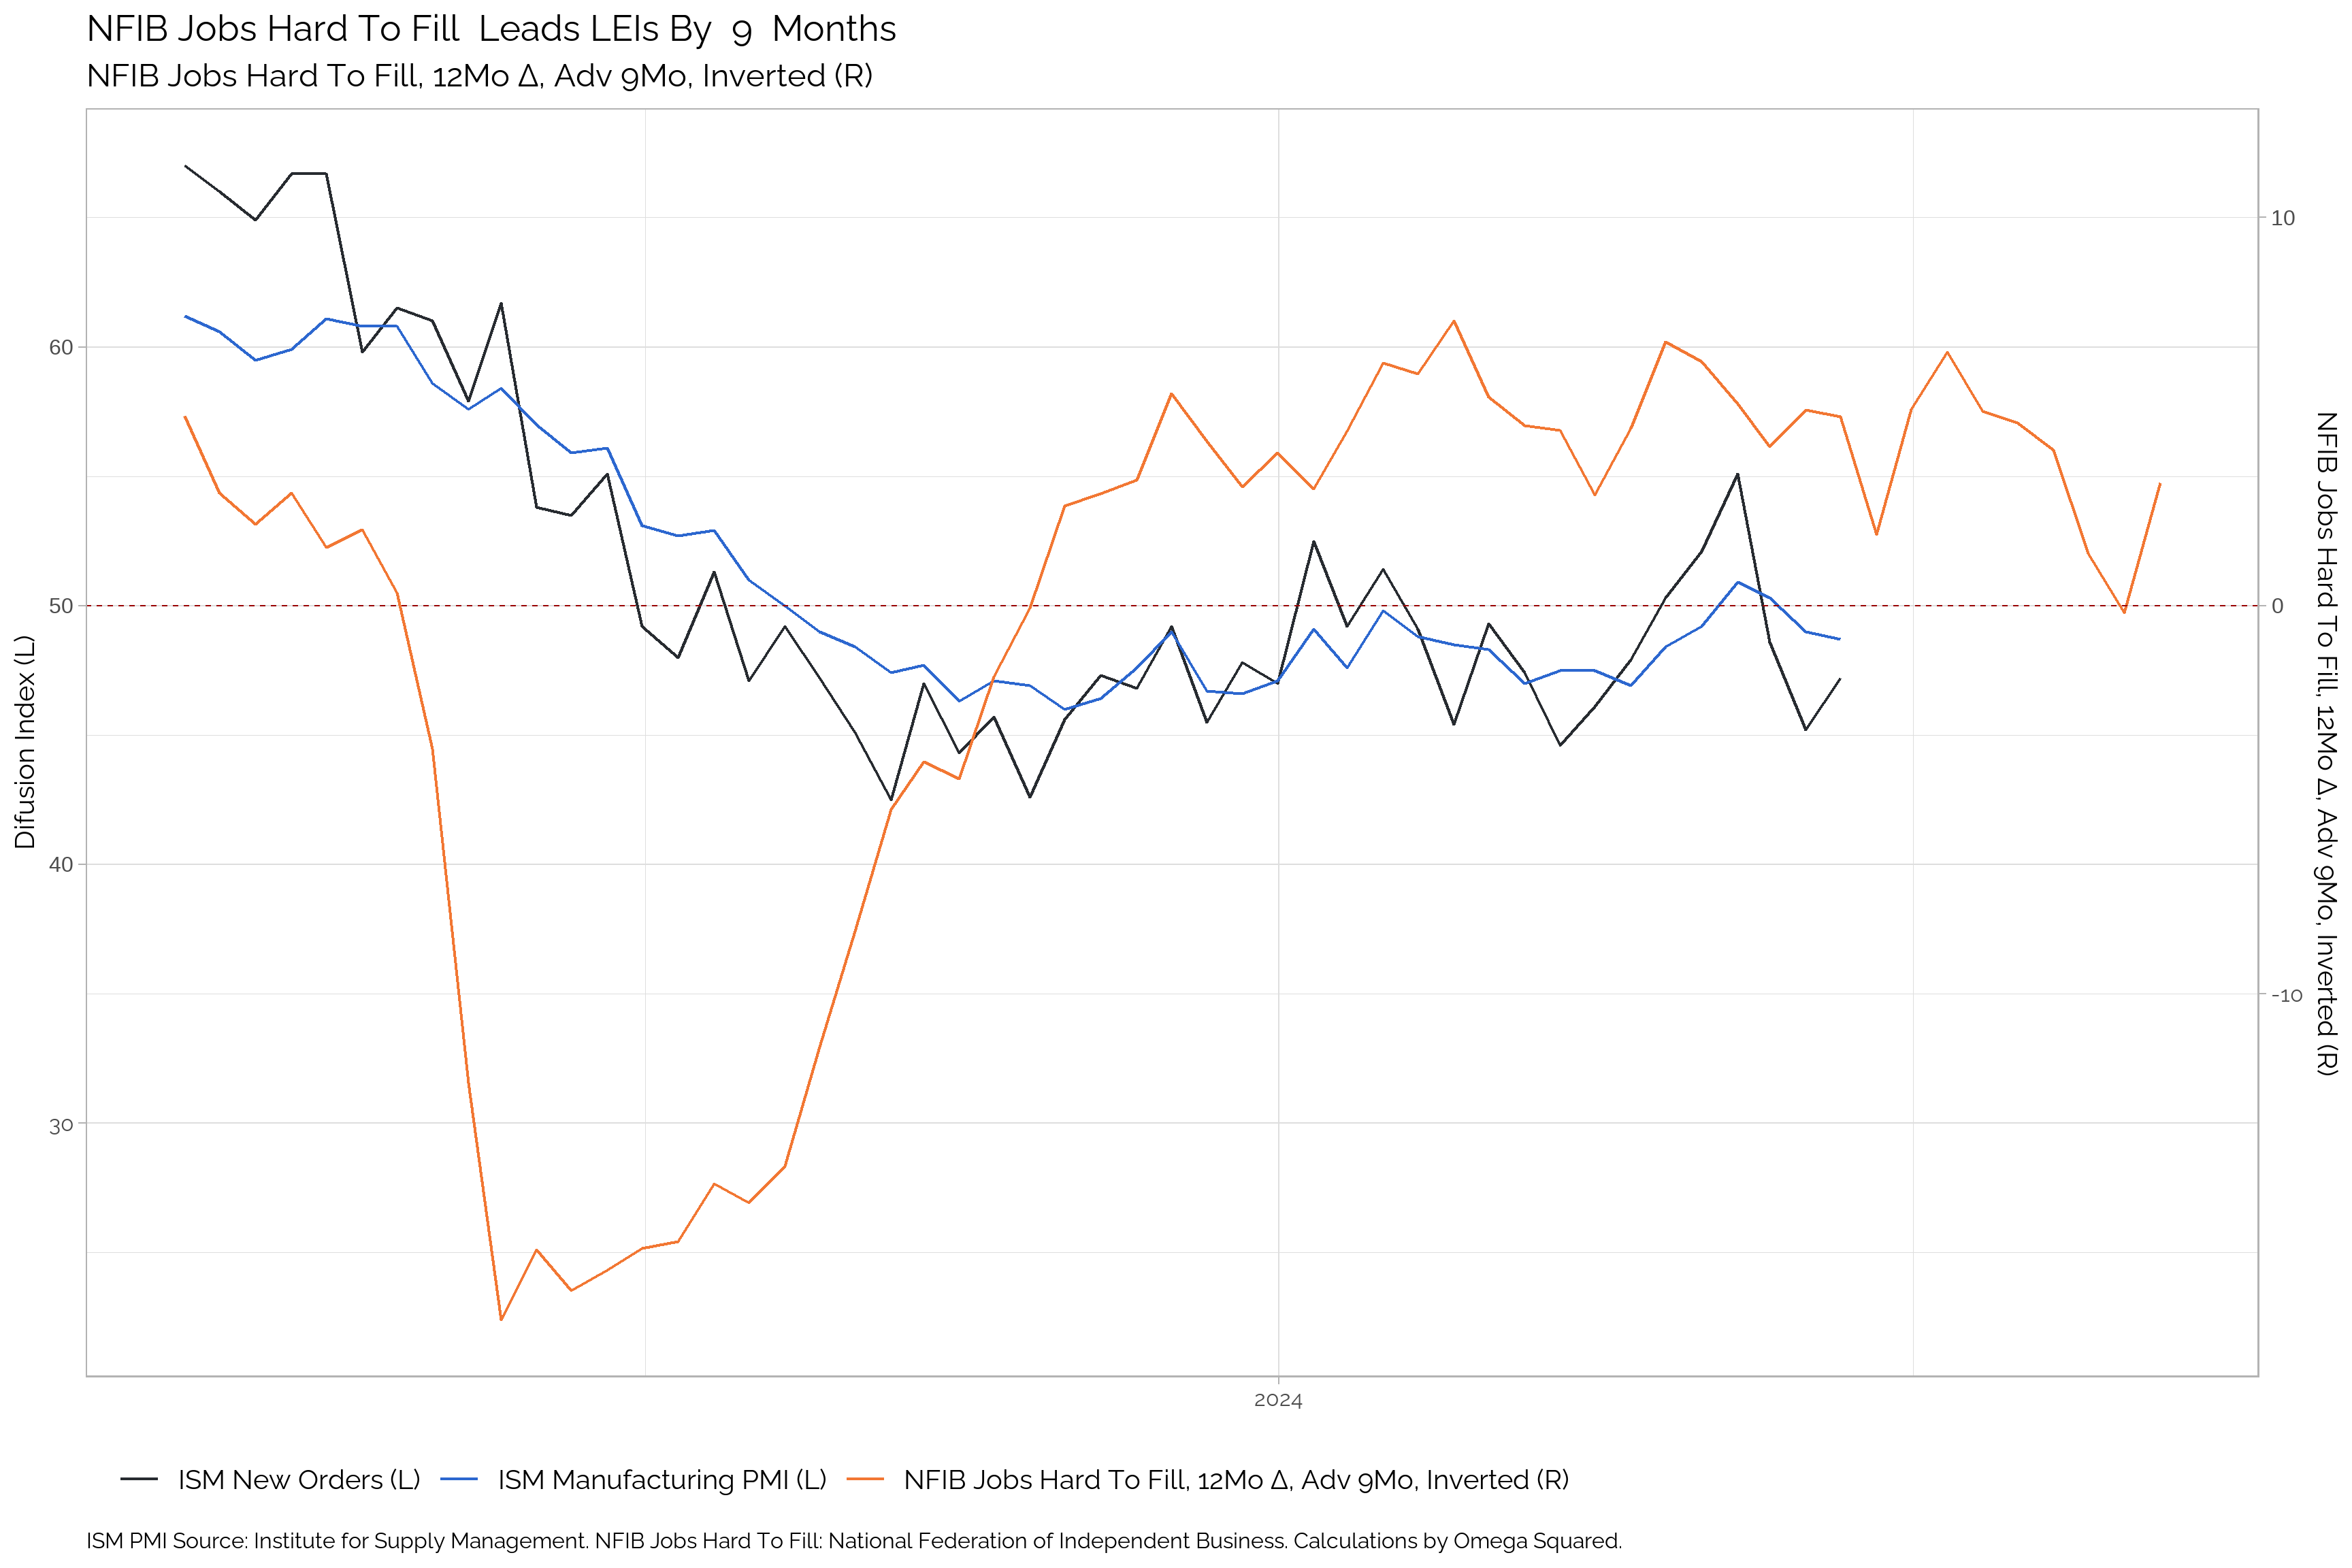
| Apr-25 | Mar-25 | Feb-25 | Jan-25 | Dec-24 | Nov-24 | Oct-24 | Sep-24 | Aug-24 | Jul-24 | Jun-24 | May-24 | |
|---|---|---|---|---|---|---|---|---|---|---|---|---|
| Jobs Hard To Fill | 36.5 | 35 | 34.09 | 35.18 | 36.06 | 36.92 | 38.44 | 40.59 | 38.77 | 38.64 | 40.38 | 38.26 |
| Δ in Jobs Hard To Fill | 1.5 | 0.9 | -1.09 | -0.88 | -0.86 | -1.52 | -2.14 | 1.81 | 0.13 | -1.74 | 2.12 | 1.94 |